Abstract
We utilize in situ, temperature-dependent atomic force microscopy to examine the gel-fluid phase transition behavior in supported phospholipid bilayers constructed from 1,2-dimyristoyl-sn-glycero-3-phosphocholine, 1,2-dipentadecanoyl-sn-glycero-3-phosphocholine, and 1,2-dipalmitoyl-sn-glycero-3-phosphocholine. The primary gel-fluid phase transition at Tm occurs through development of anisotropic cracks in the gel phase, which develop into the fluid phase. At ∼5°C above Tm, atomic force microscopy studies reveal the presence of a secondary phase transition in all three bilayers studied. The secondary phase transition occurs as a consequence of decoupling between the two leaflets of the bilayer due to enhanced stabilization of the lower leaflet with either the support or the water entrained between the support and the bilayer. Addition of the transmembrane protein gramicidin A or construction of a highly defected gel phase results in elimination of this decoupling and removal of the secondary phase transition.
INTRODUCTION
Supported phospholipid bilayers are a widely utilized model system for studying lipid bilayer membranes (Radler et al., 1995; Sackmann, 1996; Schneider et al., 2000; Xie and Granick, 2002a). The localization of the bilayer to a planar support allows the system to be interrogated by surface-sensitive techniques (Feng et al., 2004; Kim et al., 2001; Muresan and Lee, 2001; Xie et al., 2002b). The lipid molecules self-assemble into bilayers in the presence of a hydrophilic solid support, which stabilize a thin water layer between the support and the bottom leaflet of the bilayer.
The presence of a support has generated considerable discussion concerning the symmetry of supported phospholipid bilayer systems. Although the presence of the thin water layer underneath the supported bilayer provides some flexibility and fluidity, which enables lateral diffusion in the bilayer system (Cremer and Boxer, 1999; Sackmann, 1996), consequences of the interaction between the lower leaflet and the highly confined water layer still remain uncertain (Hetzer et al., 1998; Kim et al., 2001; Liu and Conboy, 2004; Naumann et al., 2002; Yang and Appleyard, 2000).
The phase transition behavior from gel to fluid phase (Lβ to Lα) of phosopholipid membranes has been studied in great depth in the past (Korrenman and Posselt, 2000; Lewis et al., 1987; Marsh et al., 1977; Morrow and Davis, 1988; Prenner et al., 1999). However, due to the accessibility of sample forms, such studies are mainly conducted with lipid vesicles, both multilamellar (Janiak et al., 1976; Lewis and McElhaney, 1990) and unilamellar (Marsh et al., 1977; Metso, 2003). For 1,2-dimyristoyl-sn-glycero-3-phosphocholine (DMPC), 1,2-dipentadecanoyl-sn-glycero-3-phosphocholine (diC15-PC), and 1,2-dipalmitoyl-sn-glycero-3-phosphocholine (DPPC) vesicles, the gel-fluid phase transition temperatures (Tm) have been reported to be 24°C, 33°C, and 41°C, respectively (Marsh, 1990).
Recent attempts in examining the phase transition behavior of supported lipid bilayers have been made either by modifying the shape of solid supports (Naumann et al., 1992; Yang and Appleyard, 2000), or by using various surface-accessible techniques, such as neutron reflectivity (Hughes et al., 2002), sum-frequency vibrational spectroscopy (Liu and Conboy, 2004), and atomic force microscopy (Leonenko et al., 2004; Tokumasu et al., 2002; Xie et al., 2002b). In either vesicular form or the supported form, it is believed that the gel-fluid phase transition of phosphatidylcholines is a first-order process.
Recently, Cramb and co-workers (Leonenko et al., 2004) examined the phase transition of DPPC and reported the existence of a secondary “disordered fluid phase” transition between 53 and 60°C. The origins of this transition remain unclear as does an understanding of conditions required for its observation. Additionally, these authors utilized a high-temperature slew rate (1°C/min) possibly implicating a kinetic effect in its formation.
Gramicidin A (gA) is a transmembrane peptide which adopts β-helical form when incorporated in DMPC bilayers (Harroun et al., 1999). gA has shown a disordering effect in gel-phase DMPC and an ordering effect in the fluid phase (Chapman et al., 1977; Lee et al., 1984; Zein and Winter, 2000). gA is also known to slightly modify the thermotropic behavior of lipid bilayer phase transition by reducing its Tm and broadening its transition range (Ivanova et al., 2003; Prenner et al., 1999).
In this study, we present detailed results examining the phase transition behavior of DMPC, diPC-15, and DPPC phospholipid bilayers supported on mica by using AFM with temperature control. The gel-fluid phase transition is clearly shown by the morphological and height changes. A secondary transition appearing as protrusion features is observed at temperature ∼5°C above Tm. Detailed control experiments show that the origin of this secondary transition is a decoupling of the top and bottom leaflets in the bilayer during the phase transition. Methods to eliminate this decoupling are described.
EXPERIMENTAL PROCEDURE
Sample preparation
Materials
All solutions were prepared with ultrapure water (18.2 MΩ cm, Milli-Q UV Plus, Millipore, Billerica, MA). A 10-mM, pH 6.4 buffer was made from Na2HPO4 and NaH2PO4·H2O (PBS). DMPC, diC15-PC, and DPPC were purchased from Avanti Polar Lipids (Alabaster, AL), and used without further purification. Gramicidin A was purchased from Fluka Chemical (Milwaukee, WI). Chloroform (99.9%) and methanol (99.9%) were purchased from Fisher Chemicals (Fairlawn, NJ). Extrusion was performed on an Avanti Mini-Extruder from Avanti Polar Lipids.
Lipid bilayer preparation
Dry lipid films were formed from chloroform stock solutions that had been argon gas-evaporated and vacuum-dried overnight to remove excess solvent. PBS was added to the dry lipid film and the solution was warmed above the Tm of the lipid for a minimum of 2 h with periodic vortexing to form hydrated multilamellar vesicles. Single-walled vesicles were created from this solution through freeze/thaw cycles and extrusion through a 100-nm polycarbonate membrane. gA was incorporated into hydrated vesicles through addition of gA dissolved in methanol before the drying step (Leonenko et al., 2000; Zein and Winter, 2000). Lipid bilayers with or without gA were prepared using the vesicle fusion technique (Brian and McConnell, 1984; Xie et al., 2002b). For AFM experiments, a sheet of freshly cleaved mica was used as the substrate and placed at the bottom of the AFM fluid cell. Lipid vesicles were injected in the cell and were incubated above the lipid phase transition temperature for one hour to encourage bilayer formation. Excess unfused vesicles were removed by exchanging the solution in the cell with buffer solution several times after cooling the sample down to room temperature. AFM images of the pure bilayer were similar to those reported previously (Xie et al., 2002b).
Magnetic acoustic code (MAC) atomic force microscopy
AFM experiments were carried out with a PicoSPM 300 (Molecular Imaging, Tempe, AZ) with a Type D scanner controlled with a NanoScope E controller (Digital Instruments, Houston, TX). The cantilever has a natural resonance frequency of 65 ∼ 75 kHz in air, and 22 ∼ 25 kHz in the aqueous environment. The spring constant of the cantilever is 2.8 N/m. Images were collected at 256 × 256 pixel resolution at a scan rate of <2 Hz. Images were flattened with NanoScope E version 4.23 (Digital Instruments) and further analyzed by WSxM version 3.0 (Nanotec Electronica, Madrid, Spain).
Temperature control during AFM experiment was realized by using the 1× Peltier sample stage (Molecular Imaging). The sample stage was wired to a cryogenic temperature controller, model DTC-500 (Lake Shore Cryotronics, Cleveland, OH), which provided heating current, and a home-built device that monitored the resistance of the resistance temperature detector directly underneath the sample. An elevated ice-water reservoir using gravity feeding was used to cool the Peltier stage. Temperatures were stepped for <1°C in both increasing and decreasing cycles, and were parked for more than 5 min at each step to ensure equilibrium. During each temperature cycle, images were captured at the same area of the bilayer surface for each sample unless otherwise noted.
RESULTS
Phase transition behavior
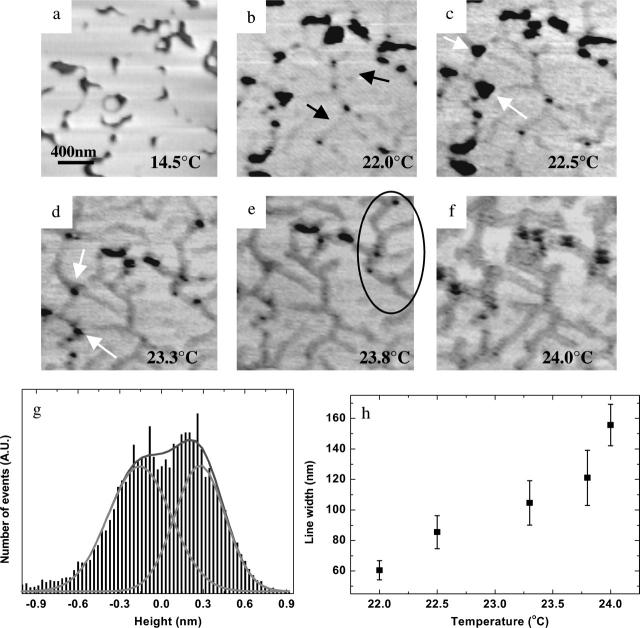
In Fig. 1, AFM images obtained from 14.5°C to 23.3°C show morphological changes in the bilayer near the phase transition. Fig. 1 a shows a heterogeneous image with a number of defects obtained at 14.5°C as reported previously for gel-phase DMPC bilayers (Feng et al., 2004; Xie and Granick, 2002a). The darkest areas of the image are defects in the bilayer extending to the bare mica surface. The height difference between the gel-phase lipid bilayer and the mica was found to be 4.6 nm, consistent with the bilayer height as determined by neutron reflection (4.6 nm) (Johnson et al., 1991) and x-ray diffraction (4.8 nm) (Tristram-Nagle et al., 2002) methods.
FIGURE 1.
(a–f) MAC-mode AFM images from DMPC bilayers on mica at indicated temperatures (2 × 2 μm). Dark color is the mica substrate, and light color is the lipid bilayer. (g) Sample histogram analysis for height difference. (h) Relationship between line width and temperature.
A temperature increase to 22.0°C results in two changes to the bilayer structure (Fig. 1 b). First, the defects appeared blurred when compared to the defects in Fig. 1 a, which likely is a result of melting and diffusive movement at defect edges (Feng et al., 2004). Second, Fig. 1 b shows the presence of a cracking pattern wherein the cracks, denoted by arrows in Fig. 1 b, appear as depressions throughout the image. In multiple measurements, the height difference between the lighter colored gel-phase bilayer and the cracks is found to be ∼0.4 nm. Interestingly these changes occurred ∼1°C below the phase transition temperature of the supported DMPC bilayer.
Further increases in temperature to 22.5°C (Fig. 1 c) and then 23.3°C (Fig. 1 d) led to additional changes in bilayer morphology. The cracks first seen in Fig. 1 b at 22.0°C expand in width and connect the defects together as indicated by arrows in Fig. 1 c. The defects also begin filling with lower height features associated with the liquid bilayer phase as temperature is increased to 23.3°C (Fig. 1 d). The crack width has expanded to ∼50% of the image (Fig. 1 f) by 24°C and only a few small defects are left. A histogram of the image shown in Fig. 1 g exhibits two distinct heights with a difference between them of ∼0.43 nm. Additionally, the change in line width is directly proportional to temperature, as shown in Fig. 1 h. This clearly indicates that the fluid phase coexists with the gel phase over an ∼2°C temperature range. These observations extend those found in a previous AFM study of the DMPC phase transition; however, the origin of these cracks was not discussed (Tokumasu et al., 2003a).
Analysis of the shape of the cracks reveals another characteristic of the phase transition. The cracks are not straight, but rather make certain angles with respect to each other. The line spacing is also relatively uniform, especially as shown in the marked area in the upper right corner of Fig. 1 e. Fig. 2 shows the results of an autocorrelation performed on an image with the crack pattern. Autocorrelation is defined as G(k1,k2) = Σf(x,y) f(x + k1,y + k2), where f(x,y) is the image matrix. This equation takes the image and the same image shifted a distance k1 and k2 in the x and y axes with respect to the center of the image. The resulting image, G(k1,k2), is a measure of how different the two images are. The more similar the image and the shifted image are, the higher the value of the autocorrelation. In autocorrelation, the highest value is obtained at the center of the image (where k1 and k2 are zero). Any periodicity in the original image will be shown as a periodic pattern in the autocorrelation.
FIGURE 2.
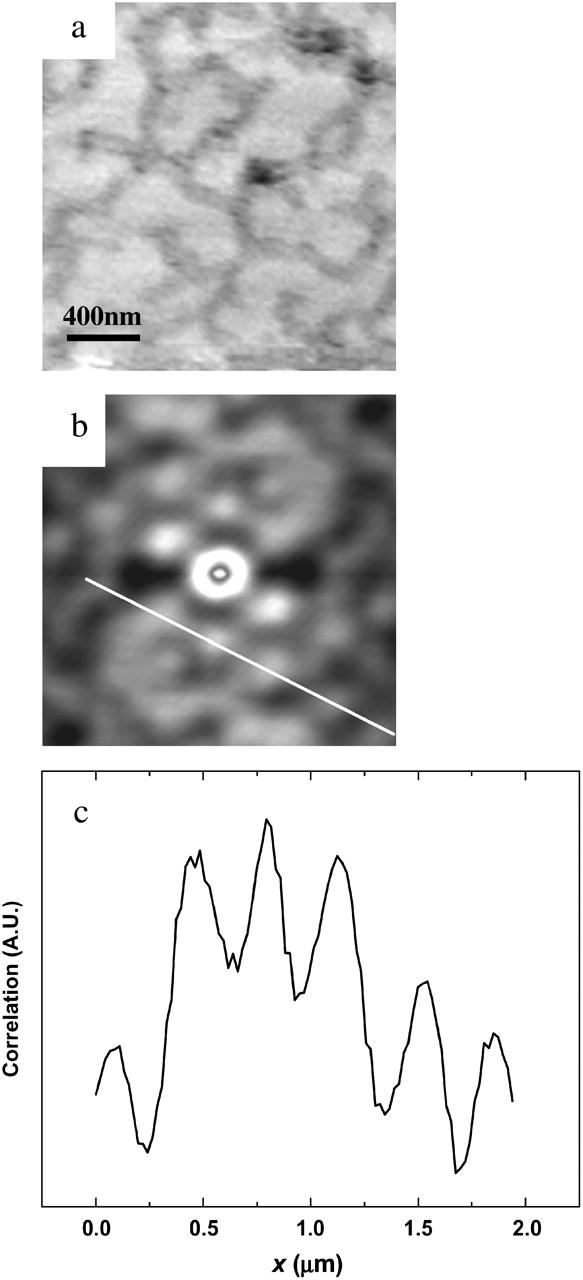
(a) MAC-mode AFM images from DMPC bilayer at 24°C (2 × 2 μm). (b) Autocorrelation image of a. (c) Cross-section analysis from b showing periodicity.
Fig. 2 a shows a 2 × 2-μm area obtained at 24°C with surface features almost identical to Fig. 1 f. Autocorrelation performed on this image is shown in Fig. 2 b, with lighter shades of gray representing more highly correlated areas. Periodicity was found in the highly correlated area of Fig. 2 b and cross-sectional analysis performed on this image showed a relatively uniform spacing of ∼353 ± 27 nm (n = 17), as shown in Fig. 2 c. The correlation pattern around the center of Fig. 2 b clearly exhibits a hexagonal pattern with a side length of ∼380 ± 20 nm and two vertical sides slightly larger.
High-temperature structure
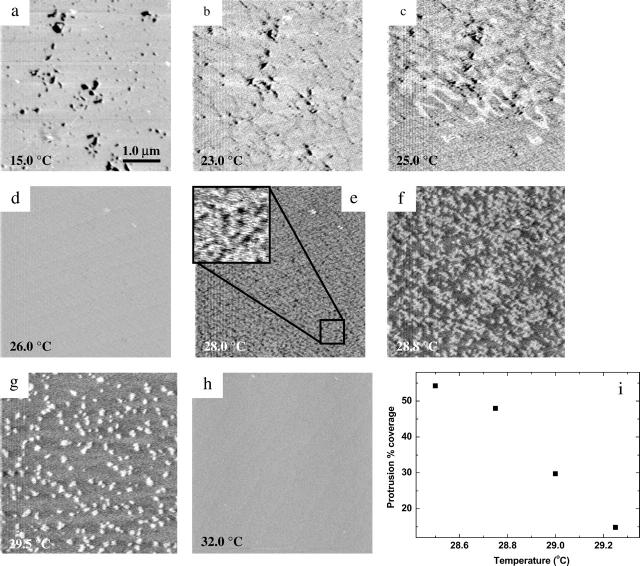
Fig. 3 shows a complete set of images describing the transition between the gel and fluid phases for DMPC. Formation of the gel phase DMPC bilayer is indicated in Fig. 3 a, and increasing the temperature leads to crack formation as described above and shown in Fig. 3 b. Near the transition temperature, at 25.0°C, Fig. 3 c shows the process of transition from gel to fluid phase in one downward scanning image. The upper half of the image is elevated with broadened line depressions as the lipid was still mainly in gel phase; however, the lipid continued to melt during scanning and was in the fluid phase toward the lower half of the image. The thickness of the top and bottom half of the image shows a 0.35-nm difference. The following featureless image at 26°C (Fig. 3 d) signifies that the thicker gel phase has fully transitioned to the lower fluid phase.
FIGURE 3.
(a–h) MAC-mode AFM images from DMPC bilayer on mica at indicated temperatures; panel c reveals the transition within one downward scanning image. (i) Relationship between protrusion percentage coverage and temperature (5 × 5 μm).
The featureless surface morphology remained until the temperature was raised to 28°C, at which point tiny voids appeared in the surface as shown in Fig. 3 e and the inset. As the temperature was raised to 28.8°C the voids expanded in size to become the dark area in Fig. 3 f. The difference in height between the remnant continuous “fluid phase” and the thinner growing phase (dark area in Fig. 3 f) was determined to be 0.32 ± 0.03 nm (n = 10) by using a histogram analysis. A further increase in the temperature to 28.8°C caused the thinner phase to occupy <10% coverage, leaving only a few protrusions (Fig. 3 g). The height of these protrusions remained at ∼0.32 nm throughout the temperature range from 29° to 30°C. However, the number of protrusions varied inversely as a function of the temperature between 28° and 29.5°C (Fig. 3 i). Finally, at 31°C a homogeneous bilayer surface was imaged, denoting full conversion to the thinner phase. No additional changes in the bilayer surface were seen up to 40°C (Fig. 3 h).
We also examined the stability of the protrusions over time and the reversibility of the cracking transition between 28°C and 31°C. The protrusions remained on the surface of the DMPC bilayer for a >8-h time period. Interestingly, the observation of surface morphological change of the bilayer during phase transition is completely reversible. The cracking and protrusions were observed in the same temperature range with both increasing and decreasing temperature. This observation suggests strongly that the protrusions do not form as a result of a kinetic effect on going from the gel to the fluid phase.
Other phosphotidylcholines
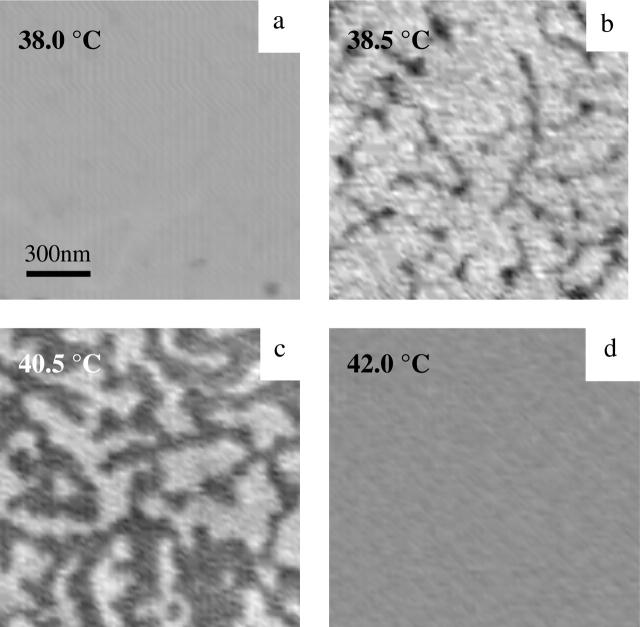
To examine the ubiquity of the high-temperature protrusion structure seen in Fig. 3, we examined the phase transition behavior of additional phosphotidylcholines. Fig. 4 shows a sequence of images obtained from diC15-PC obtained above the gel-fluid phase transition temperature, which is 33°C for this material. The defected gel phase forms cracks as the phase transition temperature is approached and a featureless phase is formed a few degrees (at 38°C) above the phase transition temperature (Fig. 4 a), similar to the DMPC bilayer discussed above. As the temperature was raised to 38.5°C (Fig. 4 b) tiny voids with fine cracking lines appeared. The fine line feature expanded in width and length as the temperature increased, resulting in the diminishing of the higher light gray area, as shown in Fig. 4 c. The height difference between the top and bottom layer was determined to be ∼0.37 nm by using a histogram analysis. Gradually, the protruding area coverage diminished at increasing temperatures, until at 42°C the surface morphology became completely featureless again (Fig. 4 d). Relative to the pattern of dot-like depressions found for DMPC, the high-temperature phase in diC15-PC appears more continuous.
FIGURE 4.
MAC-mode AFM images from diPC-15 bilayer on mica at indicated temperatures (a–d) showing the development of the protrusions (1.5 × 1.5 μm).
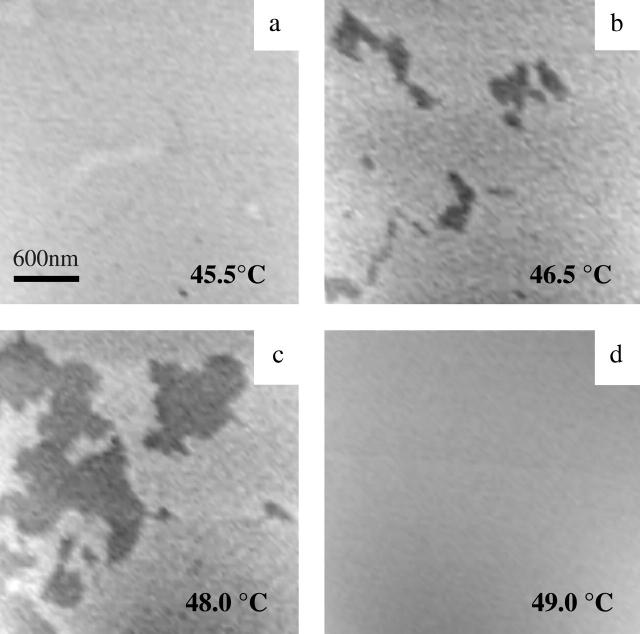
Fig. 5 shows the equivalent set of images obtained for a bilayer composed of DPPC. The phase transition temperature of DPPC vesicles determined by differential scanning calorimetry (DSC) was 41°C. Above the phase transition temperature, lipid defects gradually filled in. Fig. 5 a shows a completely flat surface at ∼45.5°C, ∼4°C above the phase transition temperature. At 46.5°C, the secondary structure observed in both DMPC and diC15-PC appeared again in the DPPC bilayer. Fig. 5 b clearly shows that the depression does not appear to be line-shaped, but forms domains instead. The height difference shown here is 0.37 nm from a histogram analysis. The lower surface expanded gradually as the temperature increased to 48°C, shown in Fig. 5 c. Finally, Fig. 5 d shows a homogeneous surface above 49°C, indicating the transition was complete.
FIGURE 5.
MAC-mode AFM images from DPPC bilayer on mica at indicated temperatures (a–d) showing the development of the protrusions (3 × 3 μm).
Phase transition in highly defected bilayer films
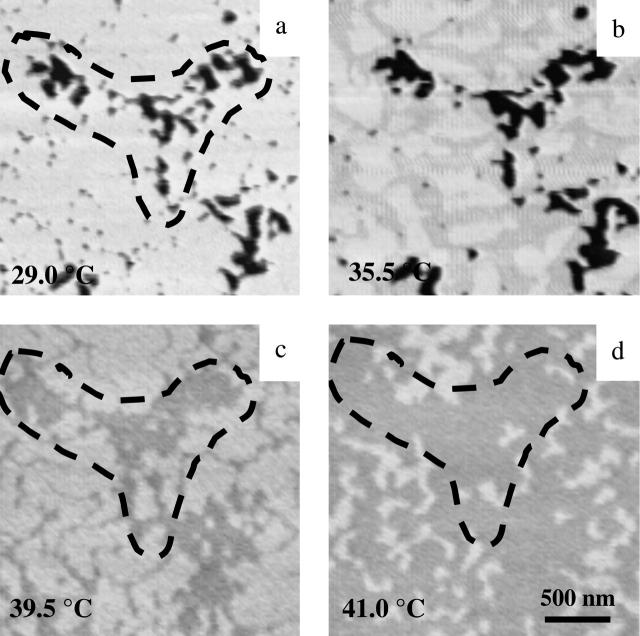
To further probe conditions necessary for observing the high-temperature protrusions, we examined the phase transition in a highly defected bilayer. Defected bilayers are created by decreasing the incubation time for vesicle fusion to the mica surface. An example of a highly defected surface of diC15-PC is shown in Fig. 6. Fig. 6 a reveals a T-shaped defect in gel-phase diC15-PC, which has been marked with a dotted line. Slightly above Tm, at 35.5°C, the T-shaped defect persisted, although the lipid surface exhibited the expanded channels which are the hallmark of the primary phase transition. At 39.5°C, Fig. 6 c shows the protrusions equivalent to those seen in Fig. 4 b. The image shows, however, that the surface retains the memory of the defect (dotted line), even though the defect is now filled in. In the newly filled defected area (dotted line, Fig. 6, c and d), a secondary protrusion was not noted, even though the bilayer surrounding the once defected region contains protrusions (Fig. 6, c and d). The defects are likely filled with disordered fluid-phase lipid because the height difference between the protrusions and the previously defected areas shown in the image was ∼0.4 nm, which is the same order of magnitude for protrusions in Fig. 3 g. At 41°C, more of the depressed domains were exposed as protruding areas diminished, as shown in Fig. 6 d. The T-shaped domain was less visible as the surrounding areas were lowered to the same height and the surface became homogeneous above 42°C.
FIGURE 6.
MAC-mode AFM images from a heavily defected diPC-15 bilayer on mica at indicated temperatures (a–d) (2.5 × 2.5 μm).
gA-incorporated DMPC
To examine the influence of transmembrane peptides on the phase transition behavior of the supported bilayers, we performed the same phase transition measurements on gA-incorporated DMPC bilayers. Gramicidin is a peptide known to form small ion channels across the bilayers. Fig. 7 shows images of a DMPC bilayer containing 2 mol % gA. The surfaces shown in this set of images were not captured in the same area. The images were obtained at the same temperatures as those shown for the pure DMPC bilayer in Fig. 3, for facile comparison of the phase transition behavior.
FIGURE 7.
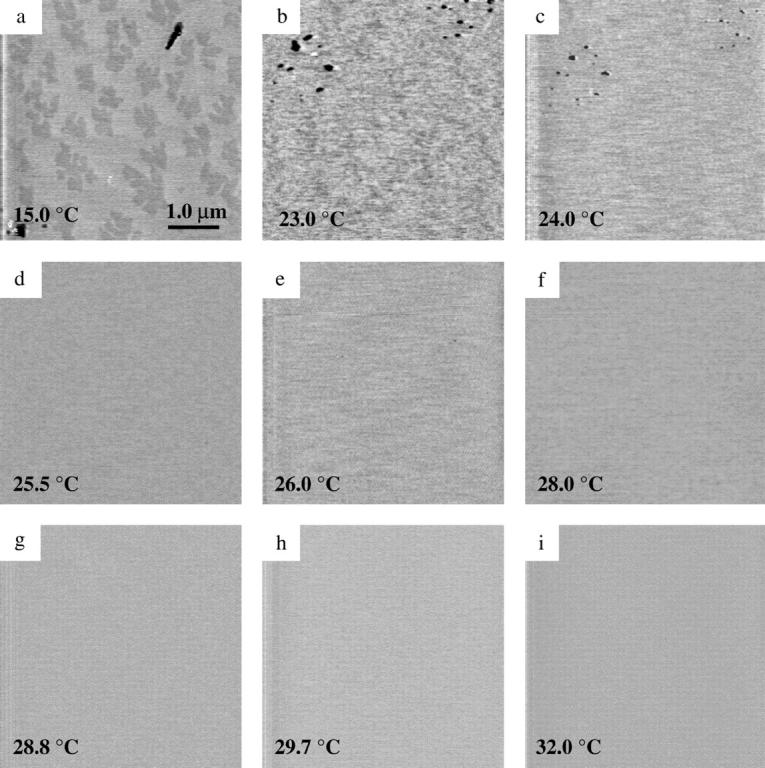
MAC-mode AFM images from gramicidin A-incorporated DMPC bilayer on mica at indicated temperatures (a–i) (5 × 5 μm).
In Fig. 7 a the DMPC bilayer surface at 15°C shows significant heterogeneity in addition to the presence of lipid defects due to gA incorporation. The elevated light gray and depressed dark gray regions clearly indicate a height difference of 0.4 nm within the gel-phase bilayer. A previous AFM study on gA-incorporated phosphocholine (PC) bilayers (Mou et al., 1996) (DPPC) discussed in detail the influence of the amount of gA mol % to the observed morphology in gel-phase lipids. Contact-mode AFM images shown by Mou et al. demonstrated domain formation when 2 mol % gA was incorporated in gel-phase DPPC bilayers. The depressed regions observed in Fig. 7 a are associated with gA-rich domains, whereas the elevated regions are the gA-poor ones. The lack of fine line-shaped depressions within the gA-rich domains in comparison to that reported previously (Mou et al., 1996) may arise from the difference in lipid materials (DMPC versus DPPC) or the difference in imaging modes (MAC mode versus contact mode). Mou et al. assert that in their attempt to observe gA-incorporated surface, DMPC provided lower contrasts than DPPC. The heterogeneity in Fig. 7 a clearly indicates the incorporation of gA to the bilayer system.
As the temperature increases from 15°C (Fig. 7 a) to 23°C (Fig. 7 b) the dark gray regions no longer have distinct shapes, which suggests a mixing of gA-rich and gA-poor domains. Unlike the pure DMPC case, the topology of the bilayer seen in Fig. 7 c did not crack near 24°C, as defects are covered with lipid during the phase transition. The phase transition for the gA-DMPC system occurred at a slightly lower temperature than DMPC, as noted from AFM images at ∼25.5°C (compare Fig. 3 d to Fig. 7 c). This observation is in accord with previous DSC measurements, which showed that gramicidin affected the transition temperature, transition enthalpy, and cooperativity for DMPC bilayers (Ivanova et al., 2003; Prenner et al., 1999). Above 25.5°C, the gA-DMPC bilayers have a complete flat topography with no indication of a higher temperature structure when monitored up to 40°C (Fig. 7, d–i).
The observation of the one-step phase transition is confirmed independent of the amount of peptide integrated up to 7 mol %. A relatively homogeneous morphology of gel-phase DMPC surface occurred when the amount of gA was >5 mol %, which is consistent with previous AFM observations with incorporated gA (Mou et al., 1996).
DISCUSSION
The results above provide insight into processes occurring as a result of the phase transition between the gel and fluid phases of several supported phospholipid bilayers. We report on the origin of two phenomena, surface cracking around the phase transition temperature and the secondary structure observed at ∼5°C higher than the phase transition temperature of each lipid.
Crack behavior
We showed above the changes that occur as precursors to the gel-fluid phase transition. One of these precursors is the appearance of crack lines as the temperature approaches Tm. As shown in Fig. 1, these lines gradually develop into depressed domains on the flat lipid surface. By following their behavior as a function of temperature, it is apparent that the crack lines are the starting points for the phase transition.
We next comment on the intriguing shape and pattern of the features, which are more clearly demonstrated in the autocorrelation image shown in Fig. 2 b. The hexagonal pattern at the center of the image is likely to be associated with the hexagonal packing configuration of lipid molecules (Janiak et al., 1979; Stephens and Dluhy, 1996). This suggests that the cracks may arise from an intrinsic packing defect in the bilayer. Indeed, in a previous article, we suggested that the phase transition originated from such defects (Xie et al., 2002b). The relatively uniform spacing of ∼350 nm shown in Fig. 2 c would then be attributed to the regular distances between adjacent defects, which may arise as a consequence of strain relief during the formation of the gel phase supported system.
Origin of the protrusions
Perhaps the most interesting observation reported here is the existence of what appears to be a secondary phase transition in the phosphatidylcholine bilayers at temperatures ∼5°C above Tm. A recent report also showed these features (Leonenko et al., 2004). However, the data presented here provide considerable new insight into their origin. Before we discuss the possible origins of the protrusions seen at temperatures above Tm, we consider what these features are likely not.
First, we examine the possibility that the features are due to a contaminant. The features were observed from numerous lots of the phospholipids. We also show herein that the protrusion behavior is found for all three types of lipids studied. Measurements of Tm performed in other contexts are consistent with literature values (Feng et al., 2004), although incorporation of extraneous material is known to alter Tm. The consistent observation of this effect in different systems renders its association with a contaminant unlikely.
Second, these protrusions are likely not due to a kinetic effect. If a kinetic effect played a part in the high-temperature structure one might expect them to be temperature cycle-dependent, but we noted the same behavior in cracking and protrusion formation irrespective of the temperature ramp. The protrusions were also noted to be stable for >8 h at constant temperature, so it is doubtful that they resulted from the formation of a metastable lipid state.
Third, some lipid bilayer properties are known to exhibit odd-even effects (Douliez et al., 1996; Silvius et al., 1979), analogous to those different surface properties between odd and even chains observed in alkanethiols adsorbed on Au(111) (Graupe et al., 1999). The independence of protrusion formation from chain length (14–16 carbons) eliminates the possibility of chain-packing effects in the behaviors we observed.
Fourth, under certain conditions, such as supported multibilayers or a supported bilayer prepared in tris buffer, lipid bilayers can form ripple phases (Kaasgaard et al., 2003). In our study the supported bilayer was prepared in phosphate buffer, which does not lead to ripple phases (Leonenko et al., 2004). Furthermore, the dimensions of the cracks reported here do not match those reported for ripple phase width (13–15 nm) and depth (5 nm) (Kaasgaard et al., 2003).
An anticorrelation model of long- and short-chain lipids in a bilayer has been proposed recently (Zhang et al., 2004). Extension of this model to the phase transition situation would lead to a scenario where the gel- and fluid-phase domains in the bilayer are equal in magnitude in both leaflets but packed opposite in the top and bottom leaflets after the low-temperature transition. Although this model could give rise to the increase in asymmetry during phase transition observed by sum-frequency generation spectroscopy (SFG) (Liu and Conboy, 2004), we do not believe it can explain our observations. First, we used a single lipid in our phase transition study instead of a mixture of two lipid components with unequal acyl chain length used by Zhang et al. Second, in two component systems, previous AFM studies have revealed gel-gel and fluid-fluid domain segregations during phase transition when bilayers were prepared by vesicle fusion method (Almeida et al., 1992; Giocondi et al., 2001; Tokumasu et al., 2003b) rather than an anticorrelated mixing. Therefore, we do not believe this anticorrelation model is applicable in our study.
Excluding contamination, kinetic effects, odd-even effects, ripple phase formation, and anticorrelation of gel-fluid phase lipid, we conclude from previous studies and our data that the cracking behavior and protrusion formation results from the interaction between the solid substrate and the bilayer. Studies utilizing DSC, x-ray, or neutron reflectivity on unsupported lipid vesicles have never seen evidence of transition behaviors above the main Tm for bilayer vesicle systems. The presence of a support under the bilayer in our study can cause an asymmetry of structure between the two leaflets relative to free vesicles studies.
Despite the presence of a thin (1- to 2-nm) (Kim et al., 2001) water layer between the bottom leaflet and the solid substrate, the influence of the substrate on the physical properties of the supported membrane has been a controversial issue (Naumann et al., 1992; Yang and Appleyard, 2000). Increased defect density in supported lipid bilayers (Fang and Yang, 1997), the difference in diffusion coefficient of top and bottom leaflet (Hetzer et al., 1998), and the strong SFG signals from the supported lipid bilayer surface, indicating a local break in symmetry of the bilayer (Liu and Conboy, 2004), have all emphasized the asymmetry in supported bilayer systems. Additionally, Cremer et al. have shown that the sandwiched water layer between substrate and the bottom leaflet is highly structured (Kim et al., 2001). We suggest in the model described below that the interaction between the lower leaflet and the mica surface and/or the water structure above the mica surface leads to a stabilization of the lower leaflet and decouples the phase transition for the two leaflets.
This proposed phase transition is depicted in Fig. 8 a. A well-ordered gel-phase lipid bilayer is formed at T ≪ Tm, which corresponds to solid lipid bilayers with a few well-defined defects in the AFM images shown in Figs. 1 a and 3 a. At temperatures near Tm, some lipid molecules on the top layer undergo gel-fluid phase transition to form the crack lines and eventually depressed domains in Figs. 1, b–f, and 3, b–c). The completely featureless morphology seen in Figs. 3 d, 4 a, and 5 a corresponds to the next cartoon at approximately Tm + 2 for all three PCs with the top leaflet in fluid phase and the bottom one still in the gel phase. As temperature continues increasing to approximately Tm + 5 the bottom layer undergoes its phase transition, which results in the high temperature structures seen with AFM. Lastly, when the bottom layer completes the gel-fluid transition, the lipid surface morphology becomes featureless again.
FIGURE 8.
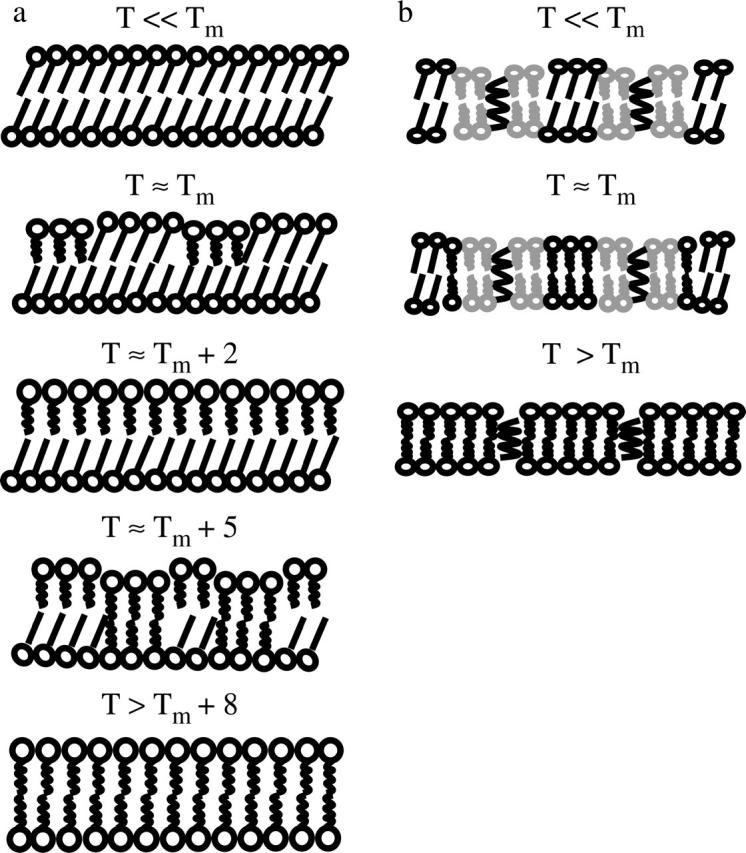
Schematics of supported bilayers during phase transition. (a) Pure PCs. (b) Gramicidin A-incorporated PCs.
The model described above seems reasonable based on AFM data and previous results from other groups utilizing SFG, DSC, and NMR on supported bilayer systems. Recent SFG measurements on supported phospholipids bilayers were interpreted as suggesting that the two leaflets of the supported bilayer could undergo the gel-fluid phase transition separately (Liu and Conboy, 2004). An interesting experiment by Yang et Tm l. has shown three peaks near the Tm of DPPC bilayers in DSC profile when microscopic mica pieces were introduced to the system (Yang and Appleyard, 2000). The three DSC peaks were ascribed to the melting of multibilayers on the mica chip at Tm, the top supported bilayer leaflet melting near Tm, and the leaflet facing the mica support melting above Tm (Yang and Appleyard, 2000). Unfortunately, the DSC results do not account for transitions occurring at mica edges, which will likely be different from that occurring on the basal plane. However, our results correlate with the DSC study denoting separate melting events for each supported lipid leaflet due to a more constrained environment near the lower leaflet. Additional AFM experiments with different chain lengths, highly defected supported bilayers, and gA incorporation further strengthen the argument for leaflet decoupling during the phase transition.
Chain length differences
The higher temperature structure was present in lipids with chain lengths 14–16 suggesting leaflet decoupling may occur in all supported lipid systems to some extent. However, the phase transition behaviors did show slight morphological differences in the three lipids studied. The depressions seen above the main transition temperature which lead from the protrusion phase to the truly fluid phase start as pinpoint voids for DMPC (inset in Fig. 3 e), line-shaped for diC15-PC (Fig. 4 b), and domain-like for DPPC (Fig. 5 b). The reason behind this difference is most likely dissimilarity in the cooperativity evinced by the three PCs.
DSC studies examining the thermotropic behavior of different-length PCs were unable to measure the transition width accurately for the PCs considered here (Lewis et al., 1987). However, these authors suggested that the cooperativity units sizes for these phospholipids were roughly equivalent. Longer acyl chains gave smaller cooperativity unit sizes due to the increased chain lengths slowing the kinetics of the transition (Lewis et al., 1987). In the supported systems examined here the opposite behavior is observed with larger domains formed by longer chain length lipids. This difference may be relatable to the interaction between the lower leaflet and the water structure above the support. The longer chain lengths are expected to exhibit a stronger hydrophobic interaction relative to shorter chain lengths, which may stabilize domains in the lower leaflet and lead to larger domains during phase transition.
Highly defected bilayer
The protrusion behavior observed was not detected in areas which were highly defected in the gel phase. Images (Fig. 6) show that the bilayer retains the memory of the defect, even above the gel-fluid transition temperature. As the gel phase melts, we showed previously, defects start to fill with disordered lipid material (Xie et al., 2002b). The unorganized material is not yet two distinct bilayer leaflets and the asymmetry between top and bottom is not operative, so the sequential phase transition resulting from leaflet decoupling cannot occur. However, areas outside of the defect still exhibit the protrusions because the asymmetry of the leaflets is present.
gA incorporation
Incorporation of gA supports the leaflet decoupling argument by causing the abolition of the crack lines at the lower temperature phase transition and the total elimination of the higher temperature structure. gA changes the morphology of the lipid bilayer through an interaction with both leaflets. Numerous measurements show that gA forms a transmembrane structure in the bilayer. gA in the bilayer causes hydrophobic matching, in which the protein causes the surrounding lipid bilayer to adjust its hydrocarbon thickness to match the length of the hydrophobic surface of the protein, leading to thinning of DMPC bilayers (Harroun et al., 1999). This phenomenon is observed in our AFM images in Fig. 7 a as the dark gray domains and was noted to change the phase transition behavior of DMPC.
Fig. 8 b shows schematics for gA influence on the phase transition behavior of DMPC bilayers, which is directly comparable to the model of pure DMPC bilayers melting in Fig. 8 a. The lipid molecules around gA molecules are disordered, appear thinner due to hydrophobic matching (depicted as gray color lipids), and cause the leaflets to be coupled to one another. Around Tm more lipid molecules become disordered, and transition to the fluid phase. Above Tm the entire bilayer becomes homogeneously fluid-like. Given the AFM results with and without gA during phase transition, we conjecture that the ordering effect of gA in the fluid phase is provided by means of coupling the top and bottom leaflets together. The lack of cracking or high temperature structure in AFM images of gA-DMPC systems (Fig. 7) supports the leaflet asymmetry model proposed in Fig. 8 a.
CONCLUSION
We showed that the gel-fluid phase transition in several supported lipid bilayers exhibits a higher-temperature protrusion phase. The origin of this higher-temperature phase is related to the asymmetry between the leaflets in the supported bilayer. Whereas the upper leaflet exhibits a phase transition at Tm, the lower leaflet is stabilized by ∼5°C due to the presence of an ordered water layer between the substrate and the PC. The protrusion phase is chain length-independent for the three PCs studied here. However, the transition to fully fluid phase did exhibit chain length differences, likely due to differences in the interaction between the PCs and the water layer above the substrate.
The phase transition at Tm proceeds via the formation of crack lines the origin of which reflects the overall lateral symmetry of PC packing in the bilayer.
Bilayers constructed with large gel phase defects do not exhibit the Tm + 5°C transition. This feature reflects the disorder of the lipid in the defect as Tm approaches, and points out the lack of organization of the bilayer in these areas, which must persist well into the fluid-phase temperature regime. The Tm + 5°C transition is also eliminated through incorporation of gA into the bilayer film, which possibly reflects the transmembrane stabilization due to hydrophobic matching of the protein and the bilayer. The transmembrane stabilization prevents the decoupling of the two leaflets observed without gA incorporation.
The results presented here can be utilized in other contexts to decide whether or not an added component interacts with one or both leaflets of the phospholipid bilayer.
Acknowledgments
This work was supported by the U.S. Department of Energy, Division of Materials Science, under Award No. DEFG02-91ER45439 through the Frederick Seitz Materials Research Laboratory at the University of Illinois at Urbana-Champaign. Z.V.F. acknowledges the Department of Chemistry at the University of Illinois at Urbana-Champaign for financial support in the form of a Lester E. and Kathleen A. Coleman Fellowship. T.A.S. acknowledges the Department of Chemistry at the University of Illinois at Urbana-Champaign for financial support in the form of a University Block Grant.
References
- Almeida, P. F. F., W. L. C. Vaz, and T. E. Thompson. 1992. Lateral diffusion and percolation in two-phase, two-component lipid bilayer. Topology of the solid-phase domains in-plane and acorss the lipid bilayer. Biochemistry. 31:7198–7210. [DOI] [PubMed] [Google Scholar]
- Brian, A. A., and H. M. McConnell. 1984. Allogeneic stimulation of cyto-toxic T-cells by supported planar membranes. Proc. Natl. Acad. Sci. USA. 81:6159–6163. [DOI] [PMC free article] [PubMed] [Google Scholar]
- Chapman, D., B. A. Cornell, A. W. Eliasz, and A. Perry. 1977. Interactions of helical polypeptide segments which span the hydrocarbon region of lipid bilayers. Studies of the gramicidin A lipid-water system. J. Mol. Biol. 113:517–538. [DOI] [PubMed] [Google Scholar]
- Cremer, P. S., and S. G. Boxer. 1999. Formation and spreading of lipid bilayers on planar glass supports. J. Phys. Chem. B. 103:2554–2559. [Google Scholar]
- Douliez, J.-P., A. Leonard, and E. J. Dufourc. 1996. Conformational order of DMPC sn-1 vs. sn-2 chains and membrane thickness: an approach to molecular protrusion by solid state 2H-NMR and Neutron Diffraction. J. Phys. Chem. 100:18450–18457. [Google Scholar]
- Fang, Y., and J. Yang. 1997. The growth of bilayer defects and the induction of interdigitated domains in the lipid-loss process of supported phospholipid bilayers. Biochim. Biophys. Acta. 1324:309–319. [DOI] [PubMed] [Google Scholar]
- Feng, Z. V., S. Granick, and A. A. Gewirth. 2004. Modification of supported lipid bilayer by polyelectrolyte adsorption. Langmuir. 20:8796–8804. [DOI] [PubMed] [Google Scholar]
- Giocondi, M.-C., L. Pacheco, P. E. Milhiet, and C. L. Grimellec. 2001. Temperature dependence of the topology of supported DMPC-DSPC bilayers. Ultramicroscopy. 86:151–157. [DOI] [PubMed] [Google Scholar]
- Graupe, M., T. Takenaga, T. Koini, R. J. Colorado, and T. R. Lee. 1999. Oriented surface dipoles strongly influence interfacial wettabilities. J. Am. Chem. Soc. 121:3222–3223. [Google Scholar]
- Harroun, T. A., W. T. Heller, T. M. Weiss, L. Yang, and H. W. Huang. 1999. Experimental evidence for hydrophobic matching and membrane-mediated interactions in lipid bilayers containing gramicidin. Biophys. J. 76:937–945. [DOI] [PMC free article] [PubMed] [Google Scholar]
- Hetzer, M., S. Heinz, S. Grage, and T. M. Bayerl. 1998. Asymmetric molecular friction in supported phospholipid bilayers revealed by NMR measurements of lipid diffusion. Langmuir. 14:982–984. [Google Scholar]
- Hughes, A. V., S. J. Roser, M. Gerstenberg, A. Goldar, B. Stidder, R. Feidenhans'l, and J. Bradshaw. 2002. Phase behavior of DMPC free supported bilayers studied by neutron reflectivity. Langmuir. 18:8161–8171. [Google Scholar]
- Ivanova, V. P., I. M. Makarov, T. E. Schaffer, and T. Heimburg. 2003. Analyzing heat capacity profiles of peptide-containing membranes: cluster formation of gramicidin A. Biophys. J. 84:2427–2439. [DOI] [PMC free article] [PubMed] [Google Scholar]
- Janiak, M. J., D. M. Small, and G. G. Shipley. 1976. Nature of the thermal pretransition of synthetic phospholipids: dimyristolyl- and dipalmitoyllecithin. Biochemistry. 15:4575–4580. [DOI] [PubMed] [Google Scholar]
- Janiak, M. J., D. M. Small, and G. G. Shipley. 1979. Temperature and compositional dependence of the structure of hydrated DML. J. Biol. Chem. 254:6068–6078. [PubMed] [Google Scholar]
- Johnson, S. J., T. M. Bayerl, D. C. McDermott, G. W. Adam, A. R. Rennie, R. K. Thomas, and E. Sackmann. 1991. Structure of an adsorbed DMPC bilayer measured with specular reflection of neutrons. Biophys. J. 59:289–294. [DOI] [PMC free article] [PubMed] [Google Scholar]
- Kaasgaard, T., C. Leidy, J. H. Crowe, O. G. Mouritsen, and K. Jorgensen. 2003. Temperature-controlled structure and kinetics of ripple phases in one- and two-component supported lipid bilayers. Biophys. J. 85:350–360. [DOI] [PMC free article] [PubMed] [Google Scholar]
- Kim, J., G. Kim, and P. S. Cremer. 2001. Investigations of water structure at the solid/liquid interface in the presence of supported lipid bilayers by vibrational sum frequency spectroscopy. Langmuir. 17:7255–7260. [Google Scholar]
- Korrenman, S. S., and D. Posselt. 2000. Chain length dependence of anomalous swelling in multilamellar lipid vesicles. Eur. Phys. J. E. 1:87–91. [Google Scholar]
- Lee, D. C., A. A. Durranni, and D. Chapman. 1984. A difference infrared spectroscopic study of gramicidin A, alamethicin and bacteriorhodopsin in perdeuterated dimyristoylphosphatidylcholine. Biochim. Biophys. Acta. 769:49–56. [DOI] [PubMed] [Google Scholar]
- Leonenko, Z. V., A. Carnini, and D. T. Cramb. 2000. Supported planar bilayer formation by vesicle fusion: the interaction of phospholipid vesicles with surfaces and the effect of gramicidin on bilayer properties using AFM. Biochim. Biophys. Acta. 1509:131–147. [DOI] [PubMed] [Google Scholar]
- Leonenko, Z. V., E. Finot, H. Ma, T. E. S. Dahms, and D. T. Cramb. 2004. Investigation of temperature-induced phase transitions in DOPC and DPPC phospholipid bilayers using temperature-controlled SFM. Biophys. J. 86:3783–3793. [DOI] [PMC free article] [PubMed] [Google Scholar]
- Lewis, R. N. A. H., N. Mak, and R. N. McElhaney. 1987. A DSC study of the thermotropic phase behavior of model membranes composed of phosphatidylcholines containing linear saturated fatty acyl chains. Biochemistry. 26:6118–6126. [DOI] [PubMed] [Google Scholar]
- Lewis, R. N. A. H., and R. N. McElhaney. 1990. Subgel phases of n-saturated diacylphosphatidylcholines: a Fourier-transform infrared spectroscopic study. Biochemistry. 29:7946–7953. [DOI] [PubMed] [Google Scholar]
- Liu, J., and J. C. Conboy. 2004. Phase transition of a single lipid bilayer measured by sum-frequency vibrational spectroscopy. J. Am. Chem. Soc. 126:8894–8895. [DOI] [PubMed] [Google Scholar]
- Marsh, D. 1990. Handbook of Lipid Bilayers. CRC Press, Boca Raton, FL.
- Marsh, D., A. Watts, and P. F. Knowles. 1977. Cooperativity of the phase transition in single- and multibilayer lipid vesicles. Biochim. Biophys. Acta. 465:500–514. [DOI] [PubMed] [Google Scholar]
- Metso, A. J., A. Jutila, J.-P. Mattila, J. M. Holopainen, and P. K. J. Kinnunen. 2003. Nature of the main transition of DPPC bilayers inferred from fluorescence spectroscopy. J. Phys. Chem. B. 107:1251–1257. [Google Scholar]
- Morrow, M. R., and J. H. Davis. 1988. DSC and 2H NMR studies of the phase behavior of gramicidin-PC mixtures. Biochemistry. 27:2024–2032. [DOI] [PubMed] [Google Scholar]
- Mou, J., D. M. Crajkowsky, and Z. Shao. 1996. Gramicidin A aggregation in supported gel state PC bilayers. Biochemistry. 35:3222–3226. [DOI] [PubMed] [Google Scholar]
- Muresan, A. S., and K. Y. C. Lee. 2001. Shape evalution of lipid bilayer patches adsorbed on mica: an AFM study. J. Phys. Chem. B. 105:852–855. [Google Scholar]
- Naumann, C. A., T. Burmm, and T. M. Mayerl. 1992. Phase transition behavior of single PC bilayers on a solid spherical support studied by DSC, NMR and FT-IR. Biophys. J. 63:1314–1319. [DOI] [PMC free article] [PubMed] [Google Scholar]
- Naumann, C. A., O. Prucker, T. Lehmann, J. Ruhe, W. Knoll, and C. W. Frank. 2002. The polymer-supported phospholipid bilayer: tethering as a new approach to substrate-membrane stabilization. Biomacromolecules. 3:27–35. [DOI] [PubMed] [Google Scholar]
- Prenner, E. J., R. N. A. H. Lewis, L. H. Kondejewski, R. S. Hodges, and R. N. McElhaney. 1999. DSC study of the effect of the antimicrobial peptide gramicidin S on the thermotropic phase behavior of PC, PE and PG lipid bilayer membranes. Biochim. Biophys. Acta. 1417:211–223. [DOI] [PubMed] [Google Scholar]
- Radler, J., H. Strey, and E. Sackmann. 1995. Phenomenology and kinetics of lipid bilayer spreading on hydrophilic surfaces. Langmuir. 11:4539–4548. [Google Scholar]
- Sackmann, E. 1996. Supported membranes: scientific and practical applications. Science. 271:43–48. [DOI] [PubMed] [Google Scholar]
- Schneider, J., Y. F. Dufrene, W. R. Barger, and G. U. Lee. 2000. Atomic force microscope image contrast mechanisms on supported lipid bilayers. Biophys. J. 79:1107–1118. [DOI] [PMC free article] [PubMed] [Google Scholar]
- Silvius, J. R., B. D. Read, and R. N. McElhaney. 1979. Thermotropic phase transitions of phosphatidylcholines with odd-numbered n-acyl chains. Biochim. Biophys. Acta. 555:175–178. [DOI] [PubMed] [Google Scholar]
- Stephens, S. M., and R. A. Dluhy. 1996. In situ and ex situ structural analysis of phosopholipid-SPB using IR spectroscopy and AFM. Thin Solid Films. 284–285:381–386. [Google Scholar]
- Tokumasu, F., A. J. Jin, and J. A. Dvorak. 2002. Lipid membrane phase behaviour elucidated in real time by controlled environment AFM. J. Electron Microsc. 51:1–9. [DOI] [PubMed] [Google Scholar]
- Tokumasu, F., A. J. Jin, G. W. Feigenson, and J. A. Dvorak. 2003a. AFM of nanometric liposome adsorption and nanoscopic membrane domain formation. Ultramicroscopy. 97:217–227. [DOI] [PubMed] [Google Scholar]
- Tokumasu, F., A. J. Jin, G. W. Feigenson, and J. A. Dvorak. 2003b. Nanoscopic lipid domain dynamics revealed by AFM. Biophys. J. 84:2609–2618. [DOI] [PMC free article] [PubMed] [Google Scholar]
- Tristram-Nagle, S., Y. Liu, J. Legleiter, and J. F. Nagle. 2002. Structure of gel phase DMPC determined by x-ray diffraction. Biophys. J. 83:3324–3335. [DOI] [PMC free article] [PubMed] [Google Scholar]
- Xie, A. F., and S. Granick. 2002a. Phospholipid membranes as substrates for polymer adsorption. Nat. Mater. 1:129–133. [DOI] [PubMed] [Google Scholar]
- Xie, A. F., R. Yamada, A. A. Gewirth, and S. Granick. 2002b. Materials science of a planar lipid bilayer at the gel to fluid phase transition. Phys. Rev. Lett. 89:246103. [DOI] [PubMed] [Google Scholar]
- Yang, J., and J. Appleyard. 2000. The main phase transition of mica-supported PC membranes. J. Phys. Chem. 104:8097–8100. [Google Scholar]
- Zein, M., and R. Winter. 2000. Effect of temperature, pressure and lipid acyl chain length on the structure and phase behavior of phopholipid-gramicidin bilayers. Phys. Chem. Chem. Phys. 2:4545–4551. [Google Scholar]
- Zhang, J., B. Jing, N. Tokutake, and S. L. Regen. 2004. Transbilayer complementarity of phospholipids. A look beyond the fluid mosaic model. J. Am. Chem. Soc. 126:10856–10857. [DOI] [PubMed] [Google Scholar]


