Abstract
We used a novel uniaxial stretching rheometer to measure the creep function J(t) of an isolated living cell. We show, for the first time at the scale of the whole cell, that J(t) behaves as a power-law J(t) = Atα. For N = 43 mice myoblasts (C2-7), we find α = 0.24 ± 0.01 and A = (2.4 ± 0.3) 10−3 Pa−1 s−α. Using Laplace Transforms, we compare A and α to the parameters G0 and β of the complex modulus G*(ω) = G0ωβ measured by other authors using magnetic twisting cytometry and atomic force microscopy. Excellent agreement between A and G0 on the one hand, and between α and β on the other hand, indicated that the power-law is an intrinsic feature of cell mechanics and not the signature of a particular technique. Moreover, the agreement between measurements at very different size scales, going from a few tens of nanometers to the scale of the whole cell, suggests that self-similarity could be a central feature of cell mechanical structure. Finally, we show that the power-law behavior could explain previous results first interpreted as instantaneous elasticity. Thus, we think that the living cell must definitely be thought of as a material with a large and continuous distribution of relaxation time constants which cannot be described by models with a finite number of springs and dash-pots.
INTRODUCTION
To perform their functions, living cells must adapt to external stresses and varying mechanical properties of their environment. Thus, rheological properties (i.e., stress-strain relationships) are key features of living cells. Actually, mechanics play a major role in many biological processes such as cell crawling, wound healing, protein regulation, and even apoptosis (Janmey, 1998). Conversely, several pathologies, like metastasis, asthma, or sickle cell anemia, involve alteration of the mechanical properties of a given cell type.
Since the end of the 1980s, a growing number of techniques have been used to characterize living-cell rheology (Zhu et al., 2000). The main techniques used to probe local mechanical properties are optical tweezers (Svoboda and Block, 1994; Sheetz, 1998), magnetic twisting cytometry (MTC) (Valberg, 1984; Wang et al., 1993), atomic force microscopy (AFM) (Hoh and Schoenenberger, 1994; Shroff et al., 1995), and particle tracking (Lau et al., 2003), whereas measurements at the scale of the whole cell are essentially represented by micropipette aspiration (Evans and Yeung, 1989; Tran-Son-Tay et al., 1991; Tsai et al., 1993), manipulation with microneedles (Albrecht-Buehler, 1987; Felder and Elson, 1990), and by optical stretcher (Guck et al., 2001). Until 2001, local measurements (Bausch et al., 1998) as well as experiments at the whole-cell scale (Thoumine and Ott, 1997; Beil et al., 2003) were essentially analyzed by means of simple mechanical models with a finite number of springs and dash-pots. Thus, the cell could be thought as a viscoelastic medium with a few characteristic relaxation time constants. Nevertheless, mechanical models were different from one study to another, and the viscoelastic parameters values were broadly distributed.
Recently, Fabry et al. (2001) and Alcaraz et al. (2003) performed local dynamical rheometry using MTC and AFM, respectively. The former measured the displacements of functionalized ferromagnetic beads (4.5 μm in diameter) when submitted to an oscillating magnetic field, whereas the latter determined the force-indentation relationship for an oscillating AFM tip (∼30-nm typical size). The authors reported the same behavior for the complex modulus G*(ω) which increases as a weak power-law of frequency, with an exponent ∼0.2. These are striking results with features never observed in previous studies. First, the two techniques lead to very close mechanical parameter values, even though probe sizes, geometries, and applied strain fields are different. Secondly, both the storage modulus G′(ω) and the loss modulus G″(ω) follow the same power-law (at least below 10 Hz), which means, in turn, that elasticity and dissipation originate from the same physical process. Finally, the power-law behavior implies a large and continuous distribution of relaxation time constants. All these features could be taken into account by a soft-glassy-material model (Bouchaud, 1992; Sollich et al., 1997), suggesting that cell mechanics may be dominated by structural disorder, metastability, and rearrangements. In addition, two-point passive microrheology (Lau et al., 2003) has revealed that the mean-squared displacement of endogenous tracers follows a power-law. It is noteworthy that active manipulations and passive methods lead to the same mechanical behavior.
Nevertheless, these findings lead to some important questions. Is the unified behavior observed by oscillatory experiments at the nano- and microscales conserved at the scale of the whole cell? How might one compare recent oscillatory experiments (Fabry et al., 2001; Alcaraz et al., 2003) to early creep ones (Bausch et al., 1998)? To answer these questions, we designed a novel single-cell uniaxial stretching rheometer allowing measurement of the deformation under constant stress (creep experiment) or the stress relaxation under constant strain (relaxation experiment) at the scale of an isolated living cell.
We report here the first determination of the creep function J(t) of a single living cell. J(t) behaved as a weak power-law in time, with an exponent value of 0.24 ± 0.01. These results are in very good agreement with recent MTC and AFM oscillating rheometry measurements, indicating that the living cell must be considered as a viscoelastic medium with a wide and continuous spectrum of relaxation time constants.
Finally, we show that the apparent contradiction between our results and earlier ones (i.e., power-law versus simple mechanical model behavior) vanishes when the detailed features of the experiments are taken into account. Indeed, a rigorous calculation of the stress-strain relationship assuming a power-law for J(t) can explain previous results obtained within the same uniaxial strain geometry, but which were interpreted then as instantaneous elasticity (Thoumine and Ott, 1997).
MATERIALS AND METHODS
The uniaxial stretching rheometer (USR)
The rheometer we have designed takes advantage of the simple uniaxial stretching geometry first described in Thoumine and Ott (1997). Basically, one living cell is stretched between two glass microplates, one rigid and the other flexible. The stiffness of the flexible plate is calibrated so one can deduce the force applied to the cell from its deflection.
We designed new composite microneedles, permitting: 1), avoidance of drift due to surface tension effects; 2), simultaneous cell adhesion on flexible and rigid microplates; and 3), easy optical detection of the flexible-plate deflection. All these advances allowed us to implement an efficient feedback loop, controlling the rigid (or the flexible) plate displacement, thus making our setup a true constant stress (respectively, strain) microrheometer.
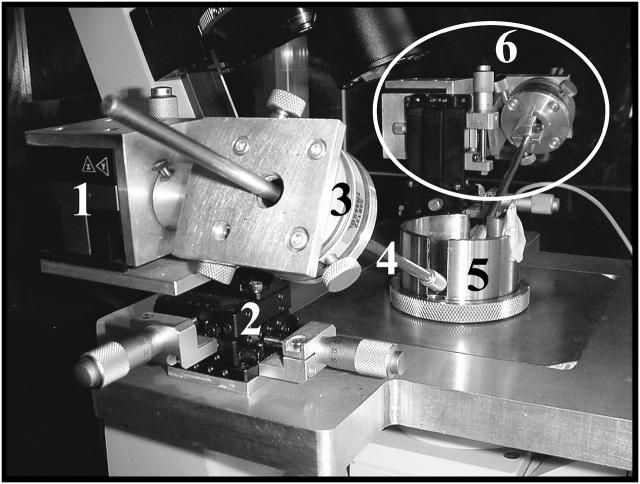
The setup was mounted on a Leica DMIRB inverted microscope (Leica Microsystems, Rueil-Malmaison, France). The uniaxial stretching rheometer (USR) was composed of two arms fixed symmetrically on each side of the optical axis of the microscope (Fig. 1). Each arm bore a stainless-steel microneedle holder mounted on a M-UTR46A precision manual rotation stage (Micro-Controle, Evry, France). The latter was fixed on a piezoelectric stage “100 × 100 × 100 μm travel NanoCube x,y,z” (Polytech-PI, Pantin, France), which was supported by an x,y,z 13-mm travel micrometer-driven steel stage (OptoSigma, Photonetics, Marly-le-Roi, France). Manual rotation and x,y,z stages ensured rough positioning of both rigid and flexible plates before beginning the experiments, whereas piezoelectric stages allowed fine computer-controlled displacements and cell stretching.
FIGURE 1.
The uniaxial stretching rheometer. The components of the left-hand arm are detailed in the foreground: (1) three-axis piezo stage; (2) three-axis manual stage; (3) manual rotation stage; (4) microneedle holder; and (5) manipulation chamber. The right-hand arm is circled in the background (6).
The setup, enclosed in a Plexiglas box, was maintained at 37 ± 0.2°C by an Air-Therm heater controller (World Precision Instruments, Stevenage, Hertsfordshire, UK). Vibration isolation was achieved by a TS-150 active antivibration table (HWL Scientific Instruments, Ammerbuch, Germany).
Cells stretched between the microplates were visualized under bright light illumination with a Plan Fluotar L 63×/0.70 objective and a Micromax digital charge-coupled device camera (Princeton Instruments, Roper Scientific, Evry, France). For flexible microplate deflection detection, a S3979 position-sensitive detector (Hamamatsu France, Massy, France) mounted on a M-MT-x,y,z translation stage (Micro-Controle) was fitted on the phototube of the microscope so that one could picture the flexible plate tip on the position-sensitive detector. Currents from the position-sensitive detector were processed by homemade electronics. The output signal, proportional to the flexible-plate deflection, was acquired by a PCI-6035E data acquisition board, processed by a PID program under Labview software and a correction command was sent to the piezoelectric stages via a PCI-6713 output board (software and boards from National Instruments, Le Blanc-Mesnil, France).
Microneedle design
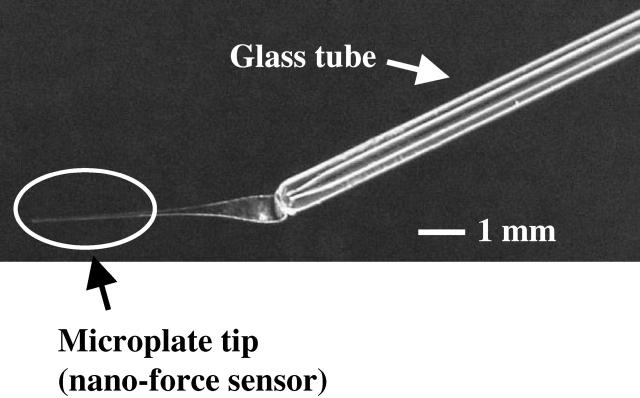
The glass needles used to stretch the cells were composed of two parts: a microplate-shaped tip and a 1-mm-diameter tube (Vitrex, Herlev, Denmark), which fitted the needle holder of the USR (Fig. 2). The tip microplates were pulled (PB-7 puller, Narishige, Tokyo, Japan) from D-263 borosilicate glass plates of 10-cm long × 1-mm large × 0.1–0.3-mm thick (Schott-Duran, Lecordier-Siverso, Saint-Léger-du-Bourg-Denis, France). After pulling, typical sizes were 30-μm large × 5-μm thick × 6-mm long for flexible microplates, and 60 μm × 30 μm × 1 mm for rigid microplates. Each microneedle was formed by heating and then fusing a shaped microplate and a tube. A tilt-angle of ∼15° between the two parts ensured that the tip (which is a nanoNewton force sensor in the case of the flexible plate) was completely immersed in the DMEM solution, thus avoiding perturbation of force measurements by surface-tension effects.
FIGURE 2.
A composite microneedle with a flexible shaped tip (the tube is 1-mm in diameter).
Calibration of the flexible microplate stiffness
The stiffness of the flexible microplates was measured by means of a standard microplate. The latter was calibrated using pieces of copper wire of 35 μm in diameter as reference masses. To do this, the standard microplate was held horizontally on the inverted microscope. After focusing on the tip of the microplate, a piece of copper wire (0.1–1-mm length) was suspended to the latter, causing plate deflection and defocusing. Then the plate deflection was given by the vertical displacement needed to refocus the tip. Using copper-wire pieces of different lengths (i.e., of different masses), one could plot the force applied to the microplate tip versus its deflection. Fitting the linear part of the curve, we got the slope and thus the standard microplate stiffness.
To calibrate a microplate used for the assays, we settled its tip against that of the standard plate. Then, we moved the latter (from 0 to 100 μm) by steps of 10 μm and we measured the deflection of each plate for every step. The deflection of one plate varied linearly with the deflection of the other, and the slope gave the ratio of the unknown stiffness over that of the standard plate. We used plates with typical stiffness values of 2 nN/μm and a linear deflection range of 100 μm.
Microneedle preparation
Glass microplates were cleaned for 10 min in a Piranha-mixture of 67% sulfuric acid + 33% hydrogen peroxide, rinsed in water, dipped in a bath of 90% ethanol + 8% water + 2% 3-aminopropyltriethoxysilane for 2 h, then rinsed in ethanol, and finally incubated in 98% water + 2% glutaraldehyde 1 h before the experiment.
Cell culture and preparation
The C2-7 myogenic cell line is a subclone of the C2 line derived from the skeletal muscle of adult CH3 mice (Changeux et al., 1986). C2-7 cells used in this study were generously provided by Denise Paulin (Biologie Moléculaire de la Différentiation EA 300, Université Paris VII). They were grown in 25 cm2 culture flasks using DMEM medium supplemented with 10% heat-inactivated fetal calf serum, 2 mM glutamin, 50 units/mL penicillin, and 50 μg/mL streptomycin, until confluence reached 50%. All cultures were maintained at 37°C under a humidified 5% CO2 atmosphere.
For creep experiments, cells at 50% confluence were trypsinated, centrifugated at 900 rpm for 3 min, diluted in DMEM supplemented with 15 mM HEPES, and maintained under smooth agitation for 2 h at 37°C. If used immediately after trypsination, cells showed weak adhesion on the microplates (∼1 cell over 10 trials). The delay of 2 h was probably necessary for the trypsinated cells to regenerate adhesion proteins expressed at the cell surface.
Preparation of the creep experiments
Cell capture
First, the rigid and flexible microplates were settled in front of one another near the manipulation chamber's bottom. Then, the chamber was filled with cells suspended in 10 ml of DMEM buffered with 15 mM HEPES and we waited until cell deposition on the chamber's bottom. During cell sedimentation, we added 10 ml of liquid GPR paraffin (BDH Laboratory Supplies, Pool, UK) at the DMEM surface to avoid O2 exchange between medium and air (thus ensuring long-time pH stability). All manual micrometers were then mechanically locked to avoid any drift during the experiment. Finally, using the piezoelectric stages, the microplates were lowered toward the chamber's bottom and placed in contact with the cell surface. After 5 min of incubation, the two microplates were simultaneously and smoothly lifted to 60 μm from the chamber's bottom to get the desired configuration of one cell adherent between two parallel plates. It is noteworthy that, as cells were placed in contact with the two plates simultaneously, the adherence conditions were similar at both the rigid and flexible plate surfaces.
In situ calibration of the deflection detection
The plates, with the adherent cell in between, were simultaneously displaced horizontally and the detector signal was recorded. Hence, we could determine the multiplying factor between flexible-plate deflection and detector response. The detection sensitivity ranged from 1 to 4 mV for 100 nm, leading to a typical error of 200 nm on the flexible plate tip position. Thus, for a characteristic plate deflection of 10 μm, the relative error on the constant applied force was ∼2%.
RESULTS AND DISCUSSION
Experimental parameter definitions
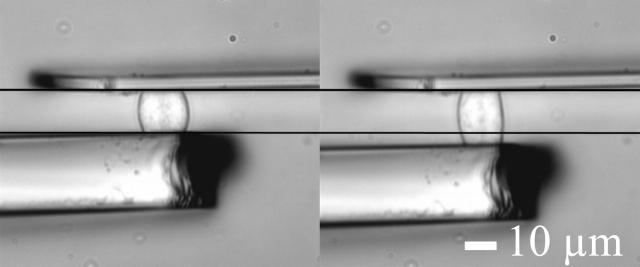
A C2-7 cell stretched under constant force is visualized on Fig. 3. The position of the flexible (thin) plate tip was held constant to ensure fixed plate deflection, and thus constant applied force. To do this, a controller shifted the rigid (thick) plate leading to increasing cell stretching. The strain ɛ(t) was defined as (L(t)−L0)/L0, where L0 and L(t) were respectively the cell length perpendicular to the microplates (i.e., the distance between the plates) just before the experiment began, and after t seconds (Fig. 4).
FIGURE 3.
A C2-7 cell stretched under constant force. The servo controller gradually shifts the rigid (thick) microplate to compensate for cell deformation, and thus maintains a fixed deflection of the flexible (thin) plate tip. Pictures correspond to t = 0 s and t = 30 s.
FIGURE 4.
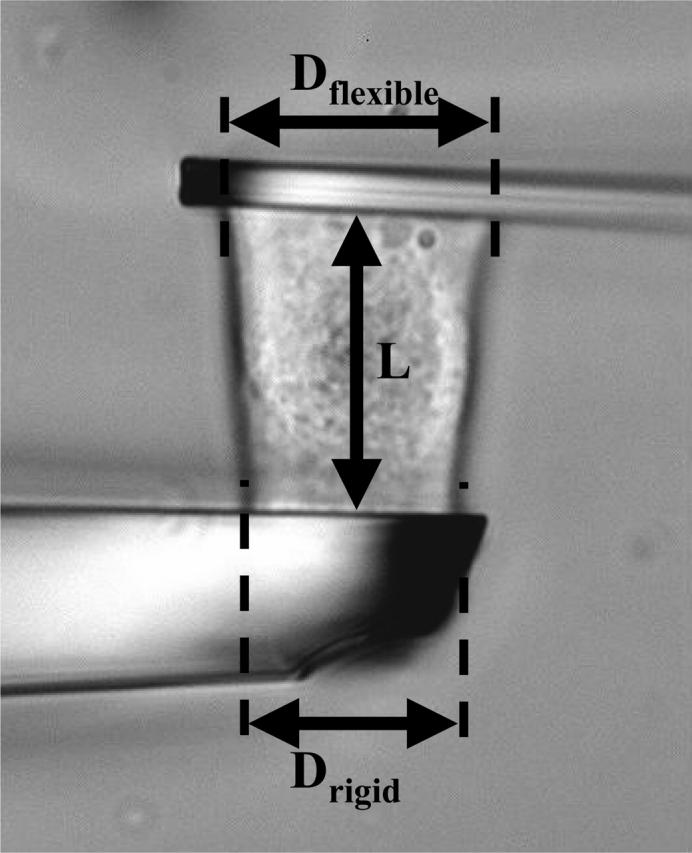
Apparent contact diameters (Dflexible, Drigid) and cell-length L perpendicular to the microplates.
The applied stress σ0 was given by the constant applied force F0 divided by the contact area A0 between the cell and each microplate. As we could not directly measure this area, we supposed it to be a disk of diameter D, where D was the apparent contact line between the cell and each of the glass plates on video-microscopy pictures (Fig. 4). Thus A0 was simply given by πD2/4. However, D was usually not exactly the same for the flexible (D = Dflexible) and the rigid (D = Drigid) plate, leading to two stress values σflexible = 4F0/π(Dflexible)2 and σrigid = 4F0/π(Drigid)2. In the data analysis below, we have reported the average value of the applied stress σ0 = (σflexible+σrigid)/2.
Finally, variations of Dflexible and/or Drigid would have indicated varying contact areas and thus varying stress σ, even if the applied force was kept constant. Thus, for all results presented below, we carefully verified that Dflexible and Drigid remained constant.
Strain function behavior
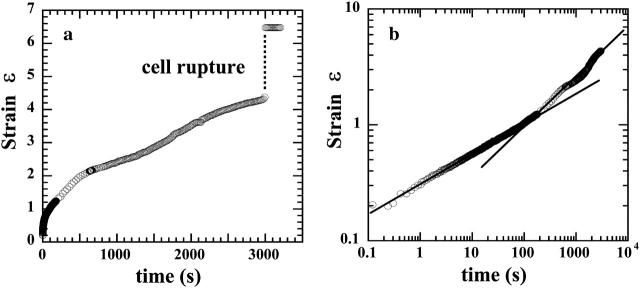
The experimental strain function shown on Fig. 5 a illustrates the typical mechanical behavior we observed for living cells submitted to a constant force. After continuous stretching, cells ruptured at high strain.
FIGURE 5.
Strain data illustrating the typical behavior of a living cell submitted to a constant force. (a) The lin-lin plot showing the cell rupture at ∼50 min. (b) The Ln-Ln plot emphasizing the existence of two different regimes.
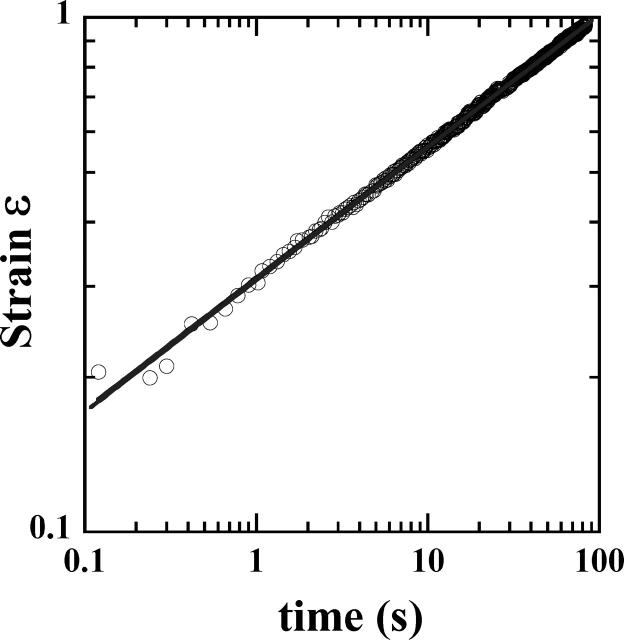
Representing Ln[ɛ(t)] versus Ln(t) (Fig. 5 b), it appeared that the strain ɛ(t) followed two different regimes before the cell's rupture. From the beginning of the creep experiment until time reached values between 10 and 100 s (corresponding to ɛ-values between 0.3 and 0.9), ɛ(t) behaved as a weak power-law of time. The strain data were indeed very well fitted by a simple two-parameter function ɛ(t) = ctα (Fig. 6), with α-values ∼0.24. For longer timescales, ɛ(t) was roughly a power-law with noticeable fluctuations and higher exponent α′ ≈ 0.5.
FIGURE 6.
In the short time regime, strain data are well fitted by a power-law ɛ(t) = ktα over three time-decades (r2 = 0.9997). The first measured strain values ranged from <1% to ∼30%, with one-third of these values <7%. Remarkably, power-law behavior was thus observed over a strain range going from <1% to values as high as 100%.
It is noteworthy that the cell's mean section decreased as the cell length L(t) increased. As a consequence, although the externally applied stress σ0 was kept constant, the mean stress σi experienced through the cell increased. For low strains, one can neglect stress variation and consider σi ≈ σ0. This approximation is no longer valid when ɛ exceeds unity (Fig. 7). Thus, the short time (low-strain) regime was the only one corresponding to creep conditions. In the following, we will focus our attention on the features of the creep regime, leaving the long time regime for a further analysis.
FIGURE 7.
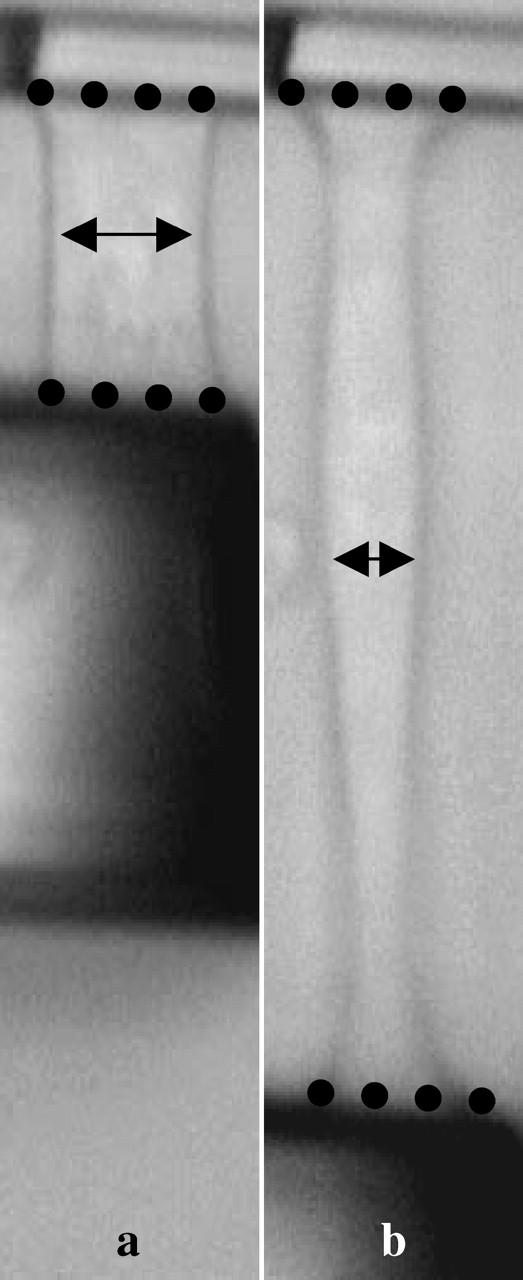
Shapes of a stretched cell at ɛ ∼ 1 and ɛ ∼ 6. Whereas apparent contact diameters (dots) decrease slightly at high strains, the mean cell diameter parallel to the microplates (arrows) is nearly divided by a factor of 2.
Finally, we did not observe cell contraction as reported in Thoumine and Ott (1997). This may be due to substantial differences between experimental protocols. In our creep experiments (i.e., under constant applied force), cells were submitted to rapidly and continuously increasing strains. In Thoumine and Ott (1997), force relaxation led to limited strains and cell contraction was achieved after >30 min. One can conclude that the mechanisms responsible for cell contraction are characterized by slow rates and probably only efficient for low elongations. Thus, even though neither force nor strain was kept constant, the experimental conditions reported in Thoumine and Ott (1997) were closer to those of a relaxation experiment where the strain is settled to a constant (low) value.
Analysis of the creep regime
As usual in rheometry, we will focus our attention on the creep function J(t), defined as the strain ɛ(t) divided by the stress σ0, instead of ɛ(t) itself. Thus, the experimental results were fitted by the function J(t) = ɛ(t)/σ0 = Atα, where A = c/σ0.
The exponent α
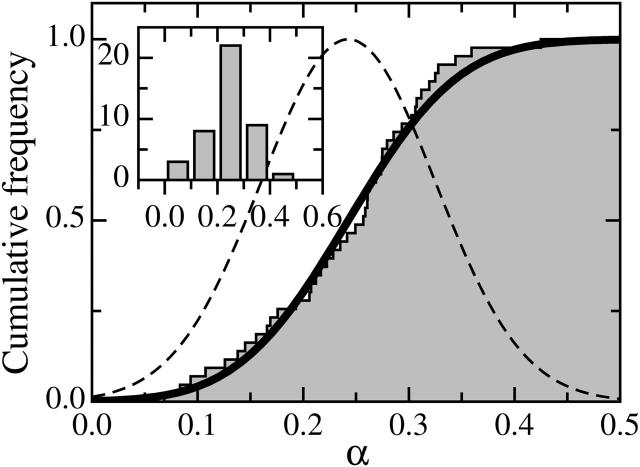
The distribution of α-values for N = 43 C2-7 cells (Fig. 8, inset) was characterized by a mean value 〈α〉 = 0.24, a standard deviation S = 0.08, and a standard error Δα = 0.01. This distribution could be well approximated by a Gaussian law as shown on Fig. 8. Indeed, the cumulative distribution function (CDF) of the experimental data was very close to that of a Gaussian probability density (error function), with a mean value 〈αG〉 = 〈α〉 and a standard deviation SG = S.
FIGURE 8.
CDF of the exponent α. For a given value α0, the CDF gives the percentage of α-values <α0. Measured data (solid steps) are well described by an error function (solid line), CDF of a Gaussian density of probability (dashed bell-curve). Classical histogram representation of the data (inset) leads to the same conclusion, but with an unavoidable arbitrariness in data binning.
The prefactor A
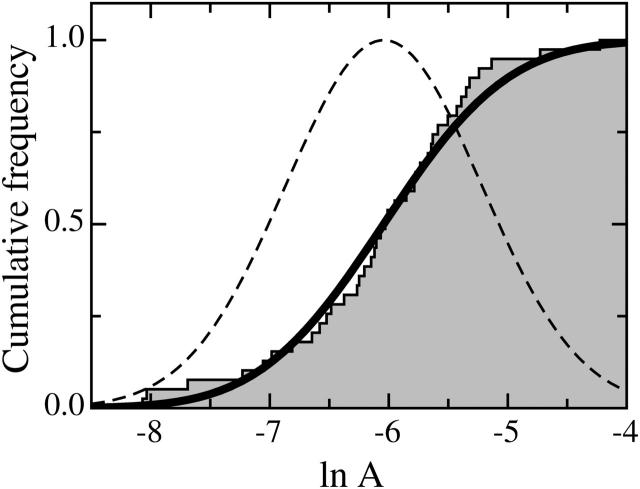
The A-values were more dispersed than those of α. It appeared that the distribution of A could be well described by a log-normal law. Actually, the CDF of Ln(A) was very close to that of a Gaussian probability density with characteristic parameters 〈Ln(A)G〉 = 〈Ln(A)〉 = −6.04 and SG = S = 0.82 (Fig. 9). The standard error ΔLn(A) settled to 0.13 and the most probable value of A was (2.4 ± 0.3) 10−3 Pa−1 s−α.
FIGURE 9.
CDF of the prefactor A. Measured data (solid steps) are well described by the CDF (solid line) of a Gaussian density of probability (dashed bell-curve).
It is noteworthy that the log-normal distribution observed for A has already been reported for the magnetic bead displacement amplitude measured in MTC experiments (Fabry et al., 2001). The authors speculated that this might be due to variability of geometrical factors (mainly, that of the bead-cell contact area). In principle, this argument cannot be retained for our experiments where geometrical variability is mostly absent.
However, having a well-defined cell-microplate contact area gives no indication about the number of adhesion proteins or stress fibers over which force is applied. Thus, two cells with different densities of adhesion proteins or stress fibers would show different stiffness even though they were apparently submitted to the same stress σ0 = F0/S0, where F0 is the applied constant force and S0 the apparent cell-microplate contact area. Indeed, the effective section of the cellular material supporting the applied force is only a fraction f < 1 of the measured apparent contact area.
Furthermore, when fitting data samples with a power-law function J(t) = Atα, one can show that variability of the data leads to similar distributions for the estimated α and Ln(A) (K. Sekimoto, private communication). Thus, even if one could know the effective contact area for each tested cell, we would still expect a log-normal distribution for A.
Linearity
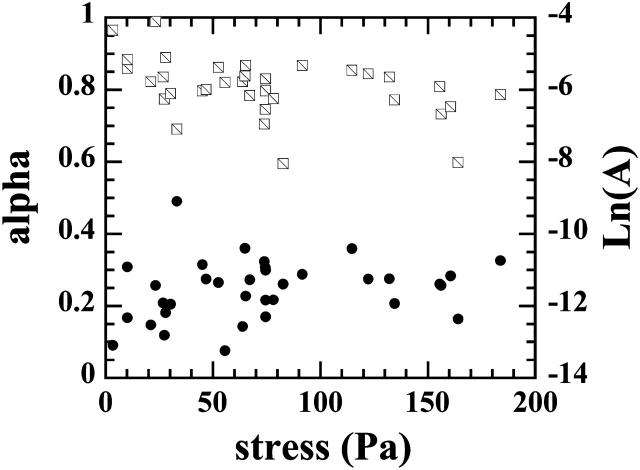
The α- and Ln(A) values presented above were obtained for applied stresses ranging from 3 to 180 Pa. Within this range, α and Ln(A) appeared to be independent of the applied load magnitude (Fig. 10). Therefore, we assumed that our experiments were carried out in the linear regime.
FIGURE 10.
The values α (solid circles) and Ln(A) (squares) are independent of the applied stress magnitude σ0.
A general behavior
We are currently processing creep experiments on other cell types (human alveolar epithelial A549, HeLa, dog kidney MDCK, L929 fibroblasts, and mice primary fibroblasts and leucocytes), using different adhesion molecules (fibronectin and cadherin). First results (data not shown) exhibited the same behavior with slight variations in A- and α-values, indicating that the weak power-law is a general characteristic of eukaryotic cells creep function and not limited to C2-7 myoblasts.
Moreover, assuming that our measurements were carried out in the linear regime, it was possible to compare the features of the creep function J(t) = Atα to those of the complex modulus G*(ω) awaited in oscillatory experiments (see Appendix 1). One found  with Γ(…) as the gamma function. Thus, if the creep function is a weak power-law of the time, the complex modulus is a weak power-law of the frequency with the same exponent α. This was well verified experimentally, as our exponent value of 0.24 for C2-7 cells was comparable to those found in oscillating AFM (∼0.2 for A549 and BEAS-2B cells, Alcaraz et al., 2003) and MTC (0.16–0.33 for different cell types and biochemical treatments, Fabry et al., 2003). However, the agreement between our single cell creep experiment and oscillating AFM and MTC was not limited to the exponent value. Actually, the storage modulus was given by
  and the prefactor G0 could easily be calculated from the parameters A and α of our measured creep function. At a frequency f = 1 Hz, we found G′(1 Hz) ≈ 660 Pa. This value is very close to the ∼710 Pa measured by AFM (Alcaraz et al., 2003) and within the range 300–3000 Pa obtained by MTC for all tested samples (Fabry et al., 2003).
This quantitative agreement between three different techniques (actually, oscillating optical tweezers measurements—Balland et al., 2005, and local MTC creep ones, by Lenormand et al., 2004—have just been reported; thus, we should have actually said “five different experiments”) strongly suggests that the observed power-law behavior is an intrinsic feature of cell mechanics, and not an artifact due to a particular probe geometry or data analysis protocol. More fundamentally, identical behavior at very different spatial scales, going from a few tens of nanometers to the scale of the whole cell, suggests that self-similarity could be a central feature of cell mechanical structure (in fact, power-law behavior is even observed at the scale of the tissue; see Suki et al., 1994). Actually, one can imagine two origins for the power-law. The first one could be structural, such as for fractal gels, as in Ponton et al. (2002), where a characteristic mechanical pattern is reproduced at different spatial scales. The second origin could be of dynamical nature, as suggested in Fabry et al. (2001) and Alcaraz et al. (2003). In this latter case, the cell is thought of as a soft glassy material (Bouchaud, 1992; Sollich et al., 1997), the mechanics of which are controlled by disorder, metastability, and rearrangements.
The dynamical scenario seems very appropriate as the cell is essentially a system out of equilibrium with many processes, like actin network remodeling (Kruse et al., 2004) or cytoskeleton contraction by molecular motors (Le Goff et al., 2002; Balland et al., 2005), which could explain cell rheology. The mechanical measurements presented here are not sufficient to define whether the origin of the power-law is structural or dynamical (or both). Answering this question implies performing creep experiments with simultaneous visualization of the cytoskeleton, and studying, via α- and A-values, the effect of biochemical perturbations either on the cytoskeletal filaments or on their interactions with molecular motors.
Comparison with earlier studies
Let us now discuss the apparent difference between our results and earlier measurements interpreted with simple mechanical models involving a finite number of springs and dash-pots.
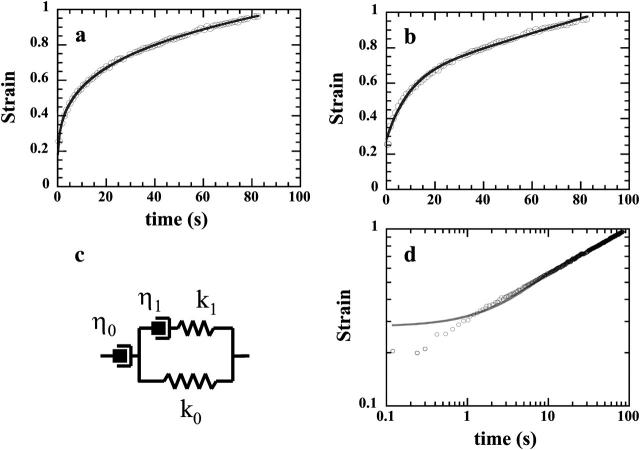
We first compared our results to the work reported in Bausch et al. (1998), since it involved creep measurements and one of the most commonly used four-elements' mechanical models (Fig. 11 c). To do this, we fitted our data with this particular model. In a lin-lin plot (Fig. 11 b), the fit seemed pretty good, even though slightly worse than the power-law (Fig. 11 a), and implying two more adjustable parameters. Using Ln-Ln representation, it clearly appeared that the four-elements' mechanical model could not fit >1.5 time-decade. Actually, creep data reported by Bausch et al. (1998) were recorded every ∼0.1 s during 2.5 s, corresponding to a little bit more than one time-decade.
FIGURE 11.
Strain data of Fig. 6 are here fitted by: a power-law in a lin-lin plot (a), the creep function  of the four-elements' model (c), in a lin-lin plot (b) and in a Ln-Ln plot (d).
Furthermore, there is a fundamental difference between the power-law behavior and that of the mechanical model represented on Fig. 11 c: the existence of instantaneous elasticity or not. In the case of the power-law, there is no strain step at the beginning of the experiment, i.e., ɛ(t = 0+) = 0. In contrast, the mechanical model, with two parallel springs of elastic constants k0 and k1, leads to an instantaneous step  Bausch et al. (1998) interpreted their first measured value of ɛ(t) as the instantaneous strain ɛ0. This is, of course, insufficient to prove the existence of instantaneous elasticity. To do so, one must get spatial and temporal resolutions high enough to follow the movement of the probe during the settling of the applied stress.
In some sense, that is what has been done in Thoumine and Ott (1997) at the scale of the whole cell, in the same uniaxial strain geometry as in the present work. In their experimental protocol, the rigid plate was moved through 12 μm in 10 s, leading to simultaneous evolution of the stress σ and the strain ɛ. They showed that data reported in a stress-strain plot could be fitted by a linear relationship, at least for the first 8 s of their experiments. Thus, they analyzed this short time regime as an elastic one.
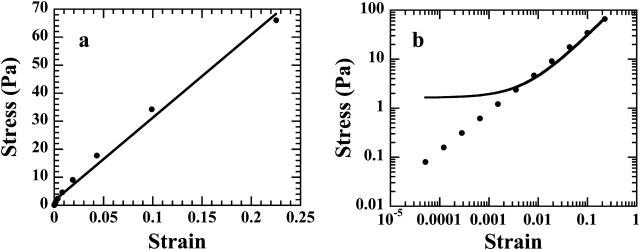
Nevertheless, stress and strain were geometrically related in the experimental setup of Thoumine and Ott (Eq. A9, below) and this must be taken into account when analyzing the results. In Appendix 2, we present a detailed mathematical description of the first regime reported in Thoumine and Ott (1997), which allowed us to show that the apparent linear relationship they observed was compatible with power-law behavior. Indeed, using our measured creep function J(t) = Atα to calculate the expressions of σ(t) and ɛ(t), we generated data values that seemed to be well fitted by a linear relationship in a lin-lin stress-strain plot (Fig. 13 a). Disagreement between the data and the linear fit became apparent only when data were represented in a Ln-Ln plot, over more than one decade of strain values (Fig. 13 b).
SUMMARY AND PERSPECTIVES
Using a novel homemade microrheometer, we measured the creep function J(t) of an isolated living cell. We showed, for the first time at the scale of the whole cell, that J(t) is a weak power-law of the time, i.e., J(t) = Atα. The parameters A and α were well defined and in excellent agreement with those of the complex modulus  measured in recent oscillatory MTC and AFM experiments. Thus, power-law mechanical behavior appears to be a feature of eukaryotic cells over many different size scales, and not due to particular probe size or strain geometry. Conversely, disagreement with earlier results, interpreted by simple equivalent mechanical models, could only be apparent ones. Actually, detailing experimental conditions and data analysis, we demonstrated that our power-law creep function can account for the mechanical behavior observed in previous experiments, and interpreted as instantaneous elasticity. All these facts taken together led us to think that the mechanical structure of eukaryotic cells is characterized by a continuous distribution of relaxation time constants that cannot be taken into account by mechanical models with a finite number of springs and dash-pots.
Additionally, agreement between measurements at different size scales suggests that self-similarity could be a central feature of cell mechanical structure. In fact, the challenge is now to understand the microscopic origin of the power-law. To settle whether the origin of the power-law is structural or dynamical (or both), we are currently defining experimental protocols where cells: 1), have a frozen actin network; 2), are missing one of the cytoskeleton components; or 3), have inactivated molecular motors. These experiments should indicate the role of a particular cell component or process in the observed power-law mechanical behavior.
In other respects, we are trying to take into account stress evolution and nonlinearity effects at high strains to be able to analyze and take advantage of the data measured in the long time regime (roughly from a few minutes to one hour) where creep conditions are no longer satisfied.
Acknowledgments
We thank Julien Browaeys and Paolo Galatola for their help with the mathematical analysis. We acknowledge Martial Balland, Nicolas Biais, Olivier Cardoso, Patrice Flaud, François Gallet, and Sylvie Hénon for many helpful discussions.
This work was partly supported by grants from the Ministère de la Recherche (Action Concertée Incitative Jeune Chercheur), from the Centre National de la Recherche Scientifique (Physique et Chimie du Vivant), and from the Denis Diderot (Paris 7) University (Bonus Qualité Recherche).
APPENDIX 1: RELATION BETWEEN THE CREEP FUNCTION J(t) AND THE COMPLEX MODULUS G*(ω)
In the linear regime, the strain ɛ(t) of a given material is related to the applied varying stress σ(t) by
 |
(A1) |
where J(t) is the creep function (i.e., the strain observed for a step stress normalized by the constant stress value). Defining the Laplace Transform by  Eq. A2 leads to
 |
(A2) |
where  is the compliance. To relate the viscoelastic modulus G* to the compliance J*, one has to express the stress σ(t) as a function of the varying strain ɛ(t),
 |
(A3) |
where G(t) is the relaxation function (i.e., the stress observed for a step strain normalized by the constant strain value). Laplace Transform then yields
 |
(A4) |
where  is the viscoelastic modulus. Equations A3 and A5 involve that
 |
(A5) |
Then, knowing the expression of the creep function J(t) of a given material, one can calculate by a simple Laplace Transform the compliance J*(s) and, replacing s by iω in Eq. A5, determine the expression of the complex modulus G*(ω) awaited in dynamical (oscillatory) experiments.
In the case of the creep experiments on eukaryotic cells reported above, we find J(t) = Atα. Laplace Transform then gives  where
where  The corresponding complex modulus expresses as
 |
(A6) |
APPENDIX 2: STRESS-STRAIN RELATIONSHIP IN A CONSTANT-RATE-OF-CHARGE EXPERIMENT
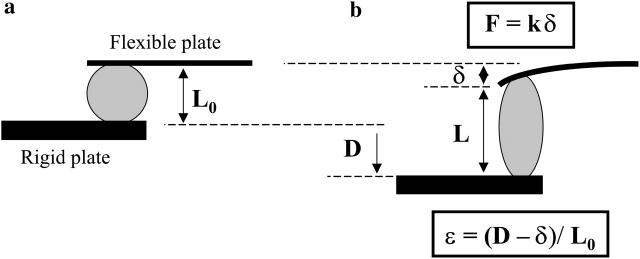
We discuss here a uniaxial stretching experiment where the rigid microplate is moved away from the flexible one at constant rate v0 = D0/τ0, with D0 the overall displacement reached in τ0 seconds (Fig. 12). This corresponds, in fact, to the first regime described in Thoumine and Ott (1997), and interpreted then as an elastic one (i.e., showing a linear stress-strain relationship). To predict the behavior of both unknown strain ɛ(t) and stress σ(t), one needs two independent relations involving them. The first one is given by the general equation, Eq. A1, expressed above. The second relation can be obtained taking advantage of the specific geometry of the experiment. One can write
 |
(A7) |
where L(t), D(t), and δ(t) are, respectively, the cell length, the rigid plate displacement, and the flexible-plate deflection at time t. The value L0 represents the initial value of L, i.e., L0 = L(0). The strain is then given by
 |
(A8) |
FIGURE 12.
Schematic representation of a constant-rate-of-charge experiment. (a) Initial state with a cell of length L0. (b) The rigid plate is moved at a constant rate (the displacement D is proportional to the time t); both the cell length L(t) and the flexible plate deflection δ(t) are continuously varying and their values are geometrically related.
Noting that D(t) = v0t and δ(t) = S0σ(t)/k, where S0 is the contact area between the cell and the microplates, k the stiffness of the flexible microplate, and σ(t) the stress, Eq. A8 becomes
 |
(A9) |
where
 |
(A10) |
and
 |
(A11) |
Equaling the two expressions of ɛ(t) in Eqs. A1 and A9, one gets
 |
(A12) |
where we have taken into account the fact that σ(0) = 0. The right part of Eq. A12 is a convolution integral, so Laplace Transform leads to
 |
(A13) |
or
 |
(A14) |
However, as J(t) = Atα,
 |
Applying TL−1 to Eq. A14 gives
 |
(A15) |
As  one finally obtains
 |
(A16) |
and, from Eq. A9,
 |
(A17) |
Taking v0 = D0/τ0 = 12 μm/10 s as indicated in Thoumine and Ott (1997), and mean values from our data for A, α, L0, and k, we get σ* ≈ 90 Pa and τ* ≈ 11 s, and the first four terms (n ≤ 3) of Eqs. A16 and A17 are sufficient to get ɛ(tmax = 10 s) and σ(tmax = 10 s) with an error <1% compared to their asymptotic values. Representing σ(t) as a function of ɛ(t) using data generated from Eqs. A16 and A17 (Fig. 13 a) shows that σ(ɛ) can be well-fitted by a linear relationship for the time range considered. In fact, disagreement between the fit and the data are only visible for very short times in a ln[σ(t)]/ln[ɛ(t)] plot (Fig. 13 b). Thus, the apparent linear relationship between stress and strain, in an experiment where the evolution of these two quantities are related, does not imply elastic behavior. This quasi linear stress-strain relationship can even be observed with a material characterized by a weak power-law creep function.
FIGURE 13.
Data calculated using the mathematical analysis of Appendix 2 and representing the stress versus the strain for a cell characterized by a creep function J(t) = Atα and submitted to a constant-rate-of-charge (Fig. 12). Fitting this data by a linear relationship may appear acceptable in a lin-lin plot (a), whereas discrepancies are revealed by a Ln-Ln representation over more than one strain decade (b). Thus, an apparent linear (elastic) regime may hide a power-law behavior.
References
- Albrecht-Buehler, G. 1987. Role of cortical tension in fibroblast shape and movement. Cell Motil. Cytoskeleton. 7:54–67. [DOI] [PubMed] [Google Scholar]
- Alcaraz, J., L. Buscemi, M. Grabulosa, X. Trepat, B. Fabry, R. Farré, and D. Navajas. 2003. Microrheology of human lung epithelial cells measured by atomic force microscopy. Biophys. J. 84:2071–2079. [DOI] [PMC free article] [PubMed] [Google Scholar]
- Balland, M., A. Richert, and F. Gallet. 2005. The dissipative contribution of myosin II in the cytoskeleton dynamics of myoblasts. Eur. Biophys. J. DOI: 10.1007/S00249-004-0447-7. [DOI] [PubMed]
- Bausch, A. R., F. Ziemann, A. A. Boulbitch, K. Jacobson, and E. Sackmann. 1998. Local measurements of viscoelastic parameters of adherent cell surface by magnetic bead microrheology. Biophys. J. 75:2038–2049. [DOI] [PMC free article] [PubMed] [Google Scholar]
- Beil, M., A. Micoulet, G. Von Wichert, S. Paschke, P. Walther, M. B. Omary, P. P. Van Veldhoven, U. Gern, E. Wolff-Hieber, J. Eggermann, J. Waltenberger, G. Adler, et al. 2003. Sphingosylphosphorylcholine regulates keratin network architecture and visco-elastic properties of human cancer cells. Nat. Cell Biol. 9:803–811. [DOI] [PubMed] [Google Scholar]
- Bouchaud, J. P. 1992. Weak ergodicity breaking and aging in disordered systems. J. Phys. I. (Fr.). 2:1705–1713. [Google Scholar]
- Changeux, J. P., C. Pinset, and A. B. Ribera. 1986. Effects of chlorpromazine and phenylcycline on C2 acetylcholine receptor kinetics. J. Physiol. 378:497–513. [DOI] [PMC free article] [PubMed] [Google Scholar]
- Evans, E., and A. Yeung. 1989. Apparent viscosity and cortical tension of blood granulocytes determined by micropipette aspiration. Biophys. J. 56:151–160. [DOI] [PMC free article] [PubMed] [Google Scholar]
- Fabry, B., G. N. Maksym, J. Butler, M. Glogauer, D. Navajas, and J. J. Fredberg. 2001. Scaling the microrheology of living cells. Phys. Rev. Lett. 87:148102–148104. [DOI] [PubMed] [Google Scholar]
- Fabry, B., G. N. Maksym, S. A. Shore, P. E. Moore, A. Reynold, J. R. Panettieri, J. P. Butler, and J. J. Fredberg. 2001. Signal transduction in smooth muscle, selected contribution: time course and heterogeneity of contractile responses in cultured human airway smooth muscle cells. J. Appl. Physiol. 91:986–994. [DOI] [PubMed] [Google Scholar]
- Fabry, B., G. N. Maksym, J. P. Butler, M. Glogauer, D. Navajas, N. A. Taback, E. J. Millet, and J. J. Fredberg. 2003. Time scale and other invariants of integrative mechanical behavior in living cells. Phys. Rev. E. 68:041914-1–041914-18. [DOI] [PubMed] [Google Scholar]
- Felder, S., and E. L. Elson. 1990. Mechanics of fibroblast locomotion: quantitative analysis of forces and motions at the leading lamellas of fibroblasts. J. Cell Biol. 111:2513–2526. [DOI] [PMC free article] [PubMed] [Google Scholar]
- Guck, J., R. Ananthakrishnan, H. Mahmood, T. J. Moon, C. C. Cunningham, and J. Käs. 2001. The optical stretcher: a novel tool to micromanipulate cells. Biophys. J. 81:767–784. [DOI] [PMC free article] [PubMed] [Google Scholar]
- Hoh, J. H., and C. A. Schoenenberger. 1994. Surface morphology and mechanical properties of MDCK monolayers by atomic force microscopy. J. Cell Sci. 107:1105–1114. [DOI] [PubMed] [Google Scholar]
- Janmey, P. A. 1998. The cytoskeleton and cell signaling: component localization and mechanical coupling. Physiol. Rev. 78:763–781. [DOI] [PubMed] [Google Scholar]
- Kruse, K., J. F. Joanny, F. Jülicher, J. Prost, and K. Sekimoto. 2004. Asters, vortices, and rotating spirals in active gels of polar filaments. Phys. Rev. Lett. 92:078101–078104. [DOI] [PubMed] [Google Scholar]
- Lau, A. W. C., B. D. Hoffmann, A. Davies, J. C. Crocker, and T. C. Lubensky. 2003. Microrheology, stress fluctuations, and active behavior of living cells. Phys. Rev. Lett. 91:198101–198104. [DOI] [PubMed] [Google Scholar]
- Le Goff, L., F. Amblard, and E. M. Furst. 2002. Motor-driven dynamics in actin-myosin networks. Phys. Rev. Lett. 88:018101–018104. [DOI] [PubMed] [Google Scholar]
- Lenormand, G., E. Millet, B. Fabry, J. P. Butler, and J. J. Fredberg. 2004. Linearity and time-scale invariance of the creep function in living cells. J. R. Soc. Lond. Interface. E-pub. 1 October, 2004. [DOI] [PMC free article] [PubMed]
- Ponton, A., S. Warlus, and P. Griesmar. 2002. Rheological study of the sol-gel transition in silica alkoxides. J. Colloid Interface Sci. 249:209–216. [DOI] [PubMed] [Google Scholar]
- Sheetz, M. P. 1998. Laser Tweezers in Cell Biology. Academic Press, New York.
- Shroff, S. G., D. R. Saner, and R. Lal. 1995. Dynamic micromechanical properties of cultured rat atrial myocytes measured by atomic-force microscopy. Am. J. Physiol. Cell Physiol. 38:C286–C292. [DOI] [PubMed] [Google Scholar]
- Sollich, P., F. Lequeux, P. Hébraud, and M. E. Cates. 1997. Rheology of soft glassy materials. Phys. Rev. Lett. 78:2020–2024. [Google Scholar]
- Suki, B., A. L. Barabási, and K. R. Lutchen. 1994. Lung tissue viscoelasticity: a mathematical framework and its molecular basis. J. Appl. Physiol. 76:2749–2759. [DOI] [PubMed] [Google Scholar]
- Svoboda, K., and S. M. Block. 1994. Biological applications of optical forces. Ann. Rev. Biophys. Biomol. Struct. 23:247–285. [DOI] [PubMed] [Google Scholar]
- Thoumine, O., and A. Ott. 1997. Timescale-dependent viscoelastic and contractile regimes in fibroblasts probed by microplate manipulation. J. Cell Sci. 110:2109–2116. [DOI] [PubMed] [Google Scholar]
- Tran-Son-Tay, R., D. Needham, A. Teung, and R. M. Hochmuth. 1991. Time-dependent recovery of passive neutrophils after large deformation. Biophys. J. 60:856–866. [DOI] [PMC free article] [PubMed] [Google Scholar]
- Tsai, M. A., R. S. Frank, and R. E. Waugh. 1993. Passive mechanical behavior of human neutrophils: power-law fluid. Biophys. J. 65:2078–2088. [DOI] [PMC free article] [PubMed] [Google Scholar]
- Valberg, P. A. 1984. Magnetometry of ingested particles in pulmonary macrophages. Science. 224:513–516. [DOI] [PubMed] [Google Scholar]
- Wang, N., J. P. Butler, and D. E. Ingber. 1993. Mechanotransduction across the cell surface and through the cytoskeleton. Science. 260:1124–l 127. [DOI] [PubMed] [Google Scholar]
- Zhu, C., G. Bao, and N. Wang. 2000. Cell mechanics: mechanical response, cell adhesion, and molecular deformation. Annu. Rev. Biomed. Eng. 2:189–226. [DOI] [PubMed] [Google Scholar]


