

Abstract
Collective cell movement acts as an efficient strategy in many physiological events, including wound healing, embryonic development, and morphogenesis. We found that epithelial cells (Madin-Darby canine kidney cell) migrated collectively along one direction on a collagen gel substrate. Time-lapse images of Madin-Darby canine kidney cells cultured on type-I collagen gels and glass substrates were captured by phase contrast microscopy equipped with an incubation system. On the gel substrate, the directions of cell movement gradually converged on one direction as the number of cells increased, whereas the cells moved randomly on the glass substrate. We also observed “leader” cells, which extended large lamellae and were accompanied by many “follower” cells, migrating in the direction of oriented collagen fibers. The mean-squared displacement of each cell movement and the spatial correlation function calculated from the spatial distribution of cell velocity were obtained as functions of observation time. In the case of the gel substrate, the spatial correlation length increased gradually, representing the collectiveness of multicellular movement.
INTRODUCTION
Cell movement plays an important role in many physiological processes, including wound healing, inflammatory response, and metastasis of tumor cells. A number of studies have shown that various extracellular stimuli activate cell movement. For example, gradients of soluble chemicals (chemotaxis; Chung and Firtel, 2002), substrate flexibility (durotaxis; Lo et al., 2000), extracellular tension (tensotaxis; Beloussov et al., 2000), and electrostatic potential (galvanotaxis; Erickson and Nuccitelli, 1984), all are known to act as triggers for cell migration. In addition, geometric anisotropy of substrate, such as grooved glass, also induces oriented cell movement in a phenomenon called contact guidance (Dunn and Brown, 1986). In addition to these extracellular stimuli, the intracellular processes of cell movement have been studied extensively over the last decade. Single-cell movement is a process consisting of four steps: pseudopodial protrusion, formation of focal adhesions, development of contractile force, and detachment of old adhesions (Lauffenburger and Horwitz, 1996). These steps are integrated temporally and spatially through regulated intracellular responses, such as signaling pathways and cytoskeletal reorganization (Ridley et al., 2003).
Although the underlying mechanism of the migration of individual cells has been elucidated, it is more important to develop a better understanding of multicellular movement where cells interact strongly and move collectively. The coordinated movement of cells is essential for many physiological events, as it occurs throughout tissue regeneration (Jacinto et al., 2001) and early embryogenesis, such as gastrulation and invagination (Armstrong, 1985; Simske and Hardin, 2001; Lecuit and Pilot, 2003), where epithelial cells play a central role in morphogenesis; epithelial cells form many kinds of organic structures, including sheets, cysts, and tubules (O'Brien et al., 2002; Zegers et al., 2003). Although the processes responsible for construction of multicellular tissues are less well understood, the epithelial architecture is believed to be orchestrated by two distinct elements: intrinsic and/or growth factor-induced differentiation programs, and mechanical stimuli from the environment, including the extracellular matrix and neighboring cells. For example, hepatocyte growth factor induces the formation of branching tubules by Madin-Darby canine kidney (MDCK) cells in three-dimensional collagen gels (Brinkmann et al., 1995; Rosário and Birchmeier, 2003). Long-term exposure of an endothelial sheet to fluid shear stress leads to morphological changes and collective movement of endothelial cells (Malek and Izumo, 1996; Dieterich et al., 2000). Aggregates of Hydra cells intermingled randomly with multiple cell types dissociate and rearrange themselves to constitute homotypic domains, in a process known as cell sorting (Gierer et al., 1972).
In this study, we showed that MDCK cells migrate collectively as a massive stream along one direction on a soft collagen gel surface until the complete formation of a confluent epithelial sheet, whereas such collective movement was not observed on a stiff substrate, such as a glass petri dish. Mean-squared displacement and spatial correlation function averaged along the trajectory of each cell movement were analyzed on the basis of statistical analysis. On the gel substrate, as the number of cells increased, the direction of cell movement gradually became aligned with the polarization of the collagen fibers. To explain these observations, we propose that the fibril alignment, which is polarized spontaneously or rearranged by the cellular contractile force applied to the gel substrate, acts as a determining factor for unidirectional movement, and increased cellular mobility on the gel surface may also play a role in the collective movement.
MATERIALS AND METHODS
Cell culture
Epithelial cells (MDCK; purchased from RIKEN Cell Bank, Tsukuba, Japan) were maintained in low-glucose Dulbecco's modified Eagle's medium (Invitrogen, Carlsbad, CA) supplemented with 10% fetal bovine serum alternative (FetalClone III; Hyclone, Logan, UT) at 37°C and 5% CO2 in a humidified incubator. All experiments were performed before the tenth passage.
Gelation of collagen and sample preparation
Collagen solution and gel were prepared as described previously (Michalopoulos and Pitot, 1975). Briefly, for the preparation of 1.75 mg/ml collagen gel, 7 vol type-I collagen solution derived from porcine tendon (Cellmatrix I-P; Nitta Gelatin, Osaka, Japan) was mixed with threefold concentrated Dulbecco's modified Eagle's medium (4 vol), and 200 mM HEPES buffer containing 260 mM NaHCO3 and 50 mM NaOH (1 vol) at 4°C. To obtain oriented bundles of collagen fibers, the mixture was bubbled with a micropipette for a few minutes. The degree of fibril orientation can be controlled empirically by the length of the bubbling period, although the mechanism by which collagen fibers are polarized by bubbling remains unclear; the fibers show a greater degree of orientation in one direction with longer periods of bubbling of the collagen solution. After bubbling, 1.0-ml aliquots of the mixture were poured into glass petri dishes, and incubated for 60 min at 37°C to allow gelation. We used only collagen gels showing homogeneous orientation within the entire field of view in all measurements. Trypsinized cell suspension was plated onto the collagen gel surface. After incubation overnight to permit cell adhesion, the petri dishes were filled with culture medium, and sealed with silicone grease to avoid changes in pH of the medium. Under these conditions, the cells could live for ∼1 week because of the large amount of culture medium, although CO2 was not controlled after the chamber was sealed.
For preparation of collagen-coated dishes, a small amount of chilled collagen solution was poured into glass petri dishes to cover the surface. The petri dishes were then tilted, the excess collagen solution was aspirated off, and the resultant collagen-coated dishes were air-dried. We observed the collagen matrix coating the plates by immunofluorescent using anticollagen antibody (Monosan, Uden, The Netherlands). The collagen matrix was <1 μm in thickness and was coated evenly on the glass surface.
Time-lapse imaging and cell tracking
A phase contrast microscope (TE2000; Nikon Instech, Tokyo, Japan) equipped with a 10× objective (numerical aperture 0.3), and enclosed in an acrylic resin box in which the temperature was kept at 37°C, was used for time-lapse observations. Time-lapse images were captured every 5 min using a high-resolution digital charge-coupled device camera (ORCA-1394; Hamamatsu Photonics K.K., Hamamatsu, Japan) controlled by Image-Pro software (Media Cybernetics, Silver Spring, MD). Observations were started 12 h after plating the cell suspension on the petri dish, and continued for ∼4 days. After completion of time-lapse measurements, a movie was edited from the series of captured images. The positions of individual cells were determined manually based on the center of the nucleus, and recorded using Scion-Image software (available at no charge from http://www.scioncorp.com).
Statistical analysis of cell movement
The mean-squared displacement (MSD), 〈ρ2(t)〉, was calculated as a function of time interval Δt as described previously (Rieu et al., 2000):
 |
(1) |
where xi and yi denote the Cartesian coordinates of the cell i, and the average was carried out over not only cells in a set but also possible time t0 using the overlapping interval method (Dickinson and Tranquillo, 1993). In this study, all movies were divided into sections of 10 h of time-lapse data; each data set consisted of 120 images. In the calculation of MSD for each data set, the time interval Δt ranged from 30 min to 5 h.
In general, the MSD has the asymptotic power-law form:
 |
(2) |
where α = 1 and 2 represent a random walk and ballistic movement, respectively. The exponent α can also be 1 < α < 2, corresponding to the anomalous diffusion induced by temporal and/or spatial correlations (Upadhyaya et al., 2001; Morgado et al., 2002).
The spatial correlation of the velocity, C(r), can be written as a function of cell distance r:
 |
(3) |
where vi denotes the velocity vector of cell i, at position ri, calculated from the difference between the cell positions in two images taken at an interval of 5 min. The maximum value C = 1 represents highly collective movement in one direction, whereas the minimum value C = 0 represents no correlation between distant cells.
Quantification of collagen gel polarization
The degrees of gel polarization were quantified based on the results of two-dimensional (2-D) Fourier analysis (Sawhney and Howard, 2002). A typical phase contrast image of the collagen gel substrate is shown in Fig. 1 A. This image was taken just before the start of the time-lapse experiment. The phase contrast images were converted to 2-D power spectra by Fourier transformation. The histogram of the power spectrum was plotted as a function of orientation, and fitted to the Gaussian distribution:
 |
(4) |
where a0 is the offset, b0 is the amplitude of the Gaussian distribution, Φ0 is the mean polarization angle, and ±SD σ denotes randomness of the collagen bundles at the gel surface; i.e., small σ-values represent a highly polarized substrate. The result of quantification of polarization is shown in Fig. 1 B. The histogram of the 2-D power spectrum showed a good fit with the Gaussian distribution function.
FIGURE 1.
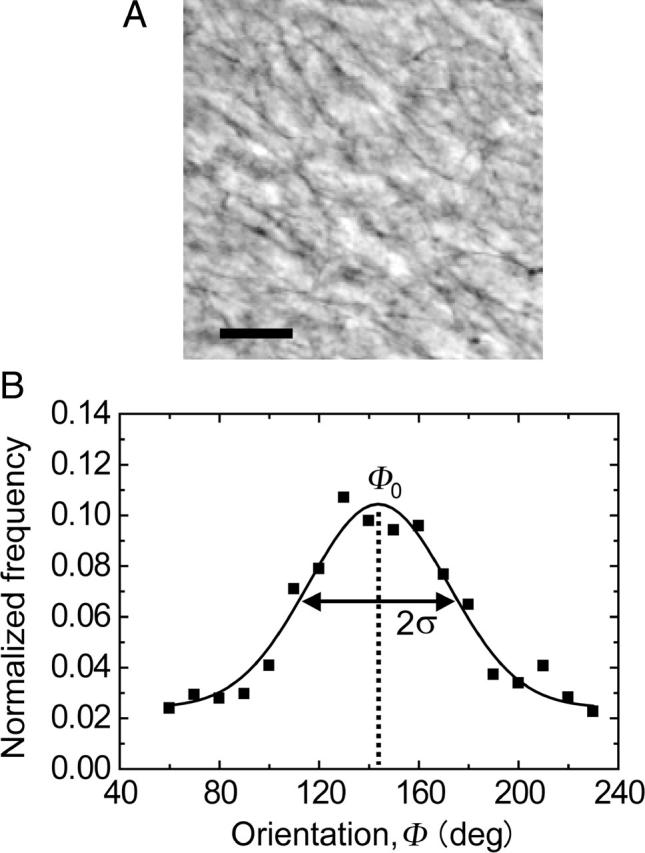
(A) Typical phase contrast micrograph of the collagen gel surface taken just before the time-lapse measurement. The bar represents 20 μm. (B) A histogram of the 2-D power spectrum calculated from the phase contrast micrograph shown in panel A as a function of orientation. The spectrum showed a good fit with the Gaussian distribution function (solid curve). Φ0 and σ represent mean angle and standard deviation, respectively.
RESULTS AND DISCUSSION
Fig. 2 shows typical time-lapse images of an epithelial colony. The images shown are representative of the actual images taken every 5 min. The cells were moving and proliferating with time on the collagen gel surface. The colored dots indicate the direction of individual cell movement, defined by the hue circle shown in the figure. Cells marked with similar colored dots moved collectively in the same direction forming domain-like structures on the collagen gel. The domains grew gradually, and three streams running in opposite directions to each other were observed after 60 h (arrows in Fig. 2). The number of cells moving to the upper left, indicated by the light blue dots, increased gradually over time. Finally, all cells moved in the same direction until a complete confluent epithelial sheet was formed.
FIGURE 2.
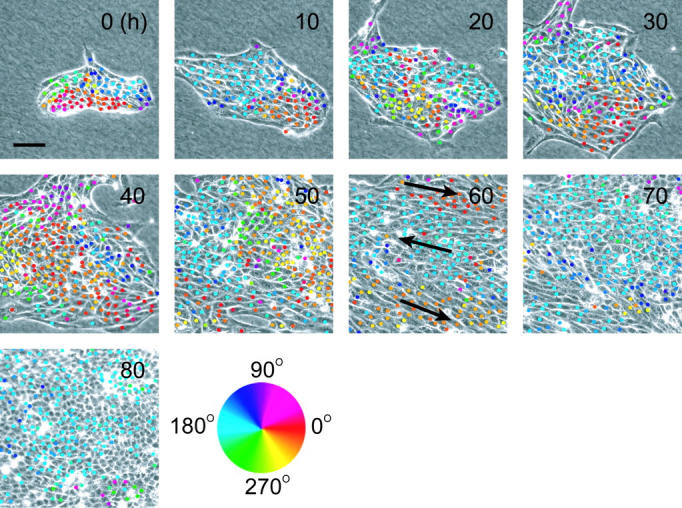
Temporal sequence of phase contrast micrographs of an epithelial colony on the collagen gel surface. Numbers in the images represent relative time from the start of observation. The direction of each cell movement is marked by colored dots in the micrographs. Arrows in the image at 60 h represent the direction of massive cell streams. Note that not all cell movements are marked, especially in the images after 70 h, because in some cells, the distance of cell movement was too small to determine the direction of movement from the captured images. A hue circle is shown as a legend for the angular displacement. Bar is 100 μm.
As a control experiment, time-course images of an epithelial colony on the glass surface were captured (Fig. 3). Although some domain-like structures consisting of similar colored dots were seen, collective cellular movement as seen in the case of collagen gel was not observed. That is, the cells on the glass surface moved randomly until a confluent sheet was formed.
FIGURE 3.
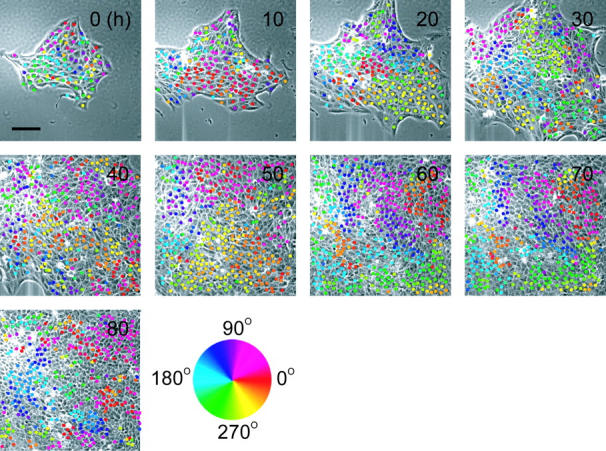
Time-lapse micrographs of an epithelial colony on the glass substrate. Representative actual images taken every 5 min are shown. Numbers in the micrographs denote the observation time. Colored dots represent the directions of cell movements, which are defined by the hue circle shown in the figure. Bar is 100 μm.
We analyzed the velocity distribution as well as the angular information shown in Figs. 2 and 3. No characteristic distribution of velocity was observed for the epithelial colonies on either the gel or glass substrate (data not shown), with the mean values remaining essentially constant until 70 h. The cells on the collagen gel always moved faster than those on the glass substrate: i.e., 19.6 μm/h for collagen gel, and 14.6 μm/h for glass substrate at subconfluency. Moreover, we did not observe any notable differences in velocity at the boundaries between the different domains shown in Figs. 2 and 3.
To determine whether the collective cell movements seen on the collagen gel were simply due to the stiffness of the gel or to some biochemical interactions of transmembrane adhesive proteins with the collagen matrix, we performed another control experiment using collagen-coated dishes. The coated collagen fibers adhered to the glass substrate firmly and formed a thin layer, indicating that the substrate had the same stiffness as glass. We obtained essentially the same results with bare glass substrate (data not shown). These results indicated clearly that the cells moved randomly on a collagen-coated glass substrate with less speed than on the gel substrate (16.1 μm/h on the collagen-coated glass substrate). Therefore, the collective cell movements seen on the collagen gel were a phenomenon specific to an elastic gel substrate.
Using the cell trajectories obtained from the time-lapse data, the MSD was calculated as a function of time interval. Fig. 4 A shows the typical MSD plotted against the time interval on a log-log scale. All data formed straight lines, indicating asymptotic power-law behavior. Fig. 4 B shows the exponents analyzed from 20 cell trajectories plotted against the observation time denoted in Figs. 2 and 3. The exponents were always larger in the gel than the glass substrate. Especially, the exponent in the gel substrate at 70 h was close to 2.0, which represents movement in a straight line. These results indicated that on the gel substrate the cells moved in more of a straight line as compared with those on the glass substrate.
FIGURE 4.
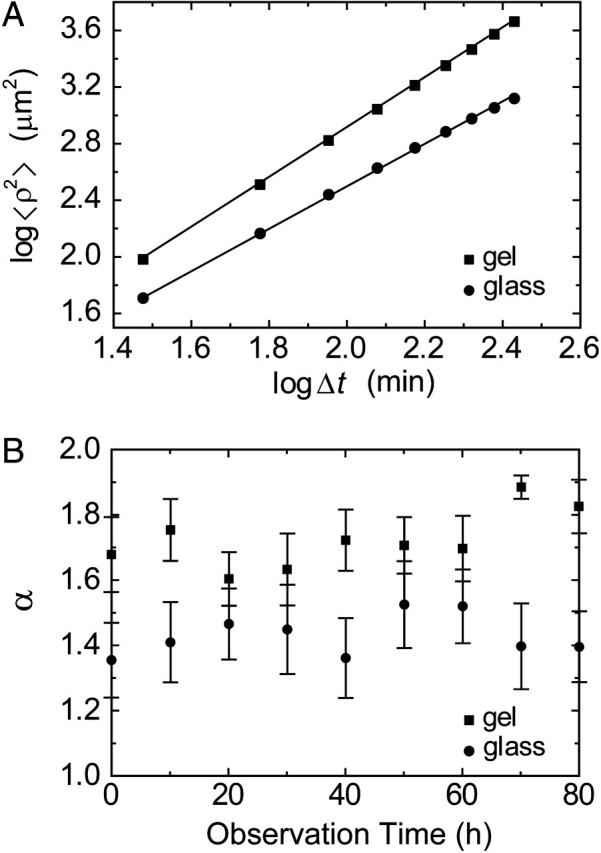
(A) Typical mean-squared displacements calculated as a function of time interval, Δt. The asymptotic power-law function (Eq. 2) was fitted by the linear least-squares method (solid lines). Both data were linear on a log-log scale, implying anomalous diffusion due to temporal and/or spatial correlations. (B) Exponents of the asymptotic power-law behavior of the MSD as a function of the actual observation time. Twenty cell trajectories on each substrate were chosen at random and analyzed. Error bars denote 95% confidential limits calculated by Student's t-test.
We calculated the spatial correlation function that indicates the directionally correlative movement between distant cells. In the case of the glass substrate, the correlation function was almost 0 at a distance of 200 μm at all observation times (Fig. 5 A). On the other hand, the spatial correlation increased gradually in the case of the collagen gel substrate (Fig. 5 B). Especially, the correlation after 70 h increased markedly, representing collective cell movement.
FIGURE 5.
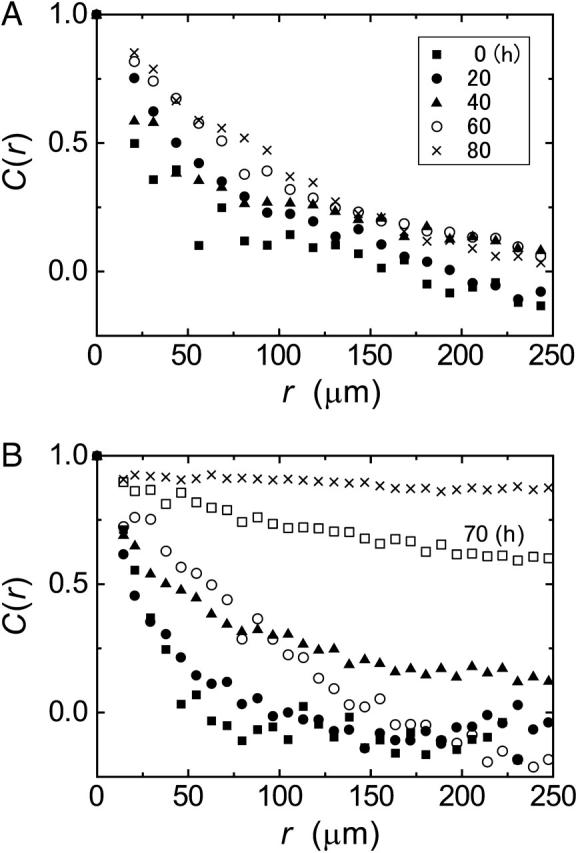
Spatial correlation functions of the cell velocity on glass (A) and gel (B) substrates as a function of distance between cells. Different symbols represent the different observation times corresponding to Figs. 2 and 3.
To determine whether polarization of the collagen substrate affects collective cell movement, we analyzed three different sets of data, where each substrate had different degrees of initial polarization. To determine the correlation of cell movement and substrate polarization, the cosine of the angle between the direction of cell movement, θ, and polarization of the collagen substrate, Φ0, was plotted as a function of observation time (Fig. 6). The results indicated that the cells showed an increase in movement along the direction of substrate polarization as the degree of polarization increased. This was due to contact guidance, where the oriented collagen fibers acted as a guide for cell movement. Moreover, even in the case of a less oriented substrate, as the number of cells increased, the direction of cell movement gradually became aligned with the polarization of the collagen substrate. This was probably due to increases in cell-cell interactions giving rise to collective cell movement in a self-organized manner, or possibly to the rearrangement of collagen fibers by the cellular contractile forces resulting in unidirectional cell movement.
FIGURE 6.

Average cosine of the angle between the direction of cell movement, θ, and the mean polarization of the gel substrate, Φ0, plotted as a function of observation time. Averages were determined from 50 to 300 cell trajectories on each gel substrate. σ denotes the standard deviation of the substrate polarization; large values of σ represent low polarity of the substrate. Even in the poorly oriented substrate, the difference in angle between cell movement and collagen orientation decreased after 60 h, which is represented in the figure as interpolating lines.
At present, although it is not clear how each cell cooperates with each other to migrate collectively in one direction, “leader” cells seem to play an important role in multicellular movement. A recent study revealed that elongation of the epithelial sheet involved two distinct types of epithelial cells; i.e., “leaders” and “followers” (Omelchenko et al., 2003). An epithelial cell at the edge of an epithelial sheet that adopts a fibroblast-like morphology extending a wide lamellipodium is called a “leader”, and these cells move out of the colony with the accompanying neighboring cells named “followers”. We observed the same phenomena on both gel and glass substrates. Especially, the “leader” cells on the gel substrate each extended a large lamella and were accompanied by “follower” cells (L in Fig. 7). The “leader” cells appeared only at the edge of the colony, and led the accompanying “followers” for several hours. The number of “followers” on the gel substrate seemed to be larger than that on the glass substrate, resulting in collective cell movement.
FIGURE 7.
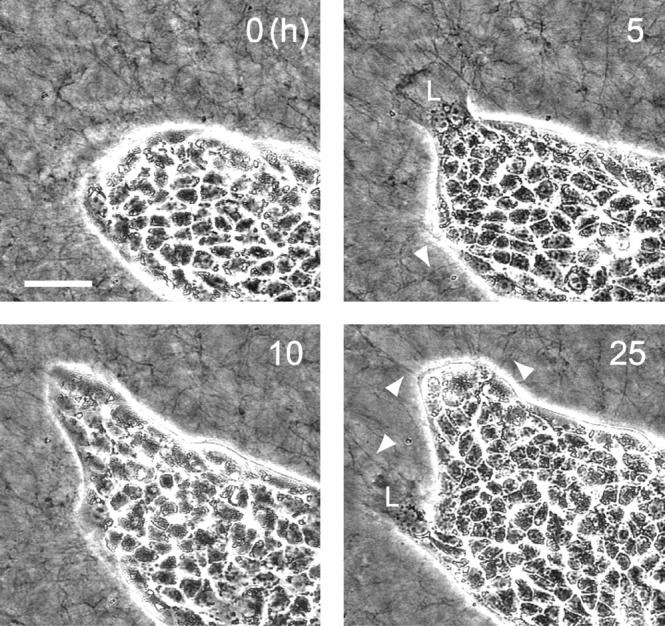
Time-lapse phase contrast images of a portion of an epithelial colony on the collagen gel surface. Contrast on the micrographs was intensified to allow visualization of the thick collagen fibers. Numbers in the images represent relative times from the start of observation. The “leader” cells are marked L in the micrographs. Arrowheads in the image indicate the collagen fibers contracted by the cells. The bar represents 50 μm.
Here, we discuss possible mechanisms to account for the collective cell movement on the collagen gel. In the phase contrast micrographs, we observed thick collagen bundles oriented perpendicular to the edge of the colony (arrowheads in Fig. 7), which was due to the cellular contractile force applied to the gel substrate (Sawhney and Howard, 2002). The cellular contractile force can rearrange the oriented bundles of collagen fibers, and may determine the direction of collective cell movement, as cells migrate in the direction of oriented collagen fibers, a phenomenon named contact guidance. The effect of contact guidance may be stronger on softer than on stiffer substrates as the former are more plastic under cell traction.
The increased mobility observed on the collagen gel may also be a determinant factor for collective cell migration because high mobility can lead to inertial motion in the congested state. This is consistent with the results of previous studies indicating that softer substrates induced increases in mobility (Pelham and Wang, 1997; Lo et al., 2000). Although it is not yet clear how cells can sense the softness of the substrate and increase their mobility, the cell-substrate and/or cell-cell interactions that are dependent on the rigidity of the substrate would also be involved. A recent study indicated that the physical nature of the substrate, i.e., rigidity, induced downregulation of focal adhesion proteins, including focal adhesion kinase, talin, paxillin, and p130cas, but not vinculin, which are mediated by α2β1-integrin (Wang et al., 2003). On the collagen gel surface, cell-cell junctional proteins, including E-cadherin, catenins, plakoglobin, and desmoplakin-1/2, were also downregulated through the integrin-mediated signaling pathways (Ojakian et al., 2001). Moreover, our fluorescence analyses using phalloidin staining (Alexa546-phalloidin; Molecular Probes, Eugene, OR) indicated that the “follower” cells had fewer stress fibers on the collagen substrate as compared to the glass substrate (data not shown). These results suggest that the downregulation of specific adhesion proteins due to the softness of the substrate reduces the formation of both focal adhesions and adherens junctions, which may cause the cells to adopt a more motile state known as amoeboid migration (Friedl et al., 2001).
This is the first quantitative study of collective migration of epithelial cells on collagen gel. The collectiveness of cell movement was characterized by statistical analysis. To elucidate the molecular mechanism responsible for the collective migration, we are currently planning further studies of the signaling pathways and cytoskeletal organization. Moreover, the optimum stiffness of collagen gel for the induction of collective cell movement has not been quantified. Therefore, further studies using collagen gels of different stiffness are required.
SUPPLEMENTARY MATERIAL
An online supplement to this article can be found by visiting BJ Online at http://www.biophysj.org.
The supplement consists of movies edited from the time-lapse images captured every 5 min in which 1 s corresponds to 5 h.
Supplementary Material
Acknowledgments
We are grateful to Mr. N. Hirakawa for his preliminary examination and Ms. K. Hayashi for her help with the statistical analyses.
This work was supported by a Grant-in-Aid from the Ministry of Education, Culture, Sports, Science and Technology of Japan (grant 14780536 to H.H. and grant 15650051, 14GS0301 to K.K.).
References
- Armstrong, P. B. 1985. The control of cell motility during embryogenesis. Cancer Metast. Rev. 4:59–79. [DOI] [PubMed] [Google Scholar]
- Beloussov, L. V., N. N. Louchinskaia, and A. A. Stein. 2000. Tension-dependent collective cell movements in the early gastrula ectoderm of Xenopus laevis embryos. Dev. Genes Evol. 210:92–104. [DOI] [PubMed] [Google Scholar]
- Brinkmann, V., H. Foroutan, M. Sachs, K. M. Weidner, and W. Birchmeier. 1995. Hepatocyte growth factor/scatter factor induces a variety of tissue-specific morphogenic programs in epithelial cells. J. Cell Biol. 131:1573–1586. [DOI] [PMC free article] [PubMed] [Google Scholar]
- Chung, C. Y., and R. A. Firtel. 2002. Signaling pathways at the leading edge of chemotaxing cells. J. Muscle Res. Cell Motil. 23:773–779. [DOI] [PubMed] [Google Scholar]
- Dickinson, R. B., and R. T. Tranquillo. 1993. Optimal estimation of cell movement indices from the statistical analysis of cell tracking data. Am. Inst. Chem. Eng. J. 39:1995–2010. [Google Scholar]
- Dieterich, P., M. Odenthal-Schnittler, C. Mrowietz, M. Krämer, L. Sasse, H. Oberleithner, and H. J. Schnittler. 2000. Quantitative morphodynamics of endothelial cells within confluent cultures in response to fluid shear stress. Biophys. J. 79:1285–1297. [DOI] [PMC free article] [PubMed] [Google Scholar]
- Dunn, G. A., and A. F. Brown. 1986. Alignment of fibroblasts on grooved surfaces described by a simple geometric transformation. J. Cell Sci. 83:313–340. [DOI] [PubMed] [Google Scholar]
- Erickson, C. A., and R. Nuccitelli. 1984. Embryonic fibroblast motility and orientation can be influenced by physiological electric fields. J. Cell Biol. 98:296–307. [DOI] [PMC free article] [PubMed] [Google Scholar]
- Friedl, P., S. Borgmann, and E. B. Brocker. 2001. Amoeboid leukocyte crawling through extracellular matrix: lessons from the Dictyostelium paradigm of cell movement. J. Leukoc. Biol. 70:491–509. [PubMed] [Google Scholar]
- Gierer, A., S. Berking, H. Bode, C. N. David, K. Flick, G. Hansmann, H. Schaller, and E. Trenkner. 1972. Regeneration of Hydra from reaggregated cells. Nat. New Biol. 239:98–101. [DOI] [PubMed] [Google Scholar]
- Jacinto, A., A. Martinez-Arias, and P. Martin. 2001. Mechanisms of epithelial fusion and repair. Nat. Cell Biol. 3:E117–E123. [DOI] [PubMed] [Google Scholar]
- Lauffenburger, D. A., and A. F. Horwitz. 1996. Cell migration: a physically integrated molecular process. Cell. 84:359–369. [DOI] [PubMed] [Google Scholar]
- Lecuit, T., and F. Pilot. 2003. Developmental control of cell morphogenesis: a focus on membrane growth. Nat. Cell Biol. 5:103–108. [DOI] [PubMed] [Google Scholar]
- Lo, C. M., H. B. Wang, M. Dembo, and Y. L. Wang. 2000. Cell movement is guided by the rigidity of the substrate. Biophys. J. 79:144–152. [DOI] [PMC free article] [PubMed] [Google Scholar]
- Malek, A. M., and S. Izumo. 1996. Mechanism of endothelial cell shape change and cytoskeletal remodeling in response to fluid shear stress. J. Cell Sci. 109:713–726. [DOI] [PubMed] [Google Scholar]
- Michalopoulos, G., and H. C. Pitot. 1975. Primary culture of parenchymal liver cells on collagen membranes. Morphological and biochemical observations. Exp. Cell Res. 94:70–78. [DOI] [PubMed] [Google Scholar]
- Morgado, R., F. A. Oliveira, G. G. Batrouni, and A. Hansen. 2002. Relation between anomalous and normal diffusion in systems with memory. Phys. Rev. Lett. 89:100601–100604. [DOI] [PubMed] [Google Scholar]
- O'Brien, L. E., M. M. Zegers, and K. E. Mostov. 2002. Opinion: building epithelial architecture: insights from three-dimensional culture models. Nat. Rev. Mol. Cell Biol. 3:531–537. [DOI] [PubMed] [Google Scholar]
- Ojakian, G. K., D. R. Ratcliffe, and R. Schwimmer. 2001. Integrin regulation of cell-cell adhesion during epithelial tubule formation. J. Cell Sci. 114:941–952. [DOI] [PubMed] [Google Scholar]
- Omelchenko, T., J. M. Vasiliev, I. M. Gelfand, H. H. Feder, and E. M. Bonder. 2003. Rho-dependent formation of epithelial “leader” cells during wound healing. Proc. Natl. Acad. Sci. USA. 100:10788–10793. [DOI] [PMC free article] [PubMed] [Google Scholar]
- Pelham, R. J., and Y.-L. Wang. 1997. Cell locomotion and focal adhesions are regulated by substrate flexibility. Proc. Natl. Acad. Sci. USA. 94:13661–13665. [DOI] [PMC free article] [PubMed] [Google Scholar]
- Ridley, A. J., M. A. Schwartz, K. Burridge, R. A. Firtel, M. H. Ginsberg, G. Borisy, J. T. Parsons, and A. R. Horwitz. 2003. Cell migration: integrating signals from front to back. Science. 302:1704–1709. [DOI] [PubMed] [Google Scholar]
- Rieu, J. P., A. Upadhyaya, J. A. Glazier, N. B. Ouchi, and Y. Sawada. 2000. Diffusion and deformations of single Hydra cells in cellular aggregates. Biophys. J. 79:1903–1914. [DOI] [PMC free article] [PubMed] [Google Scholar]
- Rosário, M., and W. Birchmeier. 2003. How to make tubes: signaling by the Met receptor tyrosine kinase. Trends Cell Biol. 13:328–335. [DOI] [PubMed] [Google Scholar]
- Sawhney, R. K., and J. Howard. 2002. Slow local movements of collagen fibers by fibroblasts drive the rapid global self-organization of collagen gels. J. Cell Biol. 157:1083–1091. [DOI] [PMC free article] [PubMed] [Google Scholar]
- Simske, J. S., and J. Hardin. 2001. Getting into shape: epidermal morphogenesis in Caenorhabditis elegans embryos. Bioessays. 23:12–23. [DOI] [PubMed] [Google Scholar]
- Upadhyaya, A., J. P. Rieu, J. A. Glazier, and Y. Sawada. 2001. Anomalous diffusion and non-Gaussian velocity distribution of Hydra cells in cellular aggregates. Physica. A. 293:549–558. [Google Scholar]
- Wang, Y. K., Y. H. Wang, C. Z. Wang, J. M. Sung, W. T. Chiu, S. H. Lin, Y. H. Chang, and M. J. Tang. 2003. Rigidity of collagen fibrils controls collagen gel-induced down-regulation of focal adhesion complex proteins mediated by alpha2beta1 integrin. J. Biol. Chem. 278:21886–21892. [DOI] [PubMed] [Google Scholar]
- Zegers, M. M., L. E. O'Brien, W. Yu, A. Datta, and K. E. Mostov. 2003. Epithelial polarity and tubulogenesis in vitro. Trends Cell Biol. 13:169–176. [DOI] [PubMed] [Google Scholar]
Associated Data
This section collects any data citations, data availability statements, or supplementary materials included in this article.