

Abstract
Spatial positioning of pericentric chromosome regions in human lymphocyte cell nuclei was investigated during repair after H2O2/L-histidine treatment. Fifteen to three-hundred minutes after treatment, these regions of chromosomes 1, 15, and X were labeled by fluorescence in situ hybridization. The relative locus distances (LL-distances), the relative distances to the nuclear center (LC-distances), and the locus-nuclear center-locus angles (LCL-angles) were measured in ∼5000 nuclei after two-dimensional microscopy. Experimental frequency histograms were compared to control data from untreated stimulated and quiescent (G0) nuclei and to a theoretical two-dimensional projection from random points. Based on the frequency distributions of the LL-distances and the LCL-angles, an increase of closely associated labeled regions was found shortly after repair activation. For longer repair times this effect decreased. After 300 min the frequency distribution of the LL-distances was found to be compatible with the random distance distribution again. The LL-distance frequency histograms for quiescent nuclei did not significantly differ from the theoretical random distribution, although this was the case for the stimulated control of chromosomes 15 and X. It may be inferred that, concerning the distances, homologous pericentric regions appear not to be randomly distributed during S-phase, and are subjected to dynamic processes during replication and repair.
INTRODUCTION
The three-dimensional architecture of the cell nucleus is not randomly organized but has a functional meaning (T. Cremer et al., 1993, 2000; C. Cremer et al., 1996; Cremer and Cremer, 2001; Parada et al., 2004). It has been shown by means of whole chromosome painting that each chromosome occupies a distinct, mutually exclusive territory in the cell nucleus. The radial positioning of these territories and their subchromosomal elements are relatively fixed, depending upon the gene density or genetic activity, respectively. Gene-dense chromosomes are found in the interior; gene-poor chromosomes are found in the periphery of a nucleus (M. Cremer et al., 2001, 2003; Kozubek et al., 2002; Falk et al., 2002). Computer simulations support the concept of global positioning that is dependent upon DNA content and gene density of a chromosome territory (Kreth et al., 2004).
In contrast to the radial positioning, the angular positioning of chromosomes and subchromosomal elements has been found to be random (Kozubek et al., 2002; Lukásová et al., 2002; Falk et al., 2002). Within chromosome territories the centromeres show a peripheral orientation whereas the telomeres are positioned toward the nuclear center (Amrichová et al., 2003; Weierich et al., 2003). In addition, the centromeres seem to play a significant role in the functional correlation of genome architecture and gene expression (Volpi et al., 2000; Bártová et al., 2002; Taslerová et al., 2003). The functionally determined positioning of chromosome territories was evolutionarily conserved (Tanabe et al., 2002), and seems to follow similar rules for several types of normal cells, as in, for instance, lymphocytes, fibroblasts, or amniotic fluid cells (M. Cremer et al., 2001; Boyle et al., 2001).
During the cell cycle (G1–S–G2 phase) the chromosome territories undergo only very limited large-scale translational movements, whereas more extended positional changes were observed during the first few hours after mitosis (Parada and Misteli, 2002; Walter et al., 2003). Quantitative live cell imaging suggests that chromosome territories are only subjected to an independent Brownian-diffusionlike motion (Edelmann et al., 2001). A higher mobility with diffusion coefficients in the order of 10−2 μm2/s has been reported for Drosophila and yeast (Gasser, 2002; Marshall, 2002). More complex rearrangements of chromosome territories have been found during mitosis and it is controversially discussed, how and whether chromosome positioning is maintained in daughter cell nuclei (Walter et al., 2003, Gerlich et al., 2003).
Besides such open questions of chromosome rearrangements during the normal cell cycle, chromosome organization, under certain functional conditions, has been reported that can be the result of large-scale chromosome movement—as in, for instance, homologous chromosome pairing in meiosis. The meiotic homolog pairing allows the exchange of DNA between homologous chromosomes that is known as genetic recombination (Scherthan, 2001). Similarly, homologous chromosome association has been observed in somatic cells. Homologous chromosome pairing during interphase has, for instance, been known for many decades for Drosophila (Metz, 1916). Somatic association of homologous chromosomes and/or subchromosomal regions has also been described for different mammalian cell types in different pathophysiological states (Arnoldus et al., 1989; Marschio et al., 1992; Lewis et al., 1993; La Salle and Lalande, 1996; Stout et al., 1999). In radiation biology, the rearrangement of chromosomes and subchromosomal elements like centromeres has been studied in human cell lines after α-irradiation (Aten et al., 2004) and after γ-irradiation of a few Gy (Dolling et al., 1997; Bártová et al., 1999; Jirsová et al., 2001). Two and five hours, respectively, after irradiation, the homologous chromosomes or centromeres are located closer to each other than in the not-irradiated control. Recent findings described association processes after 4-Gy irradiation during the first hour of repair for heterochromatic regions, but not euchromatic regions (Abdel-Halim et al., 2004). These results, in principle, indicated a tendency toward homolog association during repair.
The work presented here is addressed to study whether somatic homolog association is a general feature of human peripheral blood lymphocytes after repair activation induced by strand breaks. In >5000 cell nuclei, homologous locus distances (LL-distances), locus-to-nuclear center distances (LC-distances), and the locus-nuclear center-locus angles of pericentric regions have been determined interactively for different chromosomes and different repair times after H2O2/L-histidine treatment, which is known to induce DNA single- and double-strand breaks (Szumiel et al., 1995), thus activating DNA repair. Assuming that centromere association is a basic effect for the association of whole chromosome territories, homolog association may be an essential effect to correlate two homologous DNA matrices for replication involved in repair activities and recombination.
MATERIALS AND METHODS
Cell preparation
Whole peripheral blood samples from two healthy female donors were taken into 0.5% heparin solution. The lymphocytes were stimulated and cultivated in tissue flasks with chromosome growth medium B, which included phytohemaglutinin (Biochrom, Berlin, Germany) for 78 h at 37°C. To enrich cells in G1/S-phase, they were treated with thymidine (Sigma, St. Louis, MO) at a concentration of 300 μg/ml and incubated for another 16 h. To identify S-phase cells, the cultures were pulse-labeled with bromodeoxyuridine (BrdU). The cells were then centrifuged for 10 min at 200 g and washed once with fresh chromosome growth medium B, and the cells were incubated for 30 min in the presence of BrdU at a concentration 10 μg/ml (Sigma). BrdU incorporation was stopped by centrifugation of the cell suspension at 200 g for 10 min and resuspending the pellet in a hypotonic solution containing 75 mM KCl (Carl Roth, Karlsruhe, Germany). After incubation at 37°C for 30 min and centrifugation at 200 g for 10 min, the cells were fixed either with cold (−20°C) methanol/acetic acid (3:1) according to standard procedures or with formaldehyde (see next paragraph).
H2O2/L-histidine treatment
The cells were treated with H2O2, which is known to induce single-strand DNA breaks (Szumiel et al., 1995). In combination with L-histidine, double-strand breaks are also induced (Sestiti et al., 1995; Hausmann et al., 1998). After BrdU incorporation, the cells were washed with fresh chromosome growth medium B and centrifuged at 200 g for 10 min. Ten milliliters of prewarmed (37°C) PSA (Gibco BRL, Invitrogen, Gaithersburg, MD) was carefully added and mixed into the cell pellet. After centrifugation (200 g for 10 min), the cell pellet was resuspended in 25 ml H2O2 mixture (100 ml PBS + 100 μl H2O2 + 0.0209 g L-histidine resulting in 10 μM H2O2 and 1 mM L-histidine final concentration in PBS; all chemicals from Sigma) for 30 min at 37°C. The pellet was resuspended in 25 ml fresh chromosome growth medium B after centrifugation at 200 g for 10 min and incubated for 15, 30, 60, 120, and 300 min at 37°C. Then the interphase nuclei were isolated as described above.
For each incubation time, an aliquot of the cell nuclei was tested for vitality, apoptosis, or necrosis using a three-color labeling approach. The cells were stained for 30 min at 37°C with 8 μM calcein-blue-atoximethyl-ester (Molecular Probes, Eugene, OR), 1 μM ethidium homodimer (Molecular Probes), and 20 μM AnnexinV (Roche, Basel, Switzerland) in a solution of 10 mM HEPES, pH 7.4 and 5 mM Ca2+Cl2. The cells were scored by fluorescence microscopy (see below) and classified according to the following criteria: cell nuclei with good vitality after the treatment were blue, due to cytosolic esterase activity; cell nuclei having achieved apoptosis were blue-green-labeled on the surface; and necrotic cells showed a combined staining of green and red fluorescence.
Formaldehyde fixation and in situ hybridization
In some cases the cell nuclei were fixed with formaldehyde according to the protocol of Neves et al. (1999). In brief, 100 μl of a cell suspension (∼107 cells/ml) was spread on poly-L-lysine (>300,000 kDa, Sigma)-coated slides and the cells were allowed to attach for 10 min. The cell suspension was carefully overlaid with one volume (100 μl) of 2× fixation buffer (1% Triton X-100, 7.4% formaldehyde freshly prepared from paraformaldehyde, 130 mM PIPES, 60 mM HEPES, 20 mM EGTA, 4 mM MgCl2, pH 6.9). Then the cells were fixed for 15 min at room temperature. The exceeding solution was drained carefully and the cells were washed three times in PBS. After that the cells were permeabilized in 0.7% Triton X-100 in 0.1 M HCl, and diluted in PBS at 4°C for 15 min. The slides were washed again as described above. The RNA was removed by incubation in 0.1 mg/ml RNase A in 2× SSC at 37°C for 30 min. Then the cells were washed once more (three times in PBS) and processed for hybridization.
Fluorescence in situ hybridization and DNA probes
For fluorescence-in-situ hybridization (FISH) commercially available DNA probes (Appligene Oncor, Qbiogene, Illkirch, France) specific for the pericentric regions of chromosomes 1, 15, and X were used. In the case of cells not treated with H2O2/L-histidine, the pericentric regions were labeled with digoxigenin and visualized with rhodamine anti-digoxigenin. In the case of cells treated with H2O2/L-histidine the pericentric regions were labeled with biotin and visualized with FITC avidin.
Briefly: Methanol/acetic acid fixed cell nuclei were denatured by incubation in 70% formamid/2× SSC, pH 7 at 70°C for 2 min and then dehydrated in 70%, 80%, and 95% cold ethanol (−4°C) for 2 min each. Formaldehyde-fixed cell nuclei were denatured in 50% formamid/2× SSC at 75°C for 20 min and quenched in the same solution at 4°C. One-and-one-half microliters of DNA probe were combined with 30 μl Oncor Hybrisol VI and denatured by heating in a water bath at 72°C for 5 min. Thirty microliters of the probe mixture were added to the denatured target, protected with a coverslip, and incubated overnight in a humidified chamber at 37°C. The slides were washed in 0.5× SSC, pH 7, at 72°C for 5 min and cooled down in 1× PBD at RT for 2 min. For the detection of the hybridized sites, 60-μl rhodamine-labeled anti-digoxigenin or 60-μl FITC-labeled avidin, respectively, were applied and incubated under a plastic coverslip for 5 min at 37°C. Then the slides were rinsed three times in 1× PBD for 2 min each. Afterwards the specimen was counterstained with 30 μl DAPI/DABCO/glycerol and sealed with a cover-glass.
S-phase identification
To identify the stimulated cells, BrdU incorporation sites were visualized by fluorochrome-labeled antibodies. In the case of cells not treated with H2O2/L-histidine, 50 μl of a FITC-labeled mouse anti-BrdU antibody (clone BMC 9318, Roche; 1:1000 diluted in 0.9% NaCl, 0.1% Tween 20) were added and incubated for 1 h at 37 C. In the case of cells treated with H2O2/L-histidine, 50 μl (from a 1:1000 dilution with 0.9% NaCl, 0.1% Tween 20) of a mouse anti-BrdU antibody (clone BU-33, Sigma) were added and incubated for 1 h at 37°C. After washing in 1× PBD, 50 μl of a rhodamine-labeled goat anti-mouse antibody (10 μl antibody stock solution + 80 μl of 2% BSA in PBS; Roche) were added and again incubated at room temperature for 15 min. Afterwards the specimen was washed twice in 1× PBD.
All treatments, preparations, and hybridizations have been repeated at least twice for each data point.
Microscopy and image analysis
For two-dimensional microscopy a Zeiss Axioskop fluorescence microscope equipped with a 50-W HBO illumination source, a Plan-Neofluar oil objective 63×/NA 1.25 and appropriate filter settings for DAPI, FITC, and rhodamine (Carl Zeiss, Jena, Germany) excitation and emission were used. The cell nuclei were selected visually by random access. For each color (filter setting) an image was acquired by a sensitive black-and-white charge-coupled device camera (Photometrics, Roper Scientific, Tucson, AZ) so that the complete information of each cell nucleus was obtained by three images. Image acquisition was controlled by a FISH software package (Quips M-FISH, Vysis, Downers Grove, IL) running on a Power MacIntosh computer. For visualization the images were merged by the software and transferred to false colors. The images were exported as 24-bit RGB TIF-files.
Quantitative image evaluation was performed on a PC running under Windows. Using a home-developed macro for Scion Image (Scion, Frederick, MD) each cell nucleus was analyzed interactively. A fitted ellipse was used to measure the major and minor axes as well as the center of the nucleus. The centers of the labeling sites were user-determined by visual inspection of the images on the computer screen. With these input values the projected LL- and LC-distances of the homologous FISH-labeled sites were calculated relative to the nuclear diameter (Fig. 1). In addition, the projected LCL-angles were calculated geometrically. Then the data were further treated using a standard spreadsheet program.
FIGURE 1.
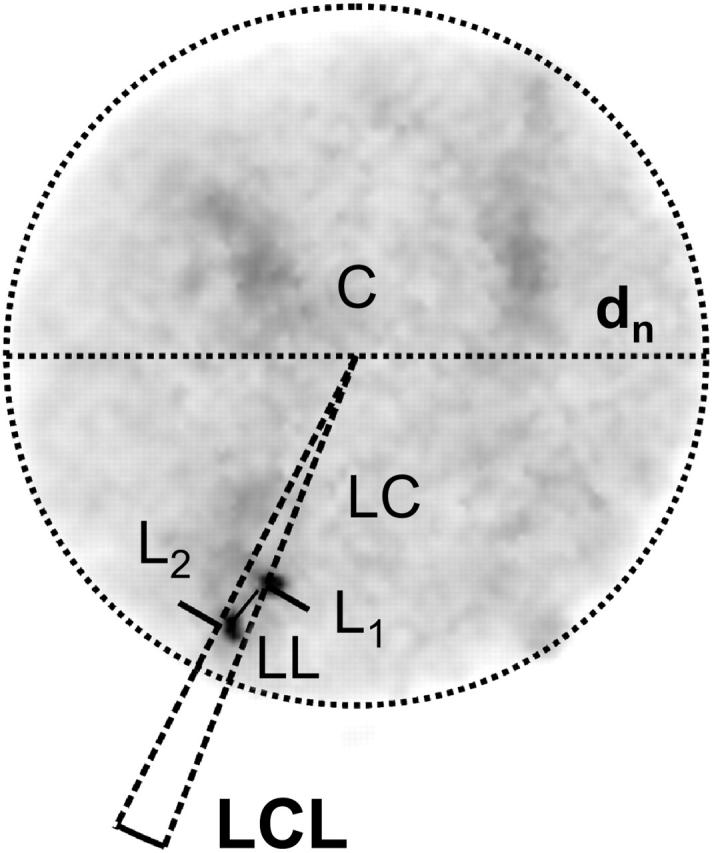
Example of a cell nucleus showing the interactively determined nuclear diameter (dn), the locus distance (LL-distance), the locus-to-nuclear-center distance (LC-distance), and the locus-nuclear center-locus angle (LCL-angle) for quantitative evaluation. Bars (L1; L2) indicate the hybridization signals. C = center of the cell nucleus; dn = diameter of the nucleus. Shading represents the total DNA stained with DAPI, whereas the solid spots indicated with L1 and L2 are the labeled centromeres.
In control experiments, three-dimensional image stacks were acquired using a confocal laser scanning microscope (LSM 510, Carl Zeiss) equipped with an argon ion laser (λ = 488 nm) and a HeNe laser (λ = 546 nm). In these image stacks the three-dimensional distances between homologous FISH-labeled sites and the distances of the FISH-labeled sites to the nuclear center relative to the nuclear diameter were determined interactively using the Zeiss LSM software 3.0, Axiovision 4.2 (Carl Zeiss), and ImageJ.
Estimate of an association criterion for pericentric regions
In the two-dimensional data set all LL-distances of labeled sites from nearly overlapping up to a nearly nuclear diameter were found. These distances were summed up in frequency classes of 0.1 dn (dn = nuclear diameter). All distances ≤0.15 dn were assigned to pericentric regions classified as associated. Larger distances were classified as nonassociated pericentric regions. These classification criteria were not compatible with considerations of a continuous movement of pericentric regions. However, biological aspects of gene loci movements in living cells of ∼2 μm support the definition of closely associated loci within this range (Roix et al., 2003). In addition, considering fluctuations in FISH efficiency and labeling intensity as well as resolution restrictions in microscopy resulted in this value. If one assumed a typical nucleus diameter of 10 μm and a diameter of a pericentric region of 0.5 μm, the association criterion resulted in a center-to-center distance of the labeled sites ≤1.5 μm. Thus the border-to-border distance could be 1 μm, assuming ideal sharp and spherical labeling sites. However, these appeared to be fuzzy. Assuming an effective optical resolution of >0.35 μm (Edelmann et al., 1999) and fluctuations in the FISH efficiency and labeling intensity of ∼20% (Celeda et al., 1994), which has an influence on the segmentation of the labeled site, 1-μm apparent distance between the labeled sites was a reasonable value to use in regard to closely associated pericentric regions. Note, however, that this definition of closely associated pericentric regions is only given to characterize different distance distributions by a handy number (Table 1). This criterion was not used in the statistical analysis (see below).
TABLE 1.
Summarized measurements for the LL-distances, LC-distances, and LCL-angles of homologous pericentric regions under different test conditions
| Quiescent | Stimulated | 15-Min repair | 30-Min repair | 60-Min repair | 120-Min repair | 300-Min repair | |
|---|---|---|---|---|---|---|---|
| Chromosome 1 | |||||||
| Number of nuclei analyzed | 97 | 223 | 158 | 197 | 349 | 310 | 180 |
| Associated centromeres | 17 (17.5%) | 29 (13.0%) | 42 (26.6%) | 94 (47.7%) | 150 (43.0%) | 151 (48.7%) | 48 (26.7%) |
| Nuclei in S-phase | 0 | 110 | 107 | 152 | 270 | 258 | 130 |
| Associated centromeres in S-phase | 0 | 22 (20.0%) | 31 (29.0%) | 82 (53.9%) | 133 (49.3%) | 137 (53.1%) | 43 (33.1%) |
| Mean LL-distance of homologous pericentric regions [dn]+STD | 0.39 ± 0.22 | 0.4 ± 0.2 | 0.28 ± 0.22 | 0.26 ± 0.21 | 0.28 ± 0.22 | 0.26 ± 0.22 | 0.30 ± 0.19 |
| Mean LC-distance of pericentric regions to nuclear center [dn]+STD | 0.32 ± 0.10 | 0.29 ± 0.10 | 0.28 ± 0.09 | 0.26 ± 0.11 | 0.27 ± 0.12 | 0.25 ± 0.09 | 0.26 ± 0.11 |
| Mean LCL-angle of pericentric regions [°] | 77.82 | 73.76 | 54.36 | 49.88 | 65.51 | 60.05 | 66.44 |
| Chromosome 15 | |||||||
| Number of nuclei analyzed | 99 | 387 | 107 | 214 | 295 | 345 | 197 |
| Associated centromeres | 12 (12.1%) | 133 (34.4%) | 58 (54.2%) | 117 (54.6%) | 139 (47.1%) | 150 (43.5%) | 87 (44.2%) |
| Nuclei in S-phase | 0 | 155 | 87 | 187 | 247 | 273 | 165 |
| Associated centromeres in S-phase | 0 | 108 (69.7%) | 50 (57.4%) | 107 (57.2%) | 127 (51.4%) | 132 (48.4%) | 77 (46.7%) |
| Mean LL-distance of homologous pericentric regions [dn]+STD | 0.35 ± 0.17 | 0.3 ± 0.21 | 0.21 ± 0.18 | 0.22 ± 0.2 | 0.24 ± 0.19 | 0.26 ± 0.2 | 0.25 ± 0.19 |
| Mean LC-distance of pericentric regions to nuclear center [dn]+STD | 0.27 ± 0.10 | 0.27 ± 0.10 | 0.27 ± 0.09 | 0.25 ± 0.09 | 0.23 ± 0.09 | 0.24 ± 0.10 | 0.24 ± 0.11 |
| Mean LCL-angle of pericentric regions [°] | 88.03 | 64.71 | 40.21 | 55.59 | 56.90 | 51.12 | 50.66 |
| Chromosome X | |||||||
| Number of nuclei analyzed | 212 | 239 | 133 | 266 | 314 | 470 | 135 |
| Associated centromeres | 26 (12.3%) | 71 (29.7%) | 53 (39.9%) | 110 (41.4%) | 125 (39.8%) | 197 (41.9%) | 58 (42.9%) |
| Nuclei in S-phase | 0 | 143 | 124 | 216 | 253 | 331 | 118 |
| Associated centromeres in S-phase | 0 | 54 (37.8%) | 52 (41.9%) | 101 (46.8%) | 109 (43.1%) | 156 (47.1%) | 50 (42.4%) |
| Mean LL-distance of homologous pericentric regions [dn]+STD | 0.4 ± 0.2 | 0.35 ± 0.24 | 0.28 ± 0.21 | 0.28 ± 0.22 | 0.29 ± 0.23 | 0.21 ± 0.19 | 0.29 ± 0.21 |
| Mean LC-distance of pericentric regions to nuclear center [dn]+STD | 0.31 ± 0.09 | 0.32 ± 0.10 | 0.34 ± 0.10 | 0.27 ± 0.10 | 0.29 ± 0.08 | 0.29 ± 0.09 | 0.31 ± 0.10 |
| Mean LCL-angle of pericentric regions [°] | 90.41 | 68.57 | 55.88 | 59.98 | 65.97 | 67.44 | 58.15 |
Theoretical distribution of distances between three-dimensional random points
To draw conclusions from our microscopic measurements it was considered that all images obtained were only two-dimensional projections of a three dimensional object. Therefore, it was necessary to verify that an increased frequency of a certain distance was not due to this projection effect of randomly distributed distances between labeled sites. Please note that throughout the rest of the article, the term distance denotes two-dimensional projections (LL-distances or LC-distances) of three-dimensional distances.
To generate a theoretical distance distribution we assumed a uniform distribution of points in a three-dimensional ball. This differs from some theoretical calculations in literature that were based on radially dependent point distributions (Jirsová et al., 2001). The series of values for a theoretical distance distribution was simulated using random number generators from Press et al. (1992) for points in the three-dimensional ball. In the following, briefly we describe in a straightforward way how to compute the probability density φ(l) of the projected distance l of two independently uniformly distributed points in the unit 3-ball B(1/2) of radius 1/2 (we choose this radius to normalize the maximal length l to the value of 1). Two random points with coordinates (xi, yi, zi), i = 1,2, are projected parallel to the z axis to their coordinates (xi, yi) in the two-disk D(1/2) of radius 1/2. To each point (x,y) in D(1/2) we assign the non-normalized one-dimensional measure  of the line segment within the 3-ball which is projected onto (x, y). Outside D(1/2) we define
  Then, for a fixed point (x,y) in D(1/2), the total (non-normalized) measure
  of points at projected distance l from (x,y) is
 |
where integration with respect to the curve-length parameter s is performed on the circle C(x,y;l) of radius l with center (x,y).
Now we compute the probability density φ(l) for finding a projected distance l by integrating this measure ν(x,y;l) with the weight μ(x,y) of point (x,y) over D(1/2),
 |
Here, A is the normalizing constant such that  Taking into account the spherical symmetry of the problem, the integrals mentioned were computed numerically using variations of methods as found in Press et al. (1992) and De Boor (1978).
The theoretical three-dimensional lengths distribution Ψ(l) was also calculated analogously integrating sphere surfaces of radius l within B(1/2) for all possible center points yielding a polynomial function. Using this distribution Ψ(l) and an appropriate projection to D(1/2), the integral φ(l) can also be represented analytically (Schmitt and Hausmann, 2002).
The resulting continuous two-dimensional distance frequency curve φ(l) was asymmetrical with a mean value at 0.40 dn and a maximum at ∼0.35 dn. This frequency distribution was transferred to a histogram analogous to the histograms of the experimental data, i.e., integrating in steps of 0.1 dn (Fig. 2). Within the association criterion of 0.15 dn, 9.7% of all distances can be found by assuming a random distribution in a unit 3-ball.
FIGURE 2.

Frequency histogram of projected distances of randomly distributed points in a three-dimensional ball relative to the unit diameter. The individual columns of the histogram represent all values in a range of 0.1 dn each. The frequencies are calculated by numerical simulation (see Materials and Methods).
In addition to LL- and LC-distance distributions, we also investigated the LCL-angle distributions of the homologous-labeled sites. Assuming only radial dependence of the centromere distribution in the three-dimensional ball (M. Cremer et al., 2001; Kozubek et al., 2002) and no angular dependence (rotational symmetry), it is an elementary geometrical observation that the frequency of angle α measured in three dimensions is given by (sin α)/2, and, measured as a projection to a center plane of the circle in two dimensions, is given by the constant function 1/π . For a proof in the first case, consider the volume of the ball sector with opening angle 2α, which describes the proportion of angles smaller than as well as including α, hence defining the value of the distribution function. In the latter case, consider the orange slice with opening angle 2α projected to the two-dimensional center-circle arc-center triangle (e.g., LCL in Fig. 1).
Statistical analysis
The distance and angle frequency distributions were not Gaussian and were calculated on the basis of entities of different sizes. They were, therefore, compared using the ANOVA ranking test with the Kruskal-Wallis one-way analysis of variance on ranks.
In an ANOVA test, a set of distributions is tested against a distinguished reference distribution. The result of the test reveals a test frequency distribution being statistically distinguishable or not from a reference frequency distribution on a certain significance level (in our case p = 0.05 was chosen for a type 1 error). In addition to this yes/no decision, a ranking is given as to which test frequency distributions are more or less likely to be comparable to the reference frequency distribution. This ranking and the classification of significantly different frequency distributions depends on the configuration of the whole set being tested and ranked.
For these reasons, we designed eight different test scenarios. As references for each chromosome type, we chose:
The respective frequency distribution of the stimulated but untreated control (S), which is also regarded as the starting distribution for the repair activation at time t = 0.
The respective frequency distribution of the quiescent (nonstimulated) control (U).
The theoretical frequency distribution (T) obtained from the simulated random distribution.
The sets tested for each chromosome (D) always included the frequency distributions after different repair times of: 15 min (D15), 30 min (D30), 60 min (D60), 120 min (D120), and 300 min (D300). Four tests against S were performed for the combinations {D}, {D,U}, {D,T}, and {D,U,T}. For the reference frequency distribution U, S was always included as the starting distribution at t = 0, resulting in test sets {D,S} and {D,S,T}. Analogously, for T as reference frequency distribution, the test sets are {D,S} and {D,S,U}. The results of such an ensemble of test sets need neither be symmetric nor transitive. However, in our case they are symmetric. We also did not have to include correction for ties, which in our type of measurements are very unlikely to occur, and in fact, did not.
All measurement series were processed by SigmaStat (SPSS, Tucson, AZ) for statistical analysis and the results were transferred to SigmaPlot (SPSS) for further graphic representation.
RESULTS
Lymphocytes were stimulated, enriched in early S-phase by thymidine treatment and the nuclei in S-phase were identified by fluorescence detection of the incorporation sites of BrdU. All cell nuclei analyzed show two FISH spots of two homologous pericentric regions. Typical examples for two-dimensional images in false colors are shown (Fig. 3). The BrdU signal in correlation to the DAPI fluorescence allowed the determination of the amount of cell nuclei in S-phase in this image section. In the merged image, S-phase cell nuclei with closely associated and nonassociated homologous pericentric regions were distinguished. Cell nuclei showing an aberrant morphology were excluded from the evaluation. For aliquots of each preparation, the three-color assay was applied, which revealed ∼10% apoptotic and necrotic cells for short repair times. With increasing repair time this amount decreased.
FIGURE 3.

False color images of cell nuclei of stimulated human lymphocyte after thymidine treatment and BrdU incorporation. The DNA of the nuclei was counterstained with DAPI (a). Pericentric regions of chromosome X were labeled with rhodamine (b). Fluorescence labeling of the BrdU incorporation sites by FITC (c) indicated that from three-to-five nuclei were in S-phase for this image. In the merged image [(d) = (a)+(b)+(c)] the nuclei were classified as 1, G0/G1 cells, associated; 2 and 4, S-phase, associated X-centromeres; 3, S-phase, nonassociated X-centromeres; and 5, G0/G1-cells, nonassociated.
For quantitative evaluation, the two-dimensional images of apparent morphologically intact cell nuclei were visually selected by random access. Between 97 and 470 nuclei were analyzed in each experiment. The relative LL-distances between the pericentric sites were measured to test for chromosome association. The frequency of small LL-distances was highly increased in repair-activated cell nuclei. In addition, a significant increase of associated pericentric regions of chromosomes 15 and X were found in stimulated cell nuclei without H2O2/L-histidine treatment. Nuclei were classified according to the 0.15 dn association criterion into nuclei with closely associated and nonassociated pericentric regions. In Table 1 the results for the three different chromosome types are shown. In all cases the relative amount of cell nuclei fulfilling the association criterion was higher than the expected value for the random distribution of Fig. 2, which was 9.7%. For repair activation, all three chromosome types analyzed showed an increase in centromere association after the first 30 min, followed by a decrease for longer repair times.
The relative frequencies of LL-distances measured in cell nuclei were plotted in frequency histograms of steps of 0.1 dn (Fig. 4) without any further consideration of the association criterion. With the exception of quiescent (nonstimulated) cell nuclei, where the maximum was at ∼0.4 dn, typically the maximum of the frequency histogram was found at small distances. In addition, a smaller increase at ∼0.4 dn was found in some histograms. This was corresponding to the maximum of the simulation (random distribution) histogram. On the significance level of 95% all three distributions of quiescent cell nuclei did not differ from the random distribution.
FIGURE 4.
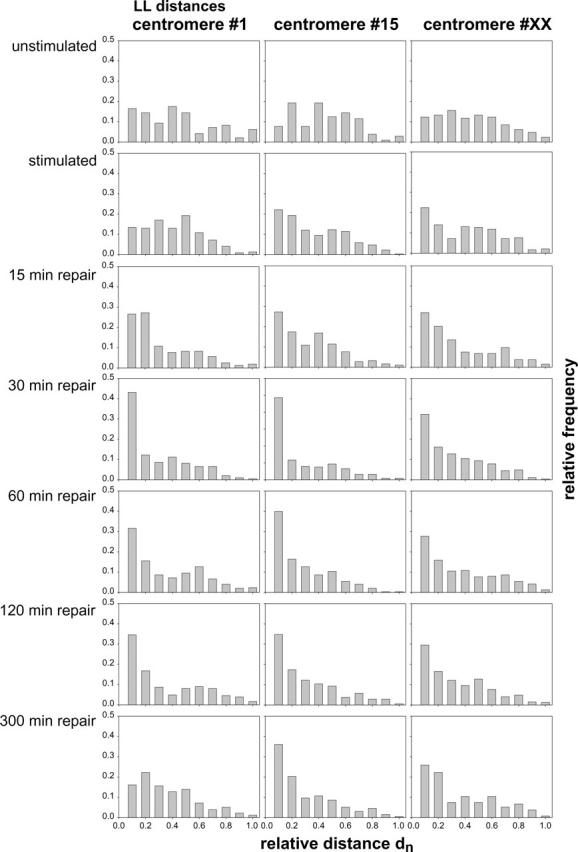
Frequency distributions of LL-distances relative to the diameter of the cell nucleus (dn) for nuclei subjected to the indicated treatments and in the indicated repair states. The individual columns represent the frequency of values in a range of 0.1 dn each.
In Table 2 the results of the significance tests for the histograms in Fig. 4 are shown. For chromosome 1, the results for the three reference distributions S, U, and T are quite reasonable. In all eight tests, whenever a test set containing S, U, or T was examined, they were classified as not distinguishable (p = 0.05). We therefore accept the hypothesis that the stimulated (S) as well as the nonstimulated (U) and the theoretical distributions (T) are equivalent. On the other hand, the distributions D15–D120 never compared to one of these reference distributions, so that we conclude: The frequency distributions for 15-, 30-, and 120-min repair times are always significantly different from S, U, and T. For D300, the result is more complicated. When tested against U, these two distributions are not different (p = 0.05). However, D300 is significantly different to S and T. This shows that the results of an ANOVA test need not be transitive. This reasoning is also motivated by the ranking in the eight ANOVA tests performed for chromosome 1 (data not shown).
TABLE 2.
Results of the ANOVA ranking and significance test
| Chromosome-specific datasets
|
Chromosome 1
|
Chromosome 15
|
Chromosome X
|
||||||||||||||
|---|---|---|---|---|---|---|---|---|---|---|---|---|---|---|---|---|---|
| R | Test set | D300 | S | U | T | D120 | D300 | S | U | T | D300 | S | U | T | |||
| S | D | − | n | n | n | + | + | n | n | n | + | n | n | n | |||
| S | D | U | − | n | + | n | + | + | n | − | n | + | n | − | n | ||
| S | D | T | − | n | n | + | + | + | n | n | − | + | n | n | − | ||
| S | D | U | T | − | n | + | + | + | + | n | − | − | + | n | − | − | |
| U | D | S | + | + | n | n | − | − | − | n | n | − | − | n | n | ||
| U | D | S | T | + | + | n | + | − | − | − | n | + | − | − | n | + | |
| T | D | S | − | + | n | n | − | − | − | n | n | − | − | n | n | ||
| T | D | S | U | − | + | + | n | − | − | − | + | n | − | − | + | n | |
R is the reference frequency distribution chosen against which the test set is compared. D is the set containing the frequency distributions D15, D30, D60, D120, and D300. S is the frequency distribution of the stimulated, not repair-activated cells corresponding to the starting frequency distribution at t = 0. U is the frequency distribution of the quiescent (nonstimulated) cells, and T the theoretical, random frequency distribution. The plus symbol (+) designates that the corresponding distribution is not distinguishable from the reference distribution R. The minus symbol (−) indicates significant difference to reference distribution (p = 0.05). n means not applicable since the corresponding distribution does not appear in the test set. All other members of the test set not mentioned differ significantly from the reference distribution (for details see text).
For chromosome X, the results are straightforward. Here, the symmetric results concerning S, U, and T show that T and U cannot be distinguished, whereas S differs significantly. The results for the four tests against S are also unique, namely D300 is not significantly different from S. All other possible pairs show significant difference. The same reasoning holds for chromosome 15 except for the results concerning the distribution at t = 120. Here, not only D300, but D120, are not significantly different from S.
Significant differences between LL-distance distributions could also be caused by movements of the centromeres toward the center. To test this hypothesis, the LC-distances were measured and represented in frequency histograms (Fig. 5) comparable to Fig. 4. The labeled pericentric regions of the nonstimulated cells are located mainly toward the nuclear periphery. After stimulation the labeled regions were found to be slightly shifted to the nuclear center. For chromosomes 1 and 15 the distributions are almost similar to a uniform distribution, i.e., the labeled regions are located radially independently. During the first 120 min of repair time, the amount of smaller LC-distances increased, which can be interpreted by a movement of the labeled sites toward the center. This movement is then reversed, as can be seen from the frequency distributions at t = 300. Assuming a rotational symmetric distribution of the pericentric regions, the movement toward the nuclear center would lead to an increase of apparently short LL-distances.
FIGURE 5.
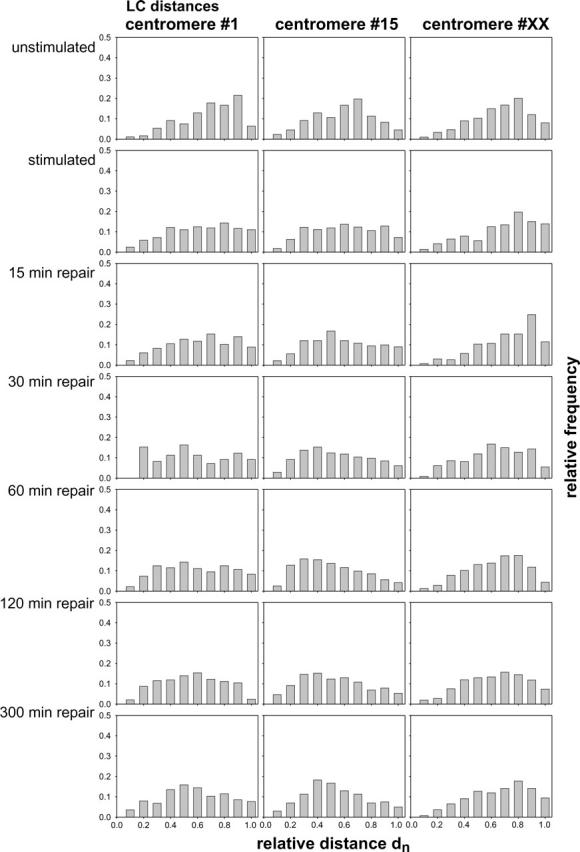
Frequency distributions of LC-distances relative to the diameter of the cell nucleus (dn) for nuclei subjected to the indicated treatments and in the indicated repair states. The individual columns represent the frequency of values in a range of 0.1 dn each.
On the other hand, rotational symmetry would imply uniform LCL-angle distributions (see Materials and Methods). Fig. 6 shows the LCL-angle distribution for all different cases as in Figs. 4 and 5. Uniform LCL-angle distributions were only found for the quiescent cells. In all other cases the frequencies of small angles (0°–10°) are dramatically overrepresented (up to more than sixfold). It should be noted that in all these cases the distributions for the higher angles are closely compatible to the uniform distribution.
FIGURE 6.
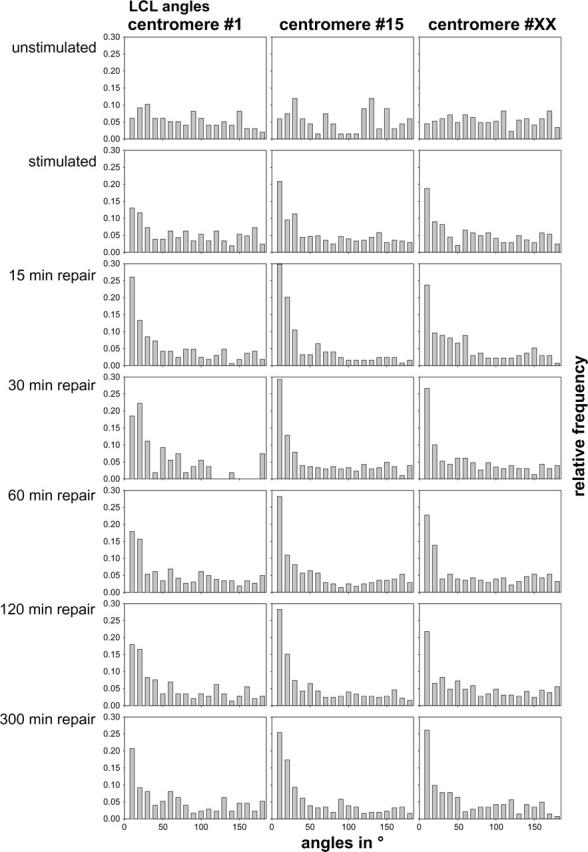
Frequency distributions of LCL-angles for nuclei subjected to the indicated treatments and in the indicated repair states. The individual columns represent the frequency of values in a range of 10° each.
To verify that the apparent association of labeled sites has not occurred artificially due to preparation, the distribution of the pericentric regions was estimated in three-dimensional conserved cell nuclei after formaldehyde fixation by means of imaging by confocal laser scanning microscopy. In total, >300 cells (in two independent experiments) were analyzed. Fig. 7 shows an example of a three-dimensional image stack. In this example two of five cells show associated labeled sites. Since the acquisition time for three-dimensional images is considerably longer than for two-dimensional images, only ∼20 cells were measured per data point and experiment. Stimulated cells were compared to nonstimulated ones. In the three-dimensional image stack the three-dimensional LL-distances as well as the three-dimensional LC-distances were measured. These measurements were normalized to the diameter of the nucleus at the center focal plane. From these data two-dimensional projections were determined and compared to the two-dimensional measurements described above. Table 3 summarizes the results. Within the statistical limits, the two-dimensional projection data are compatible with the two-dimensional results obtained by epifluorescence microscopy. This indicates that the two-dimensional analysis applied above, together with methanol-acetic acid fixation, can be used for the experiments if appropriately large numbers of cell nuclei are analyzed.
FIGURE 7.

Association of pericentric regions shown in optical sections through three-dimensionally preserved cell nuclei. The solid spots are the labeled centromeres #1, visible in a group of five cells. The typical height of the cell nuclei was 6.7 ± 0.5 μm as measured by confocal laser scanning microscopy. BrdU incorporation during S-phase is shown in shading. In this example, according to the 0.15 dn criterion, two of the five nuclei showed associated centromeres (c and d) after measuring the distance in three dimensions by the LSM software 3.0 (Carl Zeiss).
TABLE 3.
Summarized measurements for the three-dimensional LL-distances and three-dimensional LC-distances and their two-dimensional projections of homologous pericentric regions of stimulated and nonstimulated cell nuclei
| Chromosome 1
|
Chromosome 15
|
Chromosome X
|
||||
|---|---|---|---|---|---|---|
| Nonstimulated | Stimulated | Nonstimulated | Stimulated | Nonstimulated | Stimulated | |
| Mean three-dimensional LL-distance of homologous pericentric regions [dn]+STD | 0.51 ± 0.47 | 0.26 ± 0.19 | 0.51 ± 0.35 | 0.45 ± 0.25 | 0.41 ± 0.19 | 0.38 ± 0.21 |
| Mean three-dimensional LC-distance of pericentric regions to nuclear center [dn]+STD | 0.45 ± 0.19 | 0.31 ± 0.15 | 0.40 ± 0.14 | 0.36 ± 0.11 | 0.33 ± 0.11 | 0.30 ± 0.11 |
| Mean of the projected LL-distances of homologous pericentric regions [dn]+STD | 0.38 ± 0.41 | 0.24 ± 0.18 | 0.37 ± 0.31 | 0.31 ± 0.18 | 0.37 ± 0.2 | 0.36 ± 0.22 |
| Mean of the projected LC-distances of homologous pericentric regions [dn]+STD | 0.31 ± 0.17 | 0.26 ± 0.17 | 0.29 ± 0.13 | 0.26 ± 0.10 | 0.30 ± 0.13 | 0.26 ± 0.11 |
Conclusion
These data indicate an increased frequency of associated pericentric regions in the first 2 h of DNA repair. Two-to-five hours after repair activation, this effect disappears and the frequency distribution of LL-distances approaches the distribution of the stimulated control.
DISCUSSION
Knowledge on the association of homologous chromosome elements during the cell cycle indicates large-scale chromatin movements correlated to functional significance. In this article, the association of pericentric regions in stimulated and repair-activated lymphocyte cell nuclei was studied. The results indicate that in contrast to quiescent cells, in stimulated cell nuclei of peripheral blood lymphocytes, pericentric regions of chromosomes 15 and X are not randomly distributed. During repair activation, especially within the first 2–5 h after induction of DNA strand breaks, all analyzed chromosomes appear to be subjected to large-scale movements. Assuming that the association of these pericentric regions reflects whole-chromosome association, which was supported by preliminary investigations using chromosome-arm painting DNA probes (data not shown), the increased frequency of close chromosome association after repair activation may be interpreted as an essential functional effect to obtain a correct sequence matrix for DNA double-strand repair, especially homologous recombination repair.
This interpretation of our data does not contradict recent findings (Abdel-Halim et al., 2004). In this publication a homologous association was only found for a heterochromatic region on chromosome 9 and not for an euchromatic one on chromosome 8 after 4-Gy irradiation. The authors did not compare their result for small bands with the result one would find using FISH painting probes. Moreover, the general conclusion that heterochromatic regions tend toward association after irradiation, supports our findings for the heterochromatic pericentric regions.
Although our results were obtained from fixed specimen, a simple estimate shows the potential movements being required to fulfill the experimental findings. If one assumes that homologous chromosomes are usually arranged in diametrical positions in cell nuclei (Nagele et al., 1999) of a diameter of 10 μm, an average distance of half a nuclear diameter between homologous centromeres (5 μm) seems to be realistic before repair activation. Furthermore, the duration of the repair phase in which chromosome association was observed was ∼5 h. Thus, a velocity of the centromeres for association and separation of 2 μm/h or even more may be estimated. This indicates that large-scale movements of chromosomes at velocities in the range of μm/h may happen in cell nuclei. The driving forces behind such movements, however, are unknown. So far, most studies done by in vivo microscopy suggest only diffusionlike movements of chromosome territories in the interphase (Dundr and Misteli, 2001). However, large-scale movements, especially in cells under genotoxic stress, e.g., by strand-break induction, cannot be excluded (Zink and Cremer, 2003).
At a first glimpse, the results for stimulated lymphocytes in comparison to quiescent cell nuclei appear to contradict results of Ferguson and Ward (1992), which describe the spatial distribution of the centromeric and two telomeric chromosomal domains in fresh human T-lymphocytes after sorting G1-, S-, and G2-phase cell nuclei by flow cytometry. They found dynamic changes of centromere and telomere domains during the cell cycle but did not observe homolog association in S-phase. However, the authors only used a subcentromeric chromosome-1 probe for S-phase analysis, which again agrees well with the findings described here for stimulated versus quiescent cells.
The results also differ from the results of Dolling et al. (1997) and Bártová et al. (1999), both of whom also found homolog association after exposure of the cells to γ-radiation at 5 h after the irradiation. Jirsová et al. (2001) showed a centromere association in the first 2 h after γ-irradiation, which on a first glimpse appears to be compatible to our results of homologous centromere distances. Jirsová et al. (2001), however, were able to explain their findings under the assumption of a radial symmetry model by a mere radial movement of both centromeres to the nuclear center. Such an explanation contradicts our measurements of LCL-angle distributions which clearly indicate that the rotational symmetry during repair cannot be justified. These findings and differences may be explained in such a way that H2O2/L-histidine causes single- and double-strand breaks similar to ionizing radiation, although the cellular reaction may be very different. For instance, the position and duration of cell cycle arrests may be different. Such effects can be also observed for other types of radiation; for instance, α-radiation (Aten et al., 2004) in comparison to γ-radiation.
A methodological argument against our results may be that the process of cell fixation by methanol/acetic acid and dehydration in combination with FISH procedures influences the nucleus architecture and spatial organization, especially on the nanoscaled level of chromosome morphology (Solovei et al., 2002; Winkler et al., 2003), which may also influence the positions of the centromeres. In principle, such effects can be observed since the cell nuclei are flattened. This has an effect on the vertical (z) axis of the nucleus but in practice this should not have a considerable influence on the relative lateral (i.e., two-dimensional projection) distance measurements (Kozubek et al., 2000 and our own measurements shown here), especially for late G1- and S-phases where the centromeres tend to a more peripheral position in the cell nucleus (Weierich et al., 2003). Nevertheless large-scale chromosome movement has been reported to be restricted to M- and early G1-phases in unstressed cells.
Our experimental concept was confirmed by other investigations (van den Engh et al., 1992; Höfers et al., 1993; M. Cremer et al., 2001) in which the results obtained using a two-dimensional approach corresponded to a three-dimensional analysis carried out by confocal microscopy. Also, an observation of nuclear-center-to-centromere distances for chromosome 3 did not lead to considerable differences for methanol/acetic acid fixation in comparison to formaldehyde fixation (Lukášová et al., 1999). Moreover, the increase of distance frequencies at 0.4 dn in our experimental data in comparison to the theoretical distribution confirmed that the cell nuclei can still be seen as three-dimensional ball-like objects.
The results presented here show an easy, straightforward procedure to statistically analyze cell nuclei according to dynamic effects of chromosome rearrangements without having to resort to complex in vivo imaging and three-dimensional analysis procedures. The data cannot be used to describe information of a single-cell behavior, but can be interpreted for principle effects in functional nuclear organization of chromosome territories.
So far, all these conclusions are drawn from centromere results and not from results obtained by chromosome painting or a pattern of genome regions along a chromosome arm. The centromere association may also be interpreted as an intrachromosomal rearrangement, if the chromosome territories are juxtapositioned in direct neighborhood. However, there is no direct evidence that the chromosome territories are so extended in size that they would fulfill all measured centromere distances by intrachromosomal rearrangements. Moreover, it has been shown that the centromeres can be used to describe the chromosomal positioning in the cell nucleus (Sun et al., 2000).
In conclusion, the results presented here support the assumption that association accompanied by large-scale movement of homologous chromosomes is a general feature of double-strand, repair-activated human lymphocytes. So far, the driving forces for such large-scale movements are not known. One might speculate that the genome uses this effect to colocalize the maternal and paternal DNA matrix within a nuclear subvolume and to compare the genomic content of homologous regions. Since H2O2/L-histidine is known to induce single- and double-strand breaks the cell may use the second homolog as a template for repair. The assumption of active association of chromosomes is supported by chromosomal S-phase association of imprinted genome regions like the Prader-Willi/Angelmann region (La Salle and Lalande, 1996). To control the genetic activity of these regions, a comparison and replication of the methylation pattern appears to be necessary. This might be much easier if the corresponding genome regions are spatially colocalized.
In the analysis presented here, the association of pericentric regions of three selected chromosomes is described. These chromosomes differ considerably either in EST-density (density of expressed sequence tags) or in their size/DNA content to obtain examples for different radial positioning (Kozubek et al., 2002). Further progress with respect to questions of repair activity and genetic activity can be made if not just centromeres, but also typical breakpoint regions such as abl on chromosome 9 or bcr on chromosome 22, are studied—which can be the task of future investigations. Therefore the association of chromosome arms as described by Lewis et al. (1993) might be a general phenomenon in cycling cells, and not restricted to the pathophysiological state.
Acknowledgments
The authors thank the volunteer blood donors.
This work was supported by Fond der Chemischen Industrie grant No. 161971 and Bundesministerium für Bildung und Forschung (BMBF) grant No. 13N7506/6.
S. Monajembashi, A. Rapp, and E. Schmitt contributed equally to this article.
References
- Abdel-Halim, H. I., S. A. Imam, F. M. Badr, A. T. Natarajan, L. H. F. Mullenders, and J. J. W. A. Boei. 2004. Ionizing radiation-induced instant pairing of heterochromatin of homologous chromosomes in human cells. Cytogenet. Genome Res. 104:193–199. [DOI] [PubMed] [Google Scholar]
- Amrichová, J., E. Lukásová, S. Kozubek, and M. Kozubek. 2003. Nuclear and territorial topography of chromosome telomeres in human lymphocytes. Exp. Cell Res. 289:11–26. [DOI] [PubMed] [Google Scholar]
- Arnoldus, E. P. J., A. C. B. Peters, G. T. A. Bots, A. K. Raap, and M. van der Ploeg. 1989. Somatic pairing of chromosome 1 centromeres in interphase nuclei of human cerebellum. Hum. Genet. 83:231–234. [DOI] [PubMed] [Google Scholar]
- Aten, J. A., J. Stap, P. M. Krawczyk, C. H. van Oven, R. A. Hoebe, J. Essers, and R. Kanaar. 2004. Dynamics of DNA double-strand breaks revealed by clustering of damaged chromosome domains. Science. 303:92–95. [DOI] [PubMed] [Google Scholar]
- Bártová, E., S. Kozubek, M. Durm, M. Hausmann, M. Kozubek, E. Lukášová, M. Skalniková, P. Jirsová, A. Cafourková, and K. Buchničková. 1999. The position of centromeres in the interphase nuclei of human leukemic cells during myeloid differentiation and after γ-irradiation. In Fluorescence Microscopy and Fluorescent Probes, Vol. 3. A. Kotyk, editor. Espero Publishing, Ustí Nad Labem, Czech Republic.
- Bártová, E., S. Kozubek, P. Jirsová, M. Kozubek, H. Gajová, E. Lukásová, M. Skalníková, A. Ganová, I. Koutná, and M. Hausmann. 2002. Nuclear structure and gene activity in human differentiated cells. J. Struct. Biol. 139:76–89. [DOI] [PubMed] [Google Scholar]
- Boyle, S., S. Gilchrist, J. M. Bridger, N. L. Mahy, J. A. Ellis, and W. A. Bickmore. 2001. The spatial organization of human chromosomes within the nuclei of normal and emerin-mutant cells. Hum. Mol. Genet. 10:211–219. [DOI] [PubMed] [Google Scholar]
- Celeda, D., K. Aldinger, F. M. Haar, M. Hausmann, H. Ludwig, and C. Cremer. 1994. Rapid fluorescence in situ hybridization with repetitive DNA probes: quantification by digital image analysis. Cytometry. 17:13–25. [DOI] [PubMed] [Google Scholar]
- Cremer, C., C. Münkel, M. Granzow, A. Jauch, S. Dietzel, R. Eils, X. Y. Guan, P. S. Meltzer, J. M. Trent, J. Langowski, and T. Cremer. 1996. Nuclear architecture and the induction of chromosomal aberrations. Mutagen. Res. 366:97–116. [DOI] [PubMed] [Google Scholar]
- Cremer, M., K. Küpper, B. Wagler, L. Wizelman, J. von Hase, Y. Weiland, L. Kreja, J. Diebold, M. R. Speicher, and T. Cremer. 2003. Inheritance of gene density-related higher order chromatin arrangements in normal and tumor cell nuclei. J. Cell Biol. 162:809–820. [DOI] [PMC free article] [PubMed] [Google Scholar]
- Cremer, M., J. von Hase, T. Volm, A. Brero, G. Kreth, J. Walter, C. Fischer, I. Solovei, C. Cremer, and T. Cremer. 2001. Non-random radial higher-order chromatin arrangements in nuclei of diploid human cells. Chromos. Res. 9:541–567. [DOI] [PubMed] [Google Scholar]
- Cremer, T., A. Kurz, R. Zirbel, S. Dietzel, B. Rinke, E. Schröck, M. R. Speicher, U. Mathieu, A. Jauch, P. Emmerich, and C. Cremer. 1993. Role of chromosome territories in the functional compartmentalization of the cell nucleus. Cold Spring Harb. Symp. Quant. Biol. 58:777–791. [DOI] [PubMed] [Google Scholar]
- Cremer, T., G. Kreth, H. Koester, R. H. A. Fink, R. Heintzmann, M. Cremer, I. Solovei, D. Zink, and C. Cremer. 2000. Chromosome territories, interchromatin domain compartment, and nuclear matrix: an integrated view of the functional nuclear architecture. Crit. Rev. Eukaryot. Gene Expr. 12:179–212. [PubMed] [Google Scholar]
- Cremer, T., and C. Cremer. 2001. Chromosome territories, nuclear architecture and gene regulation in mammalian cells. Nat. Genet. 2:292–301. [DOI] [PubMed] [Google Scholar]
- De Boor, C. 1978. A Practical Guide to Splines. Springer, NY.
- Dolling, J. A., D. R. Boreham, D. L. Brown, G. P. Raaphorst, and R. E. J. Mitchel. 1997. Rearrangement of human cell homologous chromosome domains in response to ionizing radiation. Int. J. Radiat. Biol. 72:303–311. [DOI] [PubMed] [Google Scholar]
- Dundr, M., and T. Misteli. 2001. Functional architecture in the cell nucleus. Biochem. J. 356:297–310. [DOI] [PMC free article] [PubMed] [Google Scholar]
- Edelmann, P., A. Esa, M. Hausmann, and C. Cremer. 1999. Confocal laser scanning fluorescence microscopy: in situ determination of the confocal point-spread function and the chromatic shifts in intact cell nuclei. Optik. 110:194–198. [Google Scholar]
- Edelmann, P., H. Bornfleth, D. Zink, T. Cremer, and C. Cremer. 2001. Morphology and dynamics of chromosome territories in living cells. Biochim. Biophys. Acta. 1551:M29–M39. [DOI] [PubMed] [Google Scholar]
- Falk, M., E. Lukásová, S. Kozubek, and M. Kozubek. 2002. Topography of genetic elements of X-chromosome relative to the cell nucleus and to the chromosome X territory determined for human lymphocytes. Gene. 292:13–24. [DOI] [PubMed] [Google Scholar]
- Ferguson, M., and D. C. Ward. 1992. Cell-cycle-dependent chromosomal movement in pre-meiotic human T-lymphocyte nuclei. Chromosoma. 101:557–565. [DOI] [PubMed] [Google Scholar]
- Gasser, S. M. 2002. Visualizing chromatin dynamics in interphase nuclei. Science. 296:1412–1416. [DOI] [PubMed] [Google Scholar]
- Gerlich, D., J. Beaudouin, B. Kalbfuss, N. Daigle, R. Eils, and J. Ellenberg. 2003. Global chromosome positions are transmitted through mitosis in mammalian cells. Cell. 112:751–764. [DOI] [PubMed] [Google Scholar]
- Hausmann, M., H. Lentfer, D. Wolf, E. Bauer, K. Aldinger, K. O. Greulich, and C. Cremer. 1998. Biological dosimetry after H2O2/L-histidine treatment. Proc. SPIE. 3199:183–190. [Google Scholar]
- Höfers, C., P. Baumann, G. Hummer, T. M. Jovin, and D. J. Arndt-Jovin. 1993. The localisation of chromosome domains in interphase nuclei. Three-dimensional distance determination of fluorescence in situ hybridization signals from confocal laser scanning microscopy. Bioimaging. 1:96–106. [Google Scholar]
- Jirsová, P., S. Kozubek, E. Bartova, M. Kozubek, E. Lukasova, A. Cafourkova, I. Koutna, and M. Skalonikova. 2001. Spatial distribution of selected genetic loci in nuclei of human leukemia cells after irradiation. Rad. Res. 155:311–319. [DOI] [PubMed] [Google Scholar]
- Kozubek, S., E. Lukasova, J. Amrichova, M. Kozubek, A. Liskova, and J. Slotova. 2000. Influence of cell fixation on chromatin topography. Anal. Biochem. 282:29–38. [DOI] [PubMed] [Google Scholar]
- Kozubek, S., E. Lukásová, P. Jirsová, I. Koutná, M. Kozubek, A. Ganová, E. Bártová, M. Falk, and R. Paseková. 2002. 3D structure of the human genome: order in randomness. Chromosoma. 111:321–331. [DOI] [PubMed] [Google Scholar]
- Kreth, G., J. Finsterle, J. von Hase, M. Cremer, and C. Cremer. 2004. Radial arrangement of chromosome territories in human cell nuclei: a computer model approach based on gene density indicated a probabilistic global positioning code. Biophys. J. 86:2803–2812. [DOI] [PMC free article] [PubMed] [Google Scholar]
- La Salle, J., and M. Lalande. 1996. Homologous association of oppositely imprinted chromosomal domains. Science. 272:725–728. [DOI] [PubMed] [Google Scholar]
- Lewis, J. P., H. J. Tanke, A. K. Raap, G. C. Beverstock, and H. C. Kluin-Nelemans. 1993. Somatic pairing of centromeres and short arms of chromosome 15 in the hematopoietic and lymphoid system. Hum. Genet. 92:577–582. [DOI] [PubMed] [Google Scholar]
- Lewis, J. P., H. J. Tanke, A. K. Raap, R. E. Kibbelaar, H. C. Kluin-Nelemans, and G. C. Beverstock. 1993. Hairy cell Leukemia: an interphase cytogenetic study. Leukemia. 7:1334–1338. [PubMed] [Google Scholar]
- Lukášová, E., S. Kozubek, M. Kozubek, J. Kjeronská, L. Rýznar, J. Horáková, E. Krahulcová, and G. Horneck. 1999. Localisation and distance between ABL and BCR genes in interphase nuclei of bone marrow cells of control donors and patients with chronic myeloid leukaemia. Hum. Genet. 100:525–535. [DOI] [PubMed] [Google Scholar]
- Lukásová, E., S. Kozubek, M. Kozubek, M. Falk, and J. Amrichová. 2002. The 3D structure of human chromosomes in cell nuclei. Chromos. Res. 10:535–548. [DOI] [PubMed] [Google Scholar]
- Marschio, P., M. Cortinovis, E. Dainotti, R. Tupler, and L. Tiepolo. 1992. Interphase cytogenetics of the ICF syndrome. Ann. Hum. Genet. 56:273–278. [DOI] [PubMed] [Google Scholar]
- Marshall, W. F. 2002. Order and disorder in the cell nucleus. Curr. Biol. 12:R185–R192. [DOI] [PubMed] [Google Scholar]
- Metz, C. W. 1916. Chromosome studies in Diptera. II. The paired association of chromosomes in the Diptera and its significance. J. Exp. Zool. 21:213–280. [Google Scholar]
- Nagele, R. G., T. Freeman, L. McMorrow, Z. Thomson, K. Kitson-Wind, and H. Lee. 1999. Chromosomes exhibit preferential positioning in nuclei of quiescent human cells. J. Cell Sci. 112:525–535. [DOI] [PubMed] [Google Scholar]
- Neves, H., C. Ramos, M. G. da Silva, A. Parreira, and L. Parreira. 1999. The nuclear topography of ABL, BCR, PML, and RARα genes: evidence for gene proximity in specific phases of the cell cycle and stages of hematopoietic differentiation. Blood. 93:1197–1207. [PubMed] [Google Scholar]
- Parada, L. A., and T. Misteli. 2002. Chromosome positioning in the interphase nucleus. Trends Cell Biol. 12:425–432. [DOI] [PubMed] [Google Scholar]
- Parada, L. A., S. Sotiriou, and T. Misteli. 2004. Spatial genome organization. Exp. Cell Res. 296:64–70. [DOI] [PubMed] [Google Scholar]
- Press, W. H., S. A. Teukolsky, W. T. Vetterling, and B. P. Flannery. 1992. Numerical Recipes in C, 2nd Ed. Cambridge University Press, Cambridge, UK.
- Roix, J. J., P. G. McQueen, P. J. Munson, L. A. Parada, and T. Misteli. 2003. Spatial proximity of translocation-prone gene loci in human lymphocytes. Nat. Genet. 34:287–291. [DOI] [PubMed] [Google Scholar]
- Scherthan, H. 2001. A bouquet makes ends meet. Nat. Rev. Mol. Cell Biol. 2:621–627. [DOI] [PubMed] [Google Scholar]
- Schmitt, E., and M. Hausmann. 2002. Analytical representation and approximation of distance distributions of independently distributed points in cell-like objects. 15th Heidelberg Cytometry Symposium.
- Sestiti, P., O. Cantoni, F. Cattabuni, and D. Murray. 1995. Evidence for separated mechanisms of cytotoxicity in mammalian cells treated with hydrogene peroxide in the absence or presence of L-histidine. Biochim. Biophys. Acta. 1268:130–136. [DOI] [PubMed] [Google Scholar]
- Solovei, I., A. Cavallo, L. Schermelleh, F. Jaunin, C. Scasselati, D. Cmarko, C. Cremer, S. Fakan, and T. Cremer. 2002. Spatial preservation of nuclear chromatin architecture during three-dimensional fluorescence in situ hybridization (3D-FISH). Exp. Cell Res. 276:10–23. [DOI] [PubMed] [Google Scholar]
- Stout, K., S. van der Maarel, R. R. Frants, G. W. Padberg, H. H. Ropers, and T. Haaf. 1999. Somatic pairing between subtelomeric chromosome regions: implications for human genetic disease? Chromosome Res. 7:323–329. [DOI] [PubMed] [Google Scholar]
- Sun, H. B., J. Shen, and H. Yokota. 2000. Size-dependent positioning of human chromosomes in interphase nuclei. Biophys. J. 79:184–190. [DOI] [PMC free article] [PubMed] [Google Scholar]
- Szumiel, I., M. Kapiszewska, M. Kruszewski, T. Twanenko, and C. S. Lange. 1995. Content of iron and copper in the nuclei and induction of pH 9-labile lesions in L5178Y sub-lines inversely cross-sensitive to H2O2 and x-rays. Radiat. Environ. Biophys. 34:110–113. [DOI] [PubMed] [Google Scholar]
- Tanabe, H., F. A. Habermann, I. Solovei, M. Cremer, and T. Cremer. 2002. Non-random radial arrangements of interphase chromosome territories: evolutionary considerations and functional implications. Mutat. Res. 504:37–45. [DOI] [PubMed] [Google Scholar]
- Taslerová, R., S. Kozubek, E. Lukásová, P. Jirsová, E. Bartová, and M. Kozubek. 2003. Arrangement of chromosome 11 and 22 territories, EWSR1 and FLI1 genes, and other genetic elements of these chromosomes in human lymphocytes and Ewing sarcoma cells. Hum. Genet. 112:143–155. [DOI] [PubMed] [Google Scholar]
- van den Engh, G., R. Sachs, and B. J. Trask. 1992. Estimating genomic distance from DNA sequence location in cell nuclei by a random walk model. Science. 257:1410–1412. [DOI] [PubMed] [Google Scholar]
- Volpi, E. V., E. Chevret, T. Jones, R. Vatcheva, J. Williamson, S. Beck, R. D. Campbell, M. Goldworthy, S. H. Powis, J. Ragoussis, J. Trowsdale, and D. Sheer. 2000. Large-scale chromatin organization of the major histocompatibility complex and other regions of human chromosome 6 and its response to interferon in interphase nuclei. J. Cell Sci. 113:1565–1576. [DOI] [PubMed] [Google Scholar]
- Walter, J., L. Schermelleh, M. Cremer, S. Tashiro, and T. Cremer. 2003. Chromosome order in HeLa cells changes during mitosis and early G1, but is stably maintained during subsequent interphase stages. J. Cell Biol. 160:685–697. [DOI] [PMC free article] [PubMed] [Google Scholar]
- Weierich, C., A. Brero, S. Stein, J. von Hase, C. Cremer, T. Cremer, and I. Solovei. 2003. Three-dimensional arrangements of centromeres and telomeres in nuclei of human and murine lymphocytes. Chromos. Res. 11:485–502. [DOI] [PubMed] [Google Scholar]
- Winkler, R., B. Perner, A. Rapp, M. Durm, C. Cremer, K. O. Greulich, and M. Hausmann. 2003. Labelling quality and chromosome morphology after low temperature FISH analyzed by scanning far-field and scanning near-field optical microscopy. J. Microsc. 209:23–33. [DOI] [PubMed] [Google Scholar]
- Zink, D., and T. Cremer. 2003. Chromosome dynamics in nuclei of living cells. Curr. Biol. 8:R321–R324. [DOI] [PubMed] [Google Scholar]