

Abstract
Using Brownian dynamics simulations, all of the charged residues in Chlamydomonas reinhardtii cytochrome c6 (cyt c6) and plastocyanin (PC) were mutated to alanine and their interactions with cytochrome f (cyt f) were modeled. Systematic mutation of charged residues on both PC and cyt c6 confirmed that electrostatic interactions (at least in vitro) play an important role in bringing these proteins sufficiently close to cyt f to allow hydrophobic and van der Waals interactions to form the final electron transfer-active complex. The charged residue mutants on PC and cyt c6 displayed similar inhibition classes. Our results indicate a difference between the two acidic clusters on PC. Mutations D44A and E43A of the lower cluster showed greater inhibition than do any of the mutations of the upper cluster residues. Replacement of acidic residues on cyt c6 that correspond to the PC's lower cluster, particularly E70 and E69, was observed to be more inhibitory than those corresponding to the upper cluster. In PC residues D42, E43, D44, D53, D59, D61, and E85, and in cyt c6 residues D2, E54, K57, D65, R66, E70, E71, and the heme had significant electrostatic contacts with cyt f charged residues. PC and cyt c6 showed different binding sites and orientations on cyt f. As there are no experimental cyt c6 mutation data available for algae, our results could serve as a good guide for future experimental work on this protein. The comparison between computational values and the available experimental data (for PC-cyt f interactions) showed overall good agreement, which supports the predictive power of Brownian dynamics simulations in mutagenesis studies.
INTRODUCTION
The cytochrome b6f complex is a dimeric membrane protein complex, which is one of the three major redox enzyme complexes residing in the thylakoid membrane (Kurisu et al., 2003; Stroebel et al., 2003). Electrons pass through this complex from Photosystem II to Photosystem I. Cytochrome f (cyt f) is one of the four subunits of this complex, where plastocyanin (PC) or cytochrome c6 (cyt c6) binds to receive the electron and carry it to the Photosystem I complex (Hope, 2000; Gross and Pearson, 2003). The Chlamydomonas reinhardtii system is a good model for studying electron transfer among these proteins, as C. reinhardtii cyt f interacts with both PC and cyt c6 and the tertiary structures for all of these proteins are available.
PC is an 11-kd “blue” copper β-sheet protein and has two clusters of negatively charged residues: upper and lower (Redinbo et al., 1993; Gross, 1996, 2004 Sigfridsson, 1998; Hope, 2000). The upper cluster consists of residues 59–61, but it should be noted that PCs from all algae and some species of higher plants have a two-residue deletion in this region. For example, C. reinhardtii PC has only two negatively charged residues at positions 59 and 61, but there is a third negatively charged residue at position 85. The lower cluster consists of residues 42–44 and either 45 or 79, which are conserved in all higher plants and green algal PCs. Close to these clusters, there is also another negative group, D53. Fig. 1 shows that these eight anionic residues produce a large negative electrostatic field in PC (Durell et al., 1990).
FIGURE 1.

Electrostatic fields of oxidized C. reinhardtii PC and cyt c6. The electrostatic field contours at +1  (blue) and −1
  (red) were calculated at 10 mM ionic strength, pH 7.0. The electrostatic residues that came into close contact with charged residues on cyt f are shown on each protein (Table 3). The PC-E79, cyt c6-D41, and cyt c6-E69 are shown in yellow (these did not have significant contacts in Table 3, but were important in the formation of electrostatic fields). The orientations of the proteins are the same as in Figs. 4 A and 6 A, in which they are shown in a complex with cyt f.
Cyt c6 is only present in some algae and cyanobacteria (Kerfeld and Krogmann, 1998), although a cyt c6-like protein in a higher plant (Arabidopsis) has been recently reported (Gupta et al., 2002). Cyt c6 from C. reinhardtii is a 10-kd α-helical heme protein with no sequence homology to PC (Merchant and Bogorad, 1986; Kerfeld et al., 1995; Gross and Pearson, 2003). Nonetheless, both of these proteins have a similar pattern of negatively charged residues on their surfaces, resulting in very similar electrostatic potentials (Fig. 1). According to Ullmann et al. (1997a), residues E47, D41, and E54 on cyt c6 correspond to D53, D59–D61, and E85 on PC (the upper cluster), respectively. Glutamates 69–71 on cyt c6 correspond to the negative residues of the lower negative cluster of PC (D42, E43, and D44; Ullmann et al., 1997a).
Cyt f is a 33-kd β-sheet protein consisting of two domains (Martinez et al., 1994, 1996; Chi et al., 2000). The larger of the two domains binds the heme, which is surrounded by several hydrophobic residues. Five lysine residues in C. reinhardtii cyt f—K58, K65, K66, K188, and K189—contribute to a positive electrostatic field that is believed to attract negative charges on PC or cyt c6 (Pearson et al., 1996; Gross and Pearson, 2003).
Experimental data supports the electrostatic nature of the interactions of cyt f with PC. These in vitro studies include: identification of a positive group on cyt f that interacts with a negative group on PC via chemical cross-linkage (K187 on turnip cyt f was linked to D44 on spinach PC (Morand et al., 1989)); chemical replacement of positively charged amino groups on cyt f with negatively charged carboxyl groups (Takenaka and Takabe, 1984; Takabe et al., 1986), in which the rate of electron transfer to PC decreased by ∼50% upon the modification of each amino group; chemical modification of negatively charged residues on PC (Takabe et al., 1984; Anderson et al., 1987), which resulted in slower electron transfer rates from cyt f to PC; increasing the salt concentrations that decreased the electron transfer rates (Niwa et al., 1980; Qin and Kostic, 1993; Meyer et al., 1993); mutations of negatively charged residues on PC (Lee et al., 1995; Kannt et al., 1996; Gong et al., 2000) and positively charged residues on cyt f (Soriano et al., 1998), which inhibited electron transfer; and a PC-cyt f complex determined by NMR (Ubbink et al., 1998; Ejdeback et al., 2000) that showed the involvement of charged residues in the interactions.
Computational modeling has also pointed toward the electrostatic interactions of PC or cyt c6 with cyt f (Pearson et al., 1996, 1998; Ullman et al., 1997b; Nelson et al., 1999; De Rienzo et al., 2001; Gross and Pearson, 2003; Gross, 2004). However, experimental works by Soriano et al. (1996) and Zhou et al. (1996) showed much smaller electrostatic interactions between cyt f and PC in vivo in C. reinhardtii.
One of the best ways to study the effect of electrostatic forces on the interactions between cyt f and PC or cyt c6 is the mutation of charged residues. In this work, we have used Brownian dynamics (BD) simulations to mutate all of the charged residues on both C. reinhardtii PC and cyt c6 to alanine and studied their effect on the interactions with C. reinhardtii cyt f. In BD simulations (Northrup et al., 1987a,b, 1988; Northrup, 1999), a mobile diffusing molecule, such as PC or cyt c6, is allowed to dock with a target molecule, such as cyt f, under the influence of an electrostatic field plus random Brownian motions. BD simulations provide two important pieces of information (among many others): 1), the rate at which two proteins interact with each other; and 2), the structure of the complexes formed.
Experimental data are available for PC charge residue mutants interacting with cyt f (Lee et al., 1995; Kannt et al., 1996; Gong et al., 2000). However, there are no single charge-change mutants for the upper cluster, and no mutations of cationic residues on PC. Also, there is only one mutation of PC charged residues outside the two clusters. Furthermore, there are no experimental data for the interactions of cyt f with mutant cyt c6, in algae. We have modeled all of the experimental charged residue mutations, plus others, and have compared our results with the experimental values. De Rienzo et al. (2001) have also modeled the experimental data, which concentrated on the interactions of cyt f with wild-type PC and the seven mutants from Kannt et al., 1996.
The cyt f-PC and cyt f-cyt c6 interactions have been addressed previously by a variety of simulation methods. Both manual docking (Pearson et al., 1996) and BD simulations (Pearson and Gross, 1998) have been used to determine the structure of complexes formed at the closest approach of poplar PC and turnip cyt f. A combination of Monte Carlo and molecular dynamics simulations has been used by Ullmann et al. (1997b) to dock French bean PC on turnip cyt f. Gross and Pearson (2003) have used BD simulations to determine the structure of complexes formed and to identify the important residues on cyt f in both the cyt f-PC and cyt f-cyt c6 interactions in the C. reinhardtii system. Gross (2004) studied the cyt f-PC interactions in cyanobacteria.
In this work, we have further refined the binding sites of cyt f for both PC and cyt c6; we have identified the important residues on PC and cyt c6 that interact with cyt f; and also showed that the electrostatic forces play an important role in the interactions (at least in vitro). Some of the mutations of positive residues on both PC and cyt c6 showed a significant stimulation in binding and interaction rates; these may be useful in cocrystallization of cyt f-PC or cyt f-cyt c6 complexes for further structural studies. The significance of this work is that for the first time we have performed systematic charge mutations on both PC and cyt c6 interacting with cyt f from the same species and examined the effectiveness of each charged residue in the interactions. As there are no experimental cyt c6 mutation data available for alga, our results could serve as a good guide for future experimental work on this protein.
METHODS
Molecular structures
The 3D structures for C. reinhardtii cyt f, PC, and cyt c6 were obtained from the Protein Data Bank (PDB) (http://www.rcsb.org/pdb/; Berman et al., 2000). The cyt f used is the PDB code of 1CFM (Chi et al., 2000). The PC structure is PDB code 2PLT (Redinbo et al., 1993) and the cyt c6 used is PDB code 1CYJ (Kerfeld et al., 1995). The residue numbering that we have used in this work is that of the PDB (in which PC starts with residue zero (D0)). The structures of the mutant PCs and cyt c6s were generated using the BD simulation program MacroDox (Northrup et al., 1987a,b, 1988; Northrup, 1999), which simply substitutes one residue for another without any energy minimization, keeping the orientation of the side chains unchanged. It should be mentioned that there are three different cyt f molecules in the unit cell of the crystal structure. Among these, structure B interacted the best with wild-type PC and structure C with wild-type c6 (our unpublished results). Considering this, we used structure B of C. reinhardtii cyt f in modeling the interactions with mutant PCs and structure C of the cyt f in modeling the interactions with mutant cyt c6s.
Molecular representations
All molecular representations were made using the program GRASP (Nicholls and Honig, 1991). The electrostatic fields depicted in Fig. 1 were also calculated using GRASP. The internal and external dielectric constants of the proteins were 4 and 78, respectively. The ionic strength was 10 mM and the pH was 7.0.
Brownian dynamics simulations
The simulations were carried out using the program MacroDox v. 3.2.1 (http://pirn.chem.tntech.edu/macrodox.html) exactly as described in detail by Gross and Pearson (2003). Typically, five sets of 10,000 trajectories at 10 mM ionic strength and pH 7 were carried out (to obtain and minimize the error values in the simulations). At 100 mM ionic strength, the electrostatic interactions are weaker. Therefore, to obtain a similar number of reaction events under these conditions as for the 10-mM runs, five sets of 50,000 trajectories were carried out.
The equation of the motion used in BD algorithm for each trajectory is the Ermark-McCammon equation (Ermark and McCammon, 1978):
 |
(1) |
where  and
and  are the final and initial distances, respectively, between the center of mass of the mobile molecule (PC or cyt c6) and the center of mass of the target molecule (cyt f) before and after a time step of
  ; β = (kT)−1; D is the relative diffusion coefficient of the two molecules;
  is the external force on the mobile molecule at
  ; and R is a random (Brownian) vector with the following properties (McCammon and Harvey, 1987; Harvey, 1989):
 |
(2) |
 should be sufficiently small so that there is a minimal change in the external force (i.e.,
  ). For each trajectory, the center of mass of the mobile molecule is positioned on the surface of a sphere of radius 90 Å, centered at the center of the mass of the target molecule as shown in Fig. 2 (sphere A). At the start of each trajectory, the program determines the position and the orientation of the mobile molecule randomly on this sphere. The mobile molecule is subjected to a force
  in our case an electrostatic force, and moves accordingly, after which
  and R are recalculated. When the mobile molecule leaves a sphere of radius 200 Å from the center of the mass of the target molecule, the trajectory is concluded (sphere B in Fig. 2). In addition, at each step of the trajectory, the overlaps between all of the atoms of the mobile molecule and the target molecule are checked and prevented. In MacroDox, both of the molecules are treated as rigid rotating bodies. The torque of one molecule on the other is calculated with an equation similar to Eq. 1 (Northrup, 1996).
FIGURE 2.

Brownian dynamics methodology. PC or cyt c6 is randomly placed on a sphere A, 90 Å distance from the center of mass of cyt f. It is allowed to move one step under the influence of an electrostatic field and a random Brownian factor. Many such steps form a trajectory, which is terminated when the mobile molecule exits sphere B (200 Å). The smallest Fe-Cu or heme-heme distance is recorded for each trajectory (point C).
MacroDox determines the closest approach of the two molecules based on a set of preselected reaction criteria. In our simulations, these reaction criteria were chosen as metal-metal distances to select for the electron transfer-active complexes. The shorter the distance between metal centers, the higher the chance of electron transfer (Moser et al., 1992, 1995). In the cyt c6-cyt f interactions, since the heme ring is a possible route for electron transport to the Fe atom, and the orientation of the hemes with respect to each other is important in the electron transfer, we decided to use the heme-heme distance as the criterion (this criterion has been used previously for BD simulations in heme proteins; Northrup, 1996). Particularly, since the cyt c6 heme is exposed to the surface at two locations (one more than the other; Fig. 1) this would allow us to consider all of the possible orientations of cyt c6 on cyt f. Based on this criterion, the distances between four carbon atoms at four corners of the heme pyrrol rings are measured at each step of the trajectory. Gross and Pearson (2003) used a related criterion of Fe-Fe distance, which gave similar interaction rates. The reaction criterion for PC-cyt f interactions was the copper to iron, Cu-Fe, distance.
The smallest value of the reaction criterion for the trajectory shown in Fig. 2 is at point C. For each successful trajectory, MacroDox records the distance of C, the structure of the complex formed in the form of a PDB file, the fifteen closest electrostatic contacts in the complex, and the electrostatic interaction energy for the complex. After all of the trajectories have been concluded, the number of successes is determined and plotted as a function of the reaction criterion distance. Interaction rates were calculated as a function of the number of successes reaction criterion distance using equations derived by Northrup et al. (1987a,b, 1993) and Northrup (1996). These equations calculate second-order rate constants, k2, from the fraction of trajectories that met the preset reaction criteria. In this study, values of 16 Å cutoff for Cu-Fe and 14 Å for heme-heme distances were used. (This will be discussed further in the Results section.)
After the complexes are formed, MacroDox measures the distances between all of the charged residues on the two molecules and outputs a table of 15 closest electrostatic contacts for each complex formed. These tables are useful for determining the overall orientation of PC and cyt c6 with respect to cyt f. To tabulate these contacts for a series of closest complexes formed in wild-type PC-cyt f interactions, we only considered the complexes with 15-Å cutoff distance (out of a total of 50,000 trajectories for 10-mM runs, 1878 complexes satisfied this criterion). For wild-type cyt c6-cyt f interactions to consider a similar number of close complexes as PC-cyt f interactions, to obtain a table of close electrostatic contacts, only complexes with 13-Å cutoff distance were used (out of a total of 50,000 trajectories for 10-mM runs, 1821 complexes satisfied this criterion). We also used only these close complexes to calculate the average distances between the 15 closest charged residues in both PC-cyt f and cyt c6-cyt f interactions.
Electrostatic calculations
MacroDox uses a modified Tanford-Kirkwood pK algorithm (Matthew, 1985) to assign charges on the molecules. In addition, the charges on H37 and H87 on PC and one of the histidine residues on cyt f (H25) were set to zero, because they are ligated to the metal centers (the other histidine residue on cyt f is far away from the metal center). The charge on the single histidine on cyt c6 was also set to zero, due to the fact that it is a heme ligand. C84 is a ligand to the Cu atom on PC and its sulfur atom was assigned a net charge of −1 (Durell et al., 1990) and the Cu atom was given a charge of +2. The heme charges for both cyt f and cyt c6 were Fe (+2), two ring nitrogen atoms (−1 each), and the two propionic acid side chains (−1 each).
The electrostatic potentials were calculated using the Warwicker-Watson finite difference method to solve for linearized Poisson-Boltzmann equation (Warwicker and Watson, 1982). MacroDox uses a 61 × 61 × 61 cubic grid, whose center is positioned at the center of the mass of the protein, to solve for the electrostatic potential. We used a grid spacing of 3.6 Å, followed by a smaller spacing of 1.2 Å for the electrostatic potential calculations.
All of the simulations were carried out on a Silicon Graphics O2 workstation (IRIX 6.5).
RESULTS
We studied the electrostatic interactions between cyt f and its reaction partners, PC and cyt c6, in the C. reinhardtii system by mutating all of the charged residues on these two proteins one at a time to the uncharged residue of alanine (single charge-change mutations). The interactions between each mutant and cyt f were modeled using the BD simulation program MacroDox at 10 mM ionic strength and pH 7. To further investigate the effects of the mutations on cyt f-PC interactions, we also carried out some multiple charge-change mutations. To get a better idea of the accuracy of our simulations, we also compared our results with all of the available experimental data on the mutation of charged residues on PC. To match the experimental conditions, these comparative studies were carried out at an ionic strength of 100 mM. All of the mutations were made by the program MacroDox without any energy minimizations.
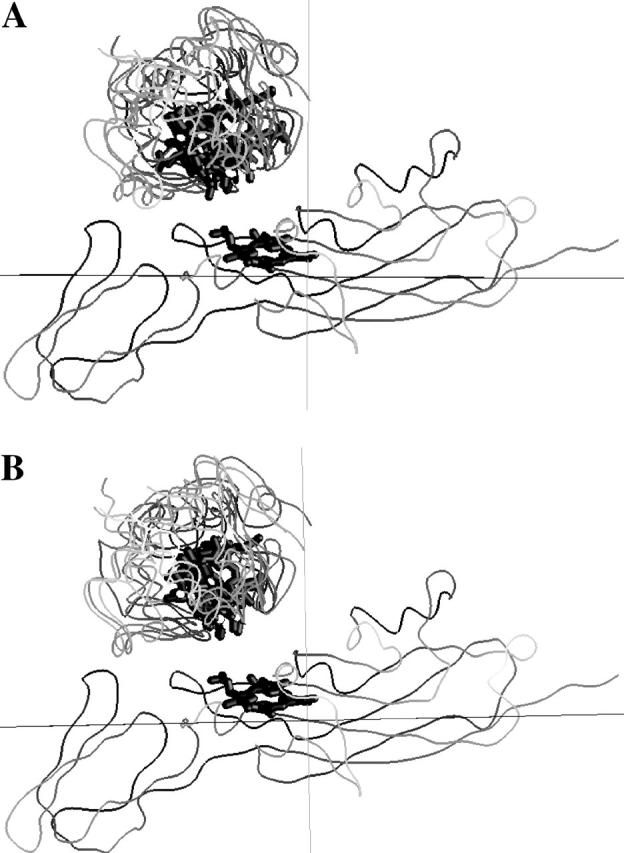
A plot of the number of successful complexes formed versus the reaction criterion coordinate distance for some of the PC mutants (right) and cyt c6 mutants (left) are shown in Fig. 3. The reaction criterion for cyt f-PC interactions was the Fe-Cu distance and for the cyt f-cyt c6 interactions was the heme-heme distance. The closest complexes formed for the cyt f-PC interactions had a Fe-Cu distance of 14 Å, but the minimum heme-heme distance for cyt f-cyt c6 complexes was 11.5 Å. This is due to the fact that the Cu atom is buried ∼2 Å inside the PC molecule, but two of the heme pyrrole rings of cyt c6 are exposed to the surface (Fig. 1). Maximal complex formation occurred between 14.5 and 14.75 Å for cyt f-PC and at 13 Å for cyt f-cyt c6 interactions (except for the cyt c6-R66A mutation).
FIGURE 3.

The interactions between C. reinhardtii cyt f with WT and mutant PCs (A) and mutant cyt c6s (B), at 10 mM ionic strength and pH 7.0. Five sets of 10,000 trajectories each were carried out, after which the average of the number of successful complexes per 10,000 trajectories were plotted as a function of Fe-Cu (for PC) or heme-heme (for cyt c6) distance at the closest approach. The number of complexes with distances of closest metal-metal distance between 15 and 15.25 Å are indicated by the point at 15 Å.
Compared to the interactions of wild-type (WT) PC with cyt f, the PC-triple mutant (PC-E43A + D44A + D61A) showed a large decrease in the number of complexes formed; PC-D44A and PC-D61A (two residues of the lower and upper clusters, respectively) also showed a decrease in the number of complexes formed. PC-D61A formed a greater number of complexes than did PC-D44A. PC-D8A had almost the same number of complexes formed as the WT PC interactions, whereas PC-R57A showed greater complex formation than did the WT PC.
Compared to the interactions of WT cyt c6 with cyt f, cyt c6-E70A showed a large decrease in the number of complexes formed; cyt c6-D2A showed a decrease in the number of complexes formed; cyt c6-E37A had no effect; and cyt c6-K33A showed a stimulation of the number of complexes formed. Compared to PC, the cyt c6 plots had a narrower peak except for cyt c6-R66A, which also had a maximum complex formation at a larger heme-heme distance.
In these plots, the calculated rate of complex formation is greater for larger numbers of complexes formed at a given metal-metal distance. In our simulations, the peak for the number of complexes formed versus distance was located at the small Fe-Cu or heme-heme distances. The complexes within the peaks can be considered as those formed mainly by electrostatic interactions. The complexes outside the peaks are those formed solely by random Brownian motions as shown by the simulations carried out in the absence of an electrostatic field. As can be seen from Fig. 3, for plots where no electrostatic force is present (EE-off), there were no significant (major) complexes formed (no peaks) at close distances for either wild-type PC or cyt c6 interacting with cyt f. In other words, at 10 mM ionic strength, the complex formation in the absence of the electrostatic field was too small to appear in Fig. 3. The EE-off complexes formed followed a Gaussian (normal) distribution with a maximum at ∼25 Å, which is too far for efficient electron transfer (data not shown). The complexes within the peaks, also due to their small metal-metal distances, have a higher chance to be involved in electron transfer (Moser et al., 1992, 1995).
The reaction criteria cutoff distances used to calculate reaction rates based on the number of electron transfer-active complexes formed were 16 Å for Cu-Fe in cyt f-PC and 14 Å for heme-heme in cyt f-cyt c6 interactions to include the entire peaks. Choosing these cutoff distances had two advantages: first, it allowed us to consider only close-distance electrostatic complexes formed and to ignore those formed by Brownian forces; and second, rates calculated would more closely resemble the experimental values (see Gross and Pearson, 2003, and Gross, 2004, for a discussion of this point). However, selection of the cutoff distances affects only the magnitude of the reaction rates, and not the relative effectiveness order of the mutations. This was evident from using 18 Å for Cu-Fe in cyt f-PC and 16 Å for heme-heme in cyt f-cyt c6 interactions, which resulted in almost identical class divisions as described below.
Reaction rates for PC-cyt f interactions
Single charge-change mutations
The calculated rates and the number of complexes formed for the mutations to alanine of each of the charged residues on PC are summarized in Table 1. Compared to the interactions of WT PC with cyt f, these mutations can be divided into five classes based on their effect on the rate of formation of electron transfer-active complexes, k2: Class I, maximum inhibition (<63% of the wild-type interactions (WTI)); Class II, moderate inhibition (70–74% of WTI); Class III, almost no effect (83–88% of WTI); Class IV, no effect (103–111% of WTI); and Class V, stimulatory (>124% of WTI). Mutants of residues E43 and D44 (positioned in the lower cluster) fall into the maximum inhibitory category (Class I). Mutants of residues D42, D53, D59, D61, E79, and E85 form the moderate inhibitory category (Class II). Residues D59, D61, and E85 are in the upper cluster. D0A and E25A are in the almost-no-effect class (III). Mutation of K4A, D8A, K17A, E13A, and E68A showed little or no effect (Class IV). Neutralization of the positively charged residues R57A, K73A, and K95A resulted in stimulation in the interaction rates (Class V).
TABLE 1.
The effect of C. reinhardtii plastocyanin single charge-change mutations on its interactions with cyt f at 10 mM ionic strength and pH 7.0
| No. of complexes per 10,000 trajectories | k2* (×108) (M−1 s−1) | % WT | |
|---|---|---|---|
| CLASS I | |||
| E43N | 374 ± 7 | 12.0 ± 0.6 | 60.0 ± 4 |
| D44A | 381 ± 9 | 12.1 ± 0.6 | 60.7 ± 4 |
| E43A | 392 ± 7 | 12.5 ± 0.5 | 62.6 ± 3 |
| CLASS II | |||
| D42A | 438 ± 9 | 14.0 ± 0.7 | 70.0 ± 4 |
| D59A | 441 ± 8 | 14.1 ± 0.7 | 70.3 ± 4 |
| D61A | 452 ± 9 | 14.4 ± 0.7 | 72.0 ± 4 |
| D53A | 452 ± 8 | 14.4 ± 0.5 | 72.2 ± 4 |
| D42N | 460 ± 4 | 14.7 ± 0.8 | 73.3 ± 5 |
| E85A | 461 ± 8 | 14.7 ± 0.8 | 73.7 ± 5 |
| E79A | 463 ± 2 | 14.8 ± 0.7 | 73.9 ± 5 |
| CLASS III | |||
| E25A | 527 ± 7 | 16.7 ± 0.8 | 83.7 ± 5 |
| D0A | 555 ± 6 | 17.6 ± 0.7 | 87.9 ± 5 |
| CLASS IV | |||
| WT | 635 ± 10 | 20.0 ± 0.7 | 100.0 ± 4 |
| E68A | 655 ± 10 | 20.6 ± 0.9 | 103.0 ± 6 |
| K4A | 672 ± 3 | 21.1 ± 0.8 | 105.5 ± 5 |
| D8A | 676 ± 7 | 21.2 ± 0.8 | 106.1 ± 5 |
| K17A | 686 ± 6 | 21.5 ± 0.9 | 107.6 ± 6 |
| E13A | 714 ± 6 | 22.3 ± 0.7 | 111.5 ± 5 |
| CLASS V | |||
| K95A | 802 ± 15 | 24.9 ± 0.7 | 124.6 ± 6 |
| K73A | 824 ± 18 | 25.6 ± 0.9 | 127.9 ± 6 |
| R57A | 870 ± 4 | 26.8 ± 1.0 | 134.2 ± 7 |
The side chain of K22 is missing in PDB entry 2PLT; therefore it was not considered for mutation.
The second-order rate constants for the formation of electron transfer-active complexes, k2, were calculated from the fraction of trajectories that met the preset reaction criteria. In cyt f-PC interactions, a value of 16 Å cutoff for Cu-Fe distance was used (see Methods section). The mutations were divided into five classes based on their effect on the rate, k2: class I, maximum inhibition (<63% of the WTI); class II, moderate inhibition (70–74% of WTI); class III, almost no effect (83–88% of WTI); class IV, no effect (103–111% of WTI); and class V, stimulatory (>124% of WTI).
Multiple charge-change mutations
The calculated rates and the number of complexes formed for the multiple charge-change mutations on PC are summarized in Table 2. K95E and R57E stimulated the interactions (and hence binding) by ∼40 and ∼70%, respectively, indicating that these mutations could be useful in cocrystallization of a cyt f-PC complex. The double mutants D59A + D61A, E43A + D44A, and E43A + D61A decreased the interaction rates compared to single alanine mutations. The D53K mutant, located between the two acidic clusters, resulted in severe inhibition of the interactions. Triple mutation E43A + D44A + D61A decreased the interaction rate by ∼85%. Quadruple charge-change mutations (E43K + D44K and D59K + D61K) showed also an almost eightfold decrease in the interaction rates.
TABLE 2.
The effect of C. reinhardtii plastocyanin multiple charge-change mutations on its interactions with cytochrome f at 10 mM ionic strength and pH 7.0
| No. of complexes per 10,000 trajectories |
k2* ( 108) M−1 s−1 108) M−1 s−1
|
% WT control | |
|---|---|---|---|
| R57E | 1115 ± 7 | 33.8 ± 1.0 | 169.2 ± 8 |
| K95E | 931 ± 5 | 28.6 ± 0.8 | 143.2 ± 7 |
| WT | 635 ± 10 | 20.0 ± 0.7 | 100.0 ± 4 |
| D59A + D61A | 290 ± 10 | 9.4 ± 0.6 | 46.9 ± 4 |
| E43A + D44A | 237 ± 2 | 7.7 ± 0.5 | 8.6 ± 3 |
| E43A + D61A | 208 ± 6 | 6.8 ± 0.5 | 33.9 ± 3 |
| D53K | 199 ± 4 | 6.5 ± 0.5 | 32.4 ± 3 |
| D59K + D61K | 101 ± 4 | 3.3 ± 0.4 | 16.6 ± 2 |
| E43A + D44A + D61A | 91 ± 4 | 3.0 ± 0.4 | 14.9 ± 2 |
| E43K + D44K | 73 ± 2 | 2.4 ± 0.3 | 12.0 ± 1 |
| EE-off† | 2.3 ± 0.4 | 0.015 ± 0.013 | 0.075 ± 0.065 |
The second-order rate constants, k2, were calculated from the fraction of trajectories that met the preset reaction criteria. In cyt f-PC interactions a value of 16 Å cutoff for Cu-Fe distance was used (see Methods section).
EE-off value was obtained by turning off the electrostatic fields in the wild-type PC-cyt f interactions. Originally, we carried out five sets of 10,000 trajectories (similar to the mutants) to obtain the EE-off rate value, which resulted in zero successful complexes. Therefore, we conducted five sets of 50,000 trajectories to obtain a nonzero rate value at 16 Å cutoff distance in the absence of electrostatic fields.
PC-cyt f complex formation
The positions of all of the mutations on PC are shown in Fig. 4. A typical complex of PC with cyt f is shown in four different views (90° rotations with respect to each other). One main feature of the complexes formed was that they not only showed the involvement of the residues on the upper and lower clusters in PC in electrostatic interactions with cyt f (Fig. 4 A), but also the hydrophobic interactions with cyt f involving the residues surrounding H87 on PC. As can be seen from Fig. 4 A, which is the view of the complex through cyt f, all of the mutations listed in Table 1 as inhibitory are facing toward the cyt f heme. On the other hand, residues in Table 1 that show little or no effect in complex formation are all located on the back of the PC molecule or on the sides (with respect to cyt f; Fig. 4, C and D). The mutations that stimulated the reaction (R57A, K73A, and K95A) are positioned close to the two acidic clusters on PC. The removal of these positively charged residues enhanced the interactions by strengthening the negative electrostatic field of PC.
FIGURE 4.
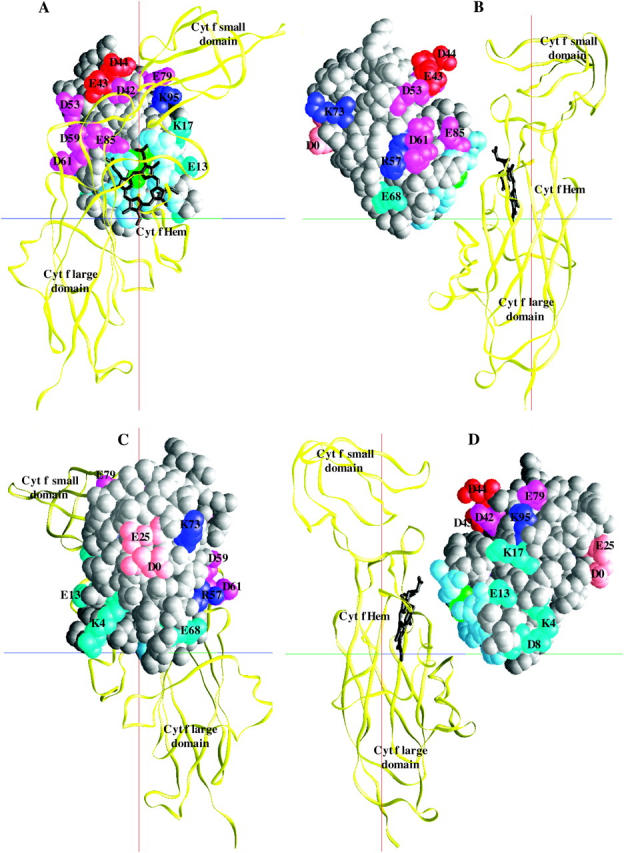
Positions of the mutated residues on C. reinhardtii PC. Cyt f are shown as Cα worm (yellow) and PC as space-filling models (gray). The residues are color-coded based on the effect of their mutation to alanine on the intersection rate: red, maximum inhibition (class I); pink, moderate inhibition (class II); light orange, almost no effect (class III); magenta, no effect (class IV); blue, stimulatory (class V). PC-His87 is colored in green and the hydrophobic residues surrounding it in light blue. Four different orientations of the complex with 90° degree rotation with respect to each other (A–D) are shown.
Charged residues that come into close contact in PC-cyt f interactions
The total number of electrostatic close contacts per complex for charged residues on wild-type PC involved in its interactions with cyt f are shown in Table 3. Only ∼1/3 of PC charged residues (D42, E43, D44, D53, D59, D61, and E85) have significant contacts with charged residues on cyt f. These are all upper- and lower-cluster residues, signifying their importance in the interactions. Among these residues E85 has the maximum number of contacts, due to the fact that it is located close to H87 on PC, which is a ligand to the Cu atom. (The Cu-Fe distance was the reaction criterion for the complex formation.) Mutations in Table 1 that had no effect on complex formation, formed fewer (if any) close contacts with residues on cyt f, suggesting that these residues are insignificant in the interactions. Only one of the residues whose mutations stimulated the interactions (R57) appeared in Table 3 with few contacts (the contacts for K17 were negligible). This is not surprising, because the positive field of cyt f repels the positive residues on PC.
TABLE 3.
Total number of electrostatic close contacts per complex for charged residues on wild-type PC and cyt c6 in their interactions with cyt f
| PC residues | Contacts per complex* | Cyt c6-residues | Contacts per complex† |
|---|---|---|---|
| E85 | 2.47 ± 0.06 | R66 | 4.32 ± 0.20 |
| E43 | 2.40 ± 0.05 | D65 | 3.73 ± 0.18 |
| D53 | 2.21 ± 0.05 | E71 | 1.55 ± 0.08 |
| D44 | 2.20 ± 0.05 | HEME (200) | 1.38 ± 0.06 |
| D59 | 1.30 ± 0.03 | E70 | 0.80 ± 0.04 |
| D42 | 1.07 ± 0.03 | K57 | 0.66 ± 0.02 |
| D61 | 0.61 ± 0.02 | D2 | 0.62 ± 0.03 |
| R57 | 0.15 ± 0.004 | E54 | 0.52 ± 0.02 |
| E13 | 0.09 ± 0.01 | E69 | 0.35 ± 0.01 |
| E68 | 0.06 ± 0.004 | K29 | 0.31 ± 0.01 |
| K17 | 0.04 ± 0.004 | E28 | 0.21 ± 0.008 |
| D8 | 0.01 ± 0.002 | D41 | 0.16 ± 0.009 |
| K89 | 0.08 ± 0.009 | ||
| R22 | 0.02 ± 0.002 |
For a description of the close contacts, refer to the Methods section. Residues that had contacts in more than half of the successful complexes formed in each reaction are in bold print.
Out of 50,000 trajectories, only 1878 complexes that were formed for PC-cyt f interactions with 15 Å cutoff distance are considered. The Cu atom on PC showed a large number of close contacts with residues on cyt f, but since it was not surface-exposed it was not listed (the same was true for C84).
Out of 50,000 trajectories, only 1821 complexes that were formed for cyt c6-cyt f interactions with 13 Å cutoff distance are considered.
The contact residues on cyt f for the PC residues in Table 3 that had >0.5 contacts per complexes formed (marked as bold) are listed in Table 5. As can be seen, the upper- and lower-cluster acidic residues on PC are in close contact most often with K65, K188, and K189 on cyt f. These observations agree well with those of Gross and Pearson (2003).
TABLE 5.
Electrostatic contacts for wild-type PC-cyt f and cyt c6-cyt f complexes
| PC residue* | Cyt f residue | No. of close contacts | Cyt c6 residue† | Cyt f residue | No. of close contacts |
|---|---|---|---|---|---|
| D42 | K65 | 134 | D2 | K188 | 659 |
| K188¶ | 881 | K189 | 464 | ||
| K189 | 994 | E54 | K188 | 321 | |
| E43 | K65 | 1075 | K189 | 534 | |
| E187 | 127 | K57 | K65 | 605 | |
| K188 | 1641 | K189 | 346 | ||
| K189 | 1647 | D65 | K55 | 224 | |
| D44 | K65 | 281 | K58 | 387 | |
| E187 | 1182 | K65 | 461 | ||
| K188 | 1311 | D68 | 976 | ||
| K189 | 1232 | K121 | 977 | ||
| K207 | 125 | K122 | 655 | ||
| D53 | K65 | 804 | R156 | 404 | |
| E187 | 143 | D162 | 216 | ||
| K188 | 1571 | K164 | 382 | ||
| K189 | 1635 | K188 | 157 | ||
| D59 | K65 | 946 | K189 | 511 | |
| K188 | 599 | E193 | 204 | ||
| K189 | 897 | K207 | 644 | ||
| D61 | K165 | 500 | HEM | 560 | |
| K188 | 199 | R66 | K58 | 509 | |
| K189 | 376 | K65 | 760 | ||
| E85 | K65 | 1805 | K66 | 136 | |
| K188 | 535 | D68 | 652 | ||
| K189 | 1827 | K121 | 406 | ||
| HEM | 269 | R156 | 1294 | ||
| D162 | 721 | ||||
| K164 | 698 | ||||
| K207 | 155 | ||||
| HEM | 2378 | ||||
| E70 | K65 | 306 | |||
| K188 | 597 | ||||
| K189 | 522 | ||||
| E71 | K65 | 925 | |||
| K164 | 123 | ||||
| K188 | 717 | ||||
| K189 | 816 | ||||
| Heme | 65 | 216 | |||
| 68 | 356 | ||||
| 121 | 432 | ||||
| 156 | 120 | ||||
| 189 | 201 | ||||
| Heme | 1204 |
Cyt f residues in close contact are listed. Residue pairs with close contacts in >40% of the complexes formed are in bold print. Only electrostatic contact pairs with >100 occurrences are listed. For a description of the close contacts, refer to the Methods section.
Out of 50,000 trajectories, only 1878 complexes that were formed for PC-cyt f interactions with 15 Å cutoff distance are considered. Only contacts for the PC residues in bold print in Table 3 are listed. The Cu atom on PC showed a large number of close contacts with residues on cyt f, but since it was not surface-exposed, it was not listed (the same was true for C84).
Out of 50,000 trajectories, only 1821 complexes that were formed for cyt c6-cyt f with 13 Å cutoff distance are considered. Only contacts for the cyt c6 residues in bold print in Table 3 are listed.
Uniformity in PC-cyt f complexes
The question arises whether or not the complexes observed for different mutations in BD simulations have unique orientations. Fig. 5 depicts the peptide backbone overlays of five complexes each, for wild-type, E43A + D44A, D59A + D61A, and R57A in PC-cyt f interactions. These were chosen randomly from the complexes with Cu-Fe distances less than the peak distances in the plots of the complexes formed (Fig. 3 A). The overall orientation of PC with respect to cyt f did not change in any of the mutant complexes. Also, the wild-type and the mutant complexes were, more or less, uniform.
FIGURE 5.
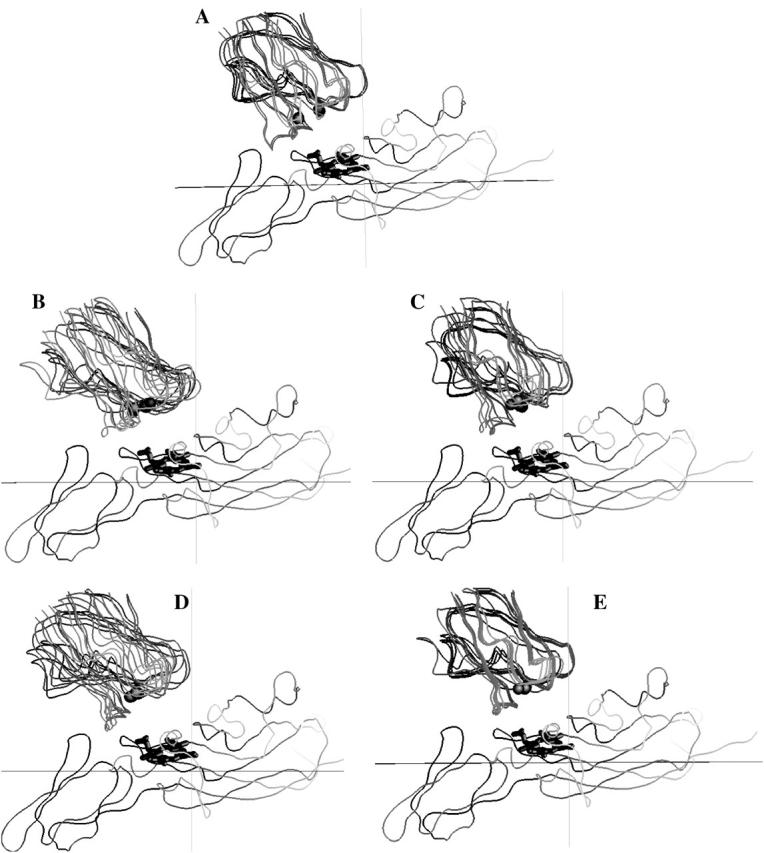
Orientation of the protein backbones of the complexes formed for PC-cyt f interactions. (A) Wild-type PC complex. (B) E43A + D44A PC mutation. (C) D59A + D61A PC mutation. (D) E43A + D44A + D61A PC mutation. (E) R57A PC mutation. For each interaction, five complexes with cutoff distances less than the peak distances were randomly chosen. The overlays were done using the program GRASP (Nicholls and Honig, 1991).
Single charge-change reaction rates for cyt c6-cyt f interactions
The calculated rates and the number of complexes formed for the mutations of each of the charged residues on cyt c6 to alanine are summarized in Table 4. Compared to the interactions of wild-type cyt c6 with cyt f, these mutations can be divided into four classes based on their effect on the rate of formation of electron transfer-active complexes, k2: Class I, maximum inhibition (<67% of the WTI); Class II, moderate inhibition (75–84% of WTI); Class III, no effect (91–104% of WTI); and Class IV, stimulatory (>108% of WTI). Mutants of residues D2, E54, E69, E70, and E71 fall into Class I. Mutants of residues E37, D41, E47, D65, R66, and E77, form the moderate inhibitory category (Class II). Mutation of E28A, D32A, and K89A showed little or no effect (Class III). Neutralization of the positively charged residues R22, K33, K29, K45, K57, and K81 resulted in stimulation in the interaction rates (Class IV).
TABLE 4.
The effect of C. reinhardtii cytochrome c6 single charge-change mutations on its interactions with cytochrome f at 10 mM ionic strength and pH 7.0
| No. of complexes per 10,000 trajectories |
k2* ( 108) (M−1 s−1) 108) (M−1 s−1) |
% WT | |
|---|---|---|---|
| CLASS I | |||
| E70A | 455 ± 3 | 14.7 ± 0.7 | 54.7 ± 3 |
| E69A | 487 ± 10 | 15.7 ± 0.6 | 58.4 ± 3 |
| E54A | 533 ± 11 | 17.1 ± 0.8 | 63.7 ± 4 |
| D2A | 548 ± 9 | 17.5 ± 0.7 | 65.4 ± 3 |
| E71A | 562 ± 8 | 18.0 ± 0.9 | 67.0 ± 4 |
| CLASS II | |||
| E77A | 635 ± 5 | 20.2 ± 0.7 | 75.3 ± 4 |
| E47A | 647 ± 8 | 20.6 ± 1.0 | 76.7 ± 4 |
| R66A | 653 ± 4 | 20.8 ± 0.7 | 77.3 ± 4 |
| D41A | 659 ± 13 | 20.9 ± 0.7 | 78.0 ± 3 |
| R66Q | 668 ± 10 | 21.2 ± 0.8 | 79.1 ± 4 |
| D65A | 710 ± 20 | 22.4 ± 0.7 | 83.6 ± 4 |
| E37A | 713 ± 8 | 22.7 ± 0.8 | 84.4 ± 4 |
| CLASS III | |||
| E28A | 771 ± 7 | 24.4 ± 1.03 | 91.1 ± 5 |
| D32A | 796 ± 8 | 25.0 ± 0.9 | 93.2 ± 4 |
| WT | 858 ± 12 | 26.8 ± 0.9 | 100.0 ± 3 |
| K89A | 899 ± 4 | 28.0 ± 0.9 | 104.5 ± 5 |
| CLASS IV | |||
| R22A | 930 ± 7 | 29.1 ± 1.0 | 108.4 ± 5 |
| K29A | 970 ± 6 | 30.1 ± 1.2 | 112.1 ± 6 |
| K57A | 979 ± 17 | 30.3 ± 1.0 | 113.0 ± 5 |
| K45A | 987 ± 13 | 30.7 ± 0.8 | 114.5 ± 5 |
| K81A | 1030 ± 17 | 31.8 ± 0.8 | 118.5 ± 5 |
| K33A | 1024 ± 11 | 31.8 ± 1.0 | 118.5 ± 5 |
| EE-off† | 1.6 ± 0.4 | 0.05 ± 0.04 | 0.2 ± 0.1 |
The second-order rate constants for the formation of electron transfer-active complexes, k2, were calculated from the fraction of trajectories that met the preset reaction criterion. In cyt f-cyt c6 interactions a value of 14 Å cutoff for heme-heme distance was used (see Methods section). The mutations were divided into four classes based on their effect on the rate, k2: class I, maximum inhibition (<67% of WTI); class II, moderate inhibition (75–84% of WTI); class III, no effect (91–104% of WTI); and class IV, stimulatory (>108% of WTI).
EE-off value was obtained by turning off the electrostatic fields in the wild-type cyt c6-cyt f interactions.
Cyt c6-cyt f complex formation
The positions of all of the mutations on cyt c6 are shown in Fig. 6. A typical complex of cyt c6 with cyt f is shown in four different views (90° rotations with respect to each other). As for the PC-cyt f interactions (Fig. 4), the complexes formed showed not only the involvement of the residues that correspond to the upper and lower clusters on PC in electrostatic interactions with cyt f, but also the hydrophobic interactions with cyt f involving the residues surrounding the heme on cyt c6 (Fig. 6 A). In contrast to PC, most of the mutations listed in Table 4 as inhibitory (and hence important for the interactions) are not facing toward the cyt f heme (Fig. 6 D). With respect to cyt f, cyt c6 is positioned such that these residues are mostly on the side of the cyt c6 molecule with an inclination toward cyt f. The residues whose mutations in Table 4 showed no effect on complex formation, as in the case of PC, were all located on the back of the cyt c6 molecule (with respect to cyt f; Fig. 6 C). The residues whose mutations stimulated the reaction are positioned on the opposite side of the cyt c6 molecule with respect to residues whose mutations inhibited the reaction (Fig. 6, B and D).
FIGURE 6.
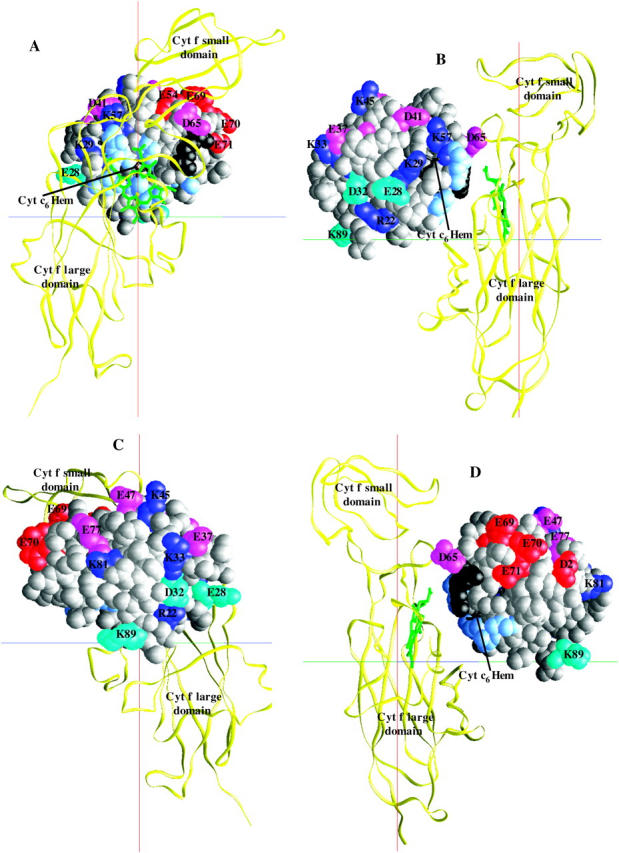
Positions of the mutated residues on C. reinhardtii cyt c6. Cyt f is shown as Cα worm (yellow) and PC as space-filling models (gray). The residues are color-coded based on the effect of their mutation to alanine on the reaction rate: red, maximum inhibition (class I); pink, moderate inhibition (class II); magenta, no effect (class III); blue, stimulatory (class IV). The c6 heme is colored in black and the hydrophobic residues surrounding it in light blue. Cyt c6-R66 is shown in black. The cyt f heme is shown in green. Four different orientations of the complex with 90° degree rotation with respect to each other (A–D) are shown.
Charged residues that come into close contact in cyt c6-cyt f interactions
The total number of electrostatic close contacts per complex for charged residues on wild-type cyt c6 involved in its interactions with cyt f are shown in Table 3. As was the case for PC, only ∼1/3 of cyt c6 charged residues (D2, E54, K57, D65, R66, E70, E71, and the heme) have significant contacts with charged residues on cyt f. Mutations in Table 4 that had no effect on complex formation formed fewer close contacts with residues on cyt f, suggesting that these residues are insignificant in the interactions. In contrast to PC, cyt c6 had more residues whose mutations stimulated the interactions, forming a large number of close contacts per complex (K29, K57, and R66 in Table 3). This may be due to their proximity to the heme of cyt c6, which was the reaction criterion, or the lack of uniformity (as will be discussed later) in cyt c6-cyt f complexes. R22 and K89 contacts were negligible.
The contact residues on cyt f for cyt c6 residues in Table 3, that had >0.5 contacts per complexes formed (marked as bold) are listed in Table 5. As in the case of PC, cyt c6's lower-cluster acidic residues, E71 and E70, are in close contact most often with K65, K188, and K189 on cyt f, which agrees with the results of Gross and Pearson (2003). Additional information from Table 5 includes the observation that there were a greater number of same-charge close contacts for cyt c6-cyt f interactions compared to PC-cyt f interactions (particularly for cyt c6 residues D65 and R66).
Uniformity in cyt c6-cyt f complexes
To check for the uniformity of cyt c6-cyt f complexes, we overlaid several of them for the wild-type cyt c6 and mutants. Fig. 7 depicts the peptide backbone overlays of five complexes each for wild-type and K29A-cyt c6 interacting with cyt f. These were chosen randomly from the complexes formed with heme-heme distances less than the peak distances in the plots of the complexes formed (Fig. 3 B). As in the case of PC-cyt f complexes, the overall orientation of cyt c6 with respect to cyt f did not change in the mutant complexes compared to the wild-type. However, in contrast to PC, neither wild-type nor any of the mutations resulted in uniform complexes.
FIGURE 7.
Orientation of the protein backbones of the complexes formed for cyt c6-cyt f interactions. (A) Wild-type cyt c6 complex. (B) K29A cyt c6 mutation. For each interaction, five complexes with cutoff distances less than the peak value were randomly chosen. The overlays were done with the program GRASP (Nicholls and Honig, 1991).
The comparison between interaction rates calculated from BD simulations and available experimental data that involved charged residue mutations in PC-cyt f interactions are shown in Table 6.
TABLE 6.
Comparison between interaction rates calculated from BD simulations and available experimental data that involved charged residue mutations in PC-cyt f interactions
| C. reinhardtii residues | Simulation,*k2s ( 108) M−1 s−1 108) M−1 s−1
|
% WT | Experiment, k2e ( 108) M−1 s−1 108) M−1 s−1
|
% WT |
|---|---|---|---|---|
| WT | 1.34 ± 0.09 | 100.0 ± 7 | 1.80 ± 0.20† | 100.0 ± 11 |
| D42N | 1.29 ± 0.11 | 96.2 ± 10 | 0.59 ± 0.04† | 32.8 ± 4 |
| E43N | 0.82 ± 0.06 | 61.2 ± 6 | 0.40 ± 0.015† | 22.2 ± 3 |
| D59K + D61N | 0.68 ± 0.06 | 50.6 ± 6 | 0.12 ± 0.003† | 6.7 ± 0.8 |
| E43Q + D44N | 0.63 ± 0.09 | 47.3 ± 8 | 0.23 ± 0.008† | 12.8 ± 0.2 |
| E43K | 0.63 ± 0.06 | 47.0 ± 5 | 0.22 ± 0.008† | 12.2 ± 1 |
| E43N + D59K + D61N | 0.24 ± 0.05 | 18.3 ± 4 | 0.05 ± 0.0001† | 2.8 ± 0.3 |
| EE-off‡ | 0.01 ± 0.009 | 0.9 ± 0.6 | 0.04 ± 0.01 | 2.2 ± 0.8 |
| WT | 1.34 ± 0.09 | 100.0 ± 7 | 1.75 ± 0.03§ | 100 ± 2 |
| D53K | 0.68 ± 0.06 | 50.5 ± 6 | 0.79 ± 0.06§ | 45.1 ± 4 |
| WT | 1.34 ± 0.09 | 100.0 ± 7 | 1.08¶ | 100.0 |
| D42N | 1.29 ± 0.11 | 96.2 ± 10 | 0.35¶ | 32.4 |
| D59K | 0.69 ± 0.08 | 51.3 ± 7 | 1.08¶ | 100.0 |
| E43K | 0.63 ± 0.06 | 47.0 ± 5 | 0.15¶ | 13.9 |
| D42N + E43K | 0.52 ± 0.09 | 38.9 ± 7 | 0.10¶ | 9.3 |
| D59K + D61K | 0.49 ± 0.08 | 36.7 ± 7 | 1.08¶ | 100.0 |
| E43K + D44K | 0.40 ± 0.06 | 30.0 ± 5 | 0.07¶ | 6.4 |
Rate calculations are the same as for Table 1. All experiments were carried out at an ionic strength of 100 mM; the same value was used in simulations. At 100 mM ionic strength the electrostatic interactions are weaker, so to obtain a similar number of reaction events as the 10-mM runs, five sets of 50,000 trajectories were carried out. The pH used in the simulations was 7.0.
Experiments were carried out for turnip cyt f interacting with spinach PC at pH 7.5 (Kannt et al., 1996). In C. reinhardtii, residue 59 is aspartic acid and there is a deletion at position 60; residue 61 is also aspartic acid. Therefore, to better match the experiments, we have used asparagine instead of glutamine in our simulations.
The EE-off value in the simulations was obtained by turning off the electrostatic interactions. This situation was the equivalent of the experimental wild-type rate value extrapolated to infinite ionic strength (Kannt et al., 1996).
Experiments were carried out for turnip cyt f interacting with pea PC at pH 6.0 (Gong et al., 2000). Residue 51 in higher-plant PCs is analogous to residue 53 in C. reinhardtii. Gong et al. (2000) repeated the Kannt et al. (1996) mutations and obtained similar results.
Experiments were carried out for Brassica komatsuna cytochrome f interacting with Silene pratensis PC at pH 8.0 (Lee et. al., 1995). In C. reinhardtii, residue 59 is aspartic acid and there is a deletion at position 60; residue 61 is also aspartic acid. Therefore, to better match the experiments we have used asparagine instead of glutamine in our simulations. The rate values were taken from Fig. 5 in Lee et al. (1995); error values were not reported.
DISCUSSION
Overall, our data points toward the electrostatic nature of PC-cyt f and cyt c6-cyt f interactions. The mutations that weakened the negative electrostatic field of PC or cyt c6 either had an inhibitory or no effect on the interaction rates. On the other hand, all of the mutations that reduced the positive electrostatic field of PC or cyt c6 had a stimulatory effect, except for the cyt c6-R66A mutation (Tables 1 and 4). These results are not surprising considering that cyt f has a positive electrostatic field, which interacts with the strong negative fields on PC or cyt c6. However, as can be seen in Figs. 4 A and 6 A, one main feature of the complexes formed (in addition to the presence of charged residues in the binding site) was the involvement of hydrophobic interactions between cyt f and the residues surrounding the H87 on PC or residues surrounding the heme on cyt c6. These observations matched well with the NMR studies that probed the surface area of PC in its interactions with cyt f (Ubbink et al., 1998; Ejdeback et al., 2000; Bergkvist et al., 2001). Our results are another confirmation of the proposal that electrostatic interactions play an important role (at least in vitro) in bringing PC or cyt c6 sufficiently close to cyt f to allow hydrophobic and van der Waals interactions (that only occur on one side of the complex, Figs. 4 and 6) to form the final electron transfer-active complex (Ubbink et al., 1998; Ejdeback et al., 2000; Crowley and Ubbink, 2003; Gross and Pearson, 2003).
We used a cutoff distance of 14 Å to calculate cyt c6-cyt f interaction rates, which included the peaks in Fig. 3 B. However cyt c6-R66A has a wider peak compared to the other cyt c6 mutants and a 14-Å cutoff value would not include its entire peak. To be consistent with the rest of the mutations, we also used 14 Å for R66A rate calculation. If one uses a cutoff value of 16 Å for R66A (to include its entire peak), its calculated interaction rate would fall into the no-effect class in table 4. In Table 3, residues R66 and D65 have 4.32 and 3.73 contacts per complex, respectively, which were more than any residue on PC. In Table 5 these residues also have most of the contacts with a variety of cyt f residues (even those with the same charge). These additional contacts, which are due to the heterogeneity in cyt c6-cyt f complexes, may explain why the peak for R66A-cyt c6 is broader than the peaks for the rest of the cyt c6 mutants. The different behavior of D65 and R66 could be related to their locations between the key acidic residues on cyt c6 and the portion of its heme that is more exposed to the surface (Fig. 1; heme-heme distance was used as the reaction criterion for cyt c6-cyt f interactions).
Comparison with experimental data
Compared to other modeling methods such as Monte Carlo calculations, MacroDox BD simulations require relatively short computational time (a couple of hours) and provide a large amount of information regarding complex formation and interaction rates under different conditions. MacroDox has been used successfully in modeling the cyt f-PC and cyt f-cyt c6 interactions (Pearson and Gross, 1998; Gross and Pearson, 2003). It has also been used to study other systems such as the recognition of the scorpion toxin P05 and the small-conductance, calcium-activated potassium channels (Cui et al., 2002). In all of these cases, the simulations agreed well with the experimental data.
MacroDox has some weaknesses: the hydrophobic interactions are not explicitly included; only rigid-body molecules without any conformational changes can be docked; and mutual desolvation effects are not considered. However, due to comparable complex formation with respect to the wild-type interactions, the desolvation effects should be very similar for all of our mutants. Therefore, since we are only considering the relative order of mutations, the desolvation can be neglected. In PC-cyt f interactions, the average distance between the 15 closest charged residues in all of the close complexes formed (as was described in the Methods section) was 8.64 Å, and in the cyt c6-cyt f interactions it was 9.06 Å. A method to consider the mutual desolvation effects was implemented by Elcock et al. (1999) and Gabdoulline and Wade (2001).
MacroDox uses the Tanford-Kirkwood algorithm for determining pK values, which is only accurate at pH 7 for PC and cyt c6 and is not suitable for calculations at the lower pH values that exist inside the lumen of the thylakoid. This is due to the fact that the charge clusters in these two molecules affect the pK values of the residues within the clusters and the Tanford-Kirkwood algorithm does not work well under these conditions. MacroDox considers a low dielectric constant for the target molecule, a value of 4, but treats the mobile molecule as a set of point charges embedded in the solvent. This may cause an overestimation of the reaction rates by as much as 25%, but does not affect the structure of the complexes formed or the relative order of mutations (Northrup et al., 1987a,b; S. H. Northrup, Tennessee Technological University, personal communication, 2002). Gabdoulline and Wade (1996) implemented a method of using effective charges in BD simulations to include the low internal dielectric of the mobile molecule. For a detailed discussion of strengthens and weaknesses of MacroDox see Gross and Pearson (2003) and Gross (2004).
As can be seen in Table 6, the three experimental values for the wild-type PC-cyt f interactions are very close to the calculated value. For the mutations performed by Kannt et al. (1996), the trend of effectiveness of our results agrees very well with the experimental data. Only D59K + D61N does not follow the order. Interestingly, although the upper-cluster mutant, D59K + D61N, has a less overall negative charge than the lower-cluster mutant, E43Q + D44N, our results indicated similar inhibition effects for these mutants. Kannt et al. (1996) were not able to distinguish between E43Q + D44N and E43K mutations (with similar net charge changes), which exactly matched our results. By turning off the electrostatic interactions in the simulations, we obtained the EE-off rate value, which was the equivalent of the experimental wild-type rate value extrapolated to infinite ionic strength (Kannt et al., 1996). The important observation was that in the presence of the electrostatic field, the interaction rates are two orders of magnitude greater.
The D53K mutation, located between the two acidic clusters, resulted in severe inhibition of the interaction rate, which was the same result as observed by Gong et al. (2000). Experiments performed by Lee et al. (1995) showed no effect for the mutations of PC's upper-cluster residues, but showed that the mutations of the lower-cluster residues inhibited the interactions. Their observations for the effective trend of the lower-cluster mutants paralleled our results.
It should be mentioned that we are not reporting absolute values for the interaction rates, because simulating all of the experimental conditions is not possible. However, the important issue is the relationship between these values, which had an overall good agreement with the experimental data. The cutoff distances we chose for the simulations may be one of the main reasons why our values for the interaction rates are higher than the experimental work. Our rate calculations depend on the cutoff distance, and choosing a smaller value would lower the number of complexes formed and, eventually, the reaction rate values (see Gross, 2004). When we used a smaller cutoff distance, neither the orientation of the complexes formed nor the relative effects of the mutations changed (data not shown; a smaller cutoff value would not include all of the close-distance electrostatic complexes formed).
PC-cyt f interactions
Although there are some experimental data available for PC mutants interacting with cyt f (Lee et al., 1995; Kannt et al., 1996; Gong et al., 2000), no single charge-change mutants for the upper cluster on PC, and no mutations of cationic residues on PC have been reported. Also, there is only one mutation of PC charged residues outside the two clusters. In all of the higher-plant and green-alga PC sequences available, only D42, E43, and D44 among the charged residues are 100% conserved (Gross, 1996). In our simulations, the single charge-change mutations of these lower-cluster residues inhibited the interactions (Table 1). Changing the residues on the upper cluster of PC—59, 61, and 85—to alanine also showed inhibitory effects on the rate of complex formation (Table 1). E25 and E68 are >90% conserved in all higher-plant and green-alga PCs (Pearson, 2000). These mutations showed very little effect on the rate of complex formation, which indicates that they are not involved directly in the interactions with cyt f.
The experiments of Kannt et al. (1996) showed that both clusters are important for the PC-cyt f interactions, with the upper cluster being slightly less effective, although single upper-cluster mutants were not studied. Our results also indicated a difference between the two clusters. As can be seen in Table 1, D44A and E43A of the lower cluster showed greater inhibition than mutations of any of the residues (D59A, D61A, or E85A) of the upper cluster. They were also more inhibitory than the mutations of the residues on the edge of the lower cluster, D42A or E79A. E43A and E43N have the same effect, within error, indicating that the main effect is removal of the charge not the change in the size of the residue in question (The same was true for D42A and D42N). These results led to the conclusion that E43 and D44, of the lower cluster, are the most important charged residues on PC for its interactions with cyt f.
The trend of the lower cluster being more effective is also observed for double charge-change mutations (Table 2). The mutant E43A + D44A, which includes the most inhibitory single mutants of the lower cluster, had an effect larger than the double mutations within the upper cluster (D59A + D61A). Mutation E43A + D61A had the same effect (within error) as the double mutation of the lower cluster, but is more effective than the upper-cluster double mutant. This may be due to the presence of E43A. Quadruple charge-change mutations (E43K + D44K and D59K + D61K) showed an almost eightfold decrease in the interaction rates. This indicates that the negative fields of the two clusters are very important in PC-cyt f interactions and any mutation that changes the charge state of the two clusters impairs the interactions.
As can be seen in Table 3, E43, D44, and D53 (lower-cluster residues) were in close contact with more than two residues on cyt f per complex. In contrast, D59 and D61 (upper-cluster residues) had 1.3 and 0.61 contacts per complex, respectively. This again confirms the importance of the lower cluster over the upper one.
As depicted in Fig. 5, the overall orientation of PC with respect to cyt f did not change in all of the mutant complexes compared to the wild-type, but the uniformity of the complexes among the inhibitory mutants was decreased. Interestingly, PC showed less uniformity in the complexes formed by the mutants of the key residues in the lower cluster than the complexes formed by PC mutants of the upper cluster. This is another indication that the lower cluster is more important in the interactions of the two proteins. As the extent of inhibition observed for the mutants decreased, the PC positions became more uniform. This is evident in R57A complexes (that had a stimulatory effect), which are more uniform than the wild-type complexes. This observation signifies that strengthening the PC's negative electrostatic field (by eliminating the positive residues) not only increased the rate of complex formation, but also improved the homogeneity among the complexes formed.
Cyt c6-cyt f interactions
Cyt c6 is only present in some algae and cyanobacteria (Kerfeld and Krogmann, 1998), although a cyt c6-like protein in a higher plant (Arabidopsis) has been recently reported (Gupta et al., 2002). There are no experimental mutation data available for cyt c6-cyt f interactions in algae with which we can compare our results. However, our work can be used as a guide for the future experimental work. The inhibition pattern for the cyt c6-cyt f mutant interactions was very similar to the PC-cyt f mutant interactions. The single charge-change mutations in both of these two proteins could be divided into similar classes with comparable interaction rates (Tables 1 and 4).
In contrast to PC, none of the charged residues on cyt c6 are completely conserved in the algal and cyanobacterial sequences available (Pearson, 2000). However, if one only considers algal sequences, residues D41, E47, and E71 are completely conserved. Nevertheless, in all of the algal and cyanobacterial sequences available, there are acidic residues in positions 69, 70, 71, 73, and 74 (Pearson, 2000). In C. reinhardtii, mutations E69A, E70A, and E71A showed highly inhibitory effects, whereas the effects of mutations D41A and E47A were moderate (Table 4). Similar to PC, cyt c6-E69A and E70A, mutants of two of the residues that correspond to the lower cluster on PC (Ullmann et al., 1997a), showed more inhibition than any of the mutations of residues corresponding to the upper cluster on PC (D41, E47, and E54; Ullmann et al., 1997a), indicating their importance in cyt f-cyt c6 interactions. It is also evident in Table 3 that E71 and E70, two key members of cyt c6's lower cluster, have more contacts than E54 (the only upper-cluster residue in this table with significant contacts). Even D2, a residue close to the cyt c6 lower cluster, had more close contacts than E54. K29, K33, and K57 whose mutations stimulated the interactions of the two proteins, are >90% conserved in the algal and cyanobacterial sequences available (Pearson, 2000).
As depicted in Fig. 6 D, in contrast to PC (whose key acidic residues are facing toward cyt f; Fig. 4 A), most of the acidic residues on cyt c6 whose mutations had an inhibitory effect (Table 4) are not facing toward the cyt f heme. With respect to cyt f, cyt c6 is positioned in such a way that these residues are mostly on the side of the cyt c6 molecule with an inclination toward cyt f (Fig. 6, B–D). This might be due to the fact that cyt c6 complexes are not uniform (Fig. 7). However, this is unlikely because, as can be seen in Fig. 7 A, the overall orientation of cyt c6 with respect to cyt f is the same. Cyt c6 docked on cyt f with its heme plane almost perpendicular to the heme plane of cyt f, whereas in different complexes it seemed that cyt c6 had different rotation angles around the normal vector of the cyt f heme plane (Fig. 7). A look at Fig. 1, in which the orientations of the proteins are the same as in Figs. 4 A and 6 A, might clarify this difference. As can be seen, in PC, the position of the upper- and lower-cluster acidic residues facing toward cyt f allows for maximum electrostatic interactions with cyt f's positive field. However, for cyt c6, considering its heme location, a lateral positioning of its key negative residues (with an inclination toward cyt f) would permit the maximum electrostatic interactions with cyt f.
One main difference between electrostatic contacts on PC and those on cyt c6 is that cyt c6 comes closer to a larger number of residues on cyt f than does PC (Table 5). Notably, cyt c6 makes contact with residues K58, D68, K121, K122, R156, D162, K164, and K207 on cyt f (in more than half of the total number of complexes formed), which are not involved considerably in interactions with PC. Conversely, cyt f-E187 has contact with PC in more than half of the total number of complexes formed, but does not have any contacts with cyt c6. In other words, the cyt c6-cyt f electrostatic contacts were more varied than the PC-cyt f contacts, consistent with PC complexes being more homogeneous than cyt c6 complexes. This observation also implied that binding sites for PC and cyt c6 on cyt f were different.
The reason for the lack of uniformity in the cyt c6-cyt f complexes compared to the PC-cyt f complexes
Previous results using the Fe-Fe distance as the reaction criterion (Gross and Pearson, 2003) demonstrated that cyt c6 complexes were at least as uniform as the PC ones, but here, using a heme-heme distance as the criterion, we observed a different result. Neither wild-type nor any of the mutations resulted in uniform complexes; even K29A complexes (which had a stimulatory effect) are not uniform (Fig. 7).
Since the heme ring is a possible route for electron transport and the orientation of the hemes with respect to each other is important in electron transfer we decided to use the heme-heme distance as the criterion in the case of cyt c6-cyt f interactions. The program MacroDox considers the surface features of the two proteins plus the position of their charged residues to form complexes. In PC-cyt f interactions, using only two atoms (Fe-Cu distance) as the criterion resulted in complexes with both minimum Cu-Fe distance and optimum possible contacts between the negatively charged residues on PC and positively charged residues on cyt f (Table 3). In cyt c6-cyt f interactions, using four atoms on each protein (four carbon atoms at the heme corners of both cyt f and cyt c6) as the criteria resulted in complexes that had a minimum distance for any pair of these atoms on the two proteins, and also had optimum electrostatic contacts (Table 3). The fact that the cyt c6 heme is exposed to the surface at two locations (Fig. 1) would allow for these different possible complexes. In other words, in PC-cyt f interactions, the two-atom criterion, rather than the eight-atom criteria, may assist in obtaining more uniform complexes by reducing the degrees of freedom. To check for this, we made a table of electrostatic close contacts for the wild-type cyt c6-cyt f interactions using the Fe-Fe distance as the criterion (data not shown). We observed that using this two-atom criterion resulted in less diverse contacts than the heme-heme criterion, confirming our hypothesis. Note, however, that the calculated interaction rate was very close to the heme-heme simulations. This was also the case when we used structure B in the crystal structure of C. reinhardtii cyt f interacting with the cyt c6 using both the heme-heme and Fe-Fe criteria (data not shown).
Nevertheless, the fact that both of these criteria (Fe-Fe and heme-heme distances) resulted in similar values for the interaction rates implies that variant complexes may also be as good as the uniform ones for proper electron transfer. It appears that to have a sufficient interaction rate, cyt c6 does not need to have fixed orientation complexes with respect to cyt f. It may have multiple orientations, which might take less time to form compared to a fixed orientation and still be sufficient for electron transfer. This agrees with the suggestion of Crowley and Ubbink (2003) for the transient nature of the complex formation.
Different binding sites and orientations for PC and cyt c6 on cyt f
The charged residues on cyt f that interacted with PC were fewer in number than those that interacted with cyt c6 (Table 5). The positions of charged residues on cyt f that were in close contact with charged residues on PC or cyt c6 in more than half of the total number of complexes formed are shown in Fig. 8. As can be seen, there is a difference between the binding sites for PC and cyt c6 on the cyt f molecule. Charged residues involved in PC-cyt f interactions are, for the most part, located on the cyt f small domain (Fig. 8). In contrast, charged residues involved in cyt c6-cyt f interactions are mostly located on the cyt f large domain, forming a line across the cyt f heme, except for cyt f-K207. Fig. 8 and Fig. 4, B and D, show that H87 on PC is close to the cyt f heme but the upper- and lower-cluster anionic residues are inclined toward the cyt f small domain. In contrast, Fig. 8 and Fig. 6 C show that cyt c6 docks horizontally on top of the cyt f heme, oriented at an ∼90° counterclockwise rotation with respect to PC, covering a larger area of the cyt f molecule (and hence covering a larger number of charged residues on cyt f).
FIGURE 8.
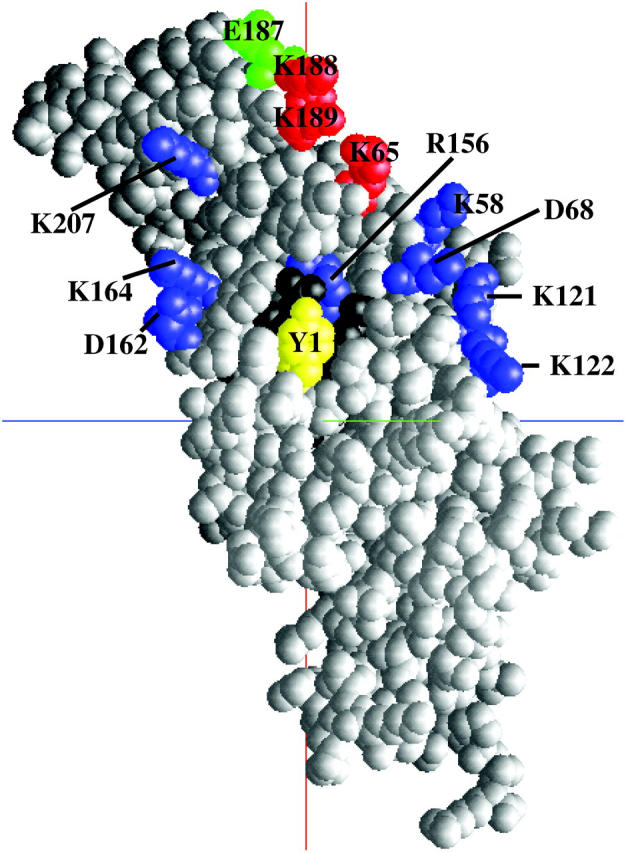
Charged residues on cyt f that came into close contact with charged residues on PC or cyt c6 in more than half of the total number of complexes formed. Residues involved only in PC interactions are in green (E187); residues involved only in cyt c6 interactions are in blue (K58, D68, K121, K122, R156, D162, K164, and K207); residues involved in both interactions are in red (K65, K188, and K189). The cyt f heme is shown in black.
CONCLUSION
Systematic mutation of the charged residues on both PC and cyt c6 confirmed the electrostatic nature of their interactions with cyt f. Our results indicate that the lower-cluster residues on PC, particularly E43 and D44, are more important than the upper-cluster residues for interactions with cyt f. There are no experimental mutation data available for cyt c6-cyt f interactions in algae. Our work is the first to provide such information, which may be useful in guiding future experimental work. Our simulations showed that the acidic residues on cyt c6 that correspond to the PC's lower cluster were more important than those corresponding to the upper cluster. The different binding sites and orientations of PC and cyt c6 molecules on cyt f were also identified, plus the PC or cyt c6 residues that are involved in interactions with cyt f. These results demonstrate the need for more experimental single-mutation data to clarify the differences between the two clusters (especially in the case of cyt c6). The mutations that stimulated the interactions may be useful in cocrystallization of the complexes for further structural studies.
The comparison between computational values and available experimental data showed overall good agreement, indicating the utility and the power of BD simulations in mutagenesis studies.
Acknowledgments
The authors thank Dr. Dan Davis and Christine Neal for their careful reading of the manuscript.
E.J.H. was supported by the Department of Biochemistry and the Biophysics program at The Ohio State University.
References
- Anderson, G. P., D. G. Sanderson, C. H. Lee, S. Durell, L. B. Anderson, and E. L. Gross. 1987. The effect of ethylene diamine chemical modification of plastocyanin on the rate of cytochrome f oxidation and P-700+ reduction. Biochim. Biophys. Acta. 894:386–398. [DOI] [PubMed] [Google Scholar]
- Bergkvist, A., M. Ejdeback, M. Ubbink, and B. G. Karlsson. 2001. Surface interaction in the complex between cytochrome f and the E43Q/D44N and E59K/E60Q plastocyanin double mutants as determined by 1H-NMR chemical shift analysis. Protein Sci. 10:2623–2626. [DOI] [PMC free article] [PubMed] [Google Scholar]
- Berman, H. M., J. Westbrook, Z. Feng, G. Gilliland, T. N. Bhat, H. Weissig, L. N. Shindyalov, and P. E. Bourne. 2000. The Protein Data Bank. Nucleic Acids Res. 28:235–242. [DOI] [PMC free article] [PubMed] [Google Scholar]
- Chi, Y. I., L. S. Huang, Z. Zhang, J. G. Fernandez-Velasco, and E. A. Berry. 2000. X-ray structure of a truncated form of cytochrome f from Chlamydomonas reinhardtii. Biochemistry. 39:7689–7701. [DOI] [PubMed] [Google Scholar]
- Crowley, P. B., and M. Ubbink. 2003. Close encounters of the transient kind: protein interactions in the photosynthetic redox chain investigated by NMR spectroscopy. Acc. Chem. Res. 36:723–730. [DOI] [PubMed] [Google Scholar]
- Cui, M., J. Shen, J. M. Briggs, W. Fu, J. Wu, Y. Zhang, X. Luo, Z. Chi, R. Ji, H. Jiang, and K. Chen. 2002. Brownian dynamics simulations of the recognition of the scorpion toxin P05 with small-conductance calcium-activated potassium channels. J. Mol. Biol. 318:417–428. [DOI] [PubMed] [Google Scholar]
- De Rienzo, F., R. R. Gabdoulline, M. C. Menziani, P. G. De Benedetti, and R. C. Wade. 2001. Electrostatic analysis and Brownian dynamics simulation of the association of plastocyanin and cytochrome f. Biophys. J. 81:3090–3104. [DOI] [PMC free article] [PubMed] [Google Scholar]
- Durell, S. R., J. K. Labanowski, and E. L. Gross. 1990. Modeling the electrostatic potential field of plastocyanin. Arch. Biochem. Biophys. 277:241–254. [DOI] [PubMed] [Google Scholar]
- Ejdeback, M., A. Bergkvist, B. G. Karlsson, and M. Ubbink. 2000. Side-chain interactions in the plastocyanin-cytochrome f complex. Biochemistry. 39:5022–5027. [DOI] [PubMed] [Google Scholar]
- Elcock, A. H., R. R. Gabdoulline, R. C. Wade, and J. A. McCammon. 1999. Computer simulation of protein-protein kinetics: acetylcholinesterase-fasciculin. J. Mol. Biol. 291:149–162. [DOI] [PubMed] [Google Scholar]
- Ermark, D. L., and J. C. McCammon. 1978. Brownian dynamics with hydrodynamic interactions. J. Phys. Chem. 69:1352–1360. [Google Scholar]
- Gabdoulline, R. R., and J. C. Wade. 2001. Protein-protein associations: investigation of factors influencing association rates by Brownian dynamics simulations. J. Mol. Biol. 9:1139–1155. [DOI] [PubMed] [Google Scholar]
- Gabdoulline, R. R., and R. C. Wade. 1996. Effective charges for macromolecules in solvent. J. Phys. Chem. 100:3868–3878. [Google Scholar]
- Gong, X. S., J. Q. Wen, N. E. Fisher, S. Young, C. J. Howe, D. S. Bendall, and J. C. Gray. 2000. The role of individual lysine residues in the basic patch on turnip cytochrome f for the electrostatic interactions with plastocyanin in vitro. Eur. J. Biochem. 267:3461–3468. [DOI] [PubMed] [Google Scholar]
- Gross, E. L. 1996. Plastocyanin: structure, location, diffusion, and electron transfer mechanisms. In Oxygenic Photosynthesis: the Light Reactions. D. Ort and C. Yocum, editors. Kluwer Academic Publishers, Dordrecht, The Netherlands. 413–429.
- Gross, E. L. 2004. A Brownian dynamics study of the interaction of Phormidium laminosum plastocyanin with Phormidium laminosum cytochrome f. Biophys. J. 87:2043–2059. [DOI] [PMC free article] [PubMed] [Google Scholar]
- Gross, E. L., and D. C. Pearson, Jr. 2003. Brownian dynamics simulations of the interaction of Chlamydomonas cytochrome f with plastocyanin and cytochrome c6. Biophys. J. 85:2055–2068. [DOI] [PMC free article] [PubMed] [Google Scholar]
- Gupta, R., Z. He, and S. Luan. 2002. Functional relationship of cytochrome c6 and plastocyanin in Arabidopsis. Nature. 417:567–571. [DOI] [PubMed] [Google Scholar]
- Harvey, S. C. 1989. Treatment of electrostatic effects in macromolecular modeling. Proteins. 5:78–92. [DOI] [PubMed] [Google Scholar]
- Hope, A. B. 2000. Electron transfers amongst cytochrome f, plastocyanin and photosystem I: kinetics and mechanisms. Biochim. Biophys. Acta. 1456:5–26. [DOI] [PubMed] [Google Scholar]
- Kannt, A., S. Young, and D. S. Bendall. 1996. The role of acidic residues of plastocyanin in its interaction with cytochrome f. Biochim. Biophys. Acta. 1277:115–126. [PubMed] [Google Scholar]
- Kerfeld, C. A., H. P. Anwar, R. Interrante, S. Merchant, and T. O. Yeates. 1995. The structure of chloroplast cytochrome c6 at 1.9 Å resolution: evidence for functional oligomerization. J. Mol. Biol. 250:627–647. [DOI] [PubMed] [Google Scholar]
- Kerfeld, C. A., and D. W. Krogmann. 1998. Photosynthetic cytochromes c in cyanobacteria, algae, and plants. Annu. Rev. Plant Physiol. Plant Mol. Biol. 49:397–425. [DOI] [PubMed] [Google Scholar]
- Kurisu, G., H. Zhang, J. L. Smith, and W. A. Cramer. 2003. Structure of the cytochrome b6f complex of oxygenic photosynthesis: tuning the cavity. Science. 302:1009–1014. [DOI] [PubMed] [Google Scholar]
- Lee, B. H., T. Hibino, T. Takabe, P. J. Weisbeek, and T. Takabe. 1995. Site-directed mutagenetic study on the role of negative patches on silene plastocyanin in the interactions with cytochrome f and photosystem I. J. Biochem. (Tokyo). 117:1209–1217. [DOI] [PubMed] [Google Scholar]
- Martinez, S. E., D. Huang, M. Ponomarev, W. A. Cramer, and J. L. Smith. 1996. The heme redox center of chloroplast cytochrome f is linked to a buried five-water chain. Protein Sci. 5:1081–1092. [DOI] [PMC free article] [PubMed] [Google Scholar]
- Martinez, S. E., D. Huang, A. Szczepaniak, W. A. Cramer, and J. L. Smith. 1994. Crystal structure of the chloroplast cytochrome f reveals a novel cytochrome fold and unexpected heme ligation. Structure. 2:95–105. [DOI] [PubMed] [Google Scholar]
- Matthew, J. B. 1985. Electrostatic effects in proteins. Annu. Rev. Biophys. Chem. 14:387–417. [DOI] [PubMed] [Google Scholar]
- McCammon, J. A., and S. C. Harvey. 1987. Dynamics of Proteins and Nucleic Acids. Cambridge University Press, Cambridge, UK.
- Merchant, S., and L. Bogorad. 1986. Regulation by copper of the expression of plastocyanin and cytochrome c552 in Chlamydomonas reinhardtii. Mol. Cell. Biol. 6:462–469. [DOI] [PMC free article] [PubMed] [Google Scholar]
- Meyer, T. E., Z. G. Zhao, M. A. Cusanovich, and G. Tollin. 1993. Transient kinetics of electron transfer from a variety of c-type cytochromes to plastocyanin. Biochemistry. 32:4552–4559. [DOI] [PubMed] [Google Scholar]
- Morand, L. Z., M. K. Frame, K. K. Colvert, D. A. Johnson, D. W. Krogmann, and D. J. Davis. 1989. Plastocyanin cytochrome f interaction. Biochemistry. 28:8039–8047. [DOI] [PubMed] [Google Scholar]
- Moser, C. C., J. M. Keske, K. Warncke, R. S. Farid, and P. L. Dutton. 1992. Nature of biological electron transfer. Nature. 355:796–802. [DOI] [PubMed] [Google Scholar]
- Moser, C. C., C. C. Page, R. Farid, and P. L. Dutton. 1995. Biological electron transfer. J. Bioenerg. Biomembr. 27:263–274. [DOI] [PubMed] [Google Scholar]
- Nelson, N., D. C. Pearson, Jr., and E. L. Gross. 1999. The interaction of plastocyanin with cytochrome f: A Brownian dynamics study. In Photosynthesis: Mechanisms and Effects, Vol. 3. G. Garab, editor. Kluwer Academic Publishers, Dordrecht, The Netherlands. 1493–1498.
- Nicholls, A., and B. Honig. 1991. A rapid finite-difference algorithm, utilizing successive over-relaxation to solve the Poisson-Boltzmann equation. J. Comput. Chem. 12:435–445. [Google Scholar]
- Niwa, S., H. Ishikawa, and S. Nikai. 1980. Electron transfer reactions between cytochrome f and plastocyanin from Brassica komatsuna. J. Biochem. (Tokyo). 88:1177–1183. [DOI] [PubMed] [Google Scholar]
- Northrup, S. H. 1996. Theoretical simulation of protein-protein interactions. In Cytochrome c: A Multidisciplinary Approach. R. A. Scott and A. G. Mauk, editors. University Science Publishers, Sausalito, CA. 543–570.
- Northrup, S. H. 1999. MacroDox v.2.3.1: Software for the Prediction of Macromolecular Interaction. Tennessee Technological University, Cookeville, TN. http://pirn.chem.tntech.edu/macrodox.html
- Northrup, S. H., J. O. Boles, and J. C. Reynolds. 1987a. Electrostatic effects in the Brownian dynamics of association and orientation of heme proteins. J. Phys. Chem. 91:5991–5998. [Google Scholar]
- Northrup, S. H., J. O. Boles, and J. C. Reynolds. 1988. Brownian dynamics of cytochrome c and cytochrome c peroxidase association. Science. 241:67–70. [DOI] [PubMed] [Google Scholar]
- Northrup, S. H., J. A. Luton, J. O. Boles, and J. C. Reynolds. 1987b. Brownian dynamics simulation of protein association. J. Comput. Aided Mol. Des. 1:291–311. [DOI] [PubMed] [Google Scholar]
- Northrup, S. H., K. A. Thomasson, C. M. Miller, P. D. Barker, L. D. Eltis, J. G. Guillemette, S. C. Inglis, and A. G. Mauk. 1993. Effect of charged amino acid mutations on the bimolecular kinetics of reduction of yeast iso-1-ferricytochrome c by bovine ferrocytochrome b5. Biochemistry. 32:6613–6623. [DOI] [PubMed] [Google Scholar]
- Pearson, D. C., Jr. 2000. Brownian dynamics study of the interaction between cytochrome f and mobile electron transfer proteins. PhD thesis. The Ohio State University, Columbus, OH.
- Pearson, D. C., Jr., and E. L. Gross. 1998. Brownian dynamics study of the interaction between plastocyanin and cytochrome f. Biophys. J. 75:2698–2711. [DOI] [PMC free article] [PubMed] [Google Scholar]
- Pearson, D. C., Jr., E. L. Gross, and E. S. David. 1996. The electrostatic properties of cytochrome f: implications for docking with plastocyanin. Biophys. J. 71:64–76. [DOI] [PMC free article] [PubMed] [Google Scholar]
- Qin, L., and N. M. Kostic. 1993. Importance of protein rearrangement in the electron-transfer reaction between the physiological partners cytochrome f and plastocyanin. Biochemistry. 32:6073–6080. [DOI] [PubMed] [Google Scholar]
- Redinbo, M. R., D. Cascio, M. K. Choukair, D. Rice, S. Merchant, and T. O. Yeates. 1993. The 1.5-Å crystal structure of plastocyanin from the green alga Chlamydomonas reinhardtii. Biochemistry. 32:10560–10567. [DOI] [PubMed] [Google Scholar]
- Sigfridsson, K. 1998. Plastocyanin, an electron-transfer protein. Photosynth. Res. 57:1–28. [Google Scholar]
- Soriano, G. M., M. V. Pomamarev, R. A. Piskorowski, and W. A. Cramer. 1998. Identification of the basic residues of cytochrome f responsible for electrostatic docking interactions with plastocyanin in vitro: relevance to the electron transfer reaction in vivo. Biochemistry. 37:15120–15128. [DOI] [PubMed] [Google Scholar]
- Soriano, G. M., M. V. Ponomarev, G. S. Tae, and W. A. Cramer. 1996. Effect of the interdomain basic region of cytochrome f on its redox reactions in vivo. Biochemistry. 35:14590–14598. [DOI] [PubMed] [Google Scholar]
- Stroebel, D., Y. Choquet, J. L. Popot, and D. Picot. 2003. An atypical heme in the cytochrome b6f complex. Nature. 426:413–418. [DOI] [PubMed] [Google Scholar]
- Takabe, T., H. Ishikawa, S. Niwa, and Y. Tanaka. 1984. Electron transfer reactions of chemically modified plastocyanin with P700 and cytochrome f. Importance of local charges. J. Biochem. (Tokyo). 96:385–393. [DOI] [PubMed] [Google Scholar]
- Takabe, T., K. Takenaka, H. Kawamura, and Y. Beppu. 1986. Charges on proteins and distances of electron of electron transfer in metalloprotein redox reactions. J. Biochem. (Tokyo). 99:833–840. [DOI] [PubMed] [Google Scholar]
- Takenaka, K., and T. Takabe. 1984. Importance of local positive charges on cytochrome f for electron transfer to plastocyanin and potassium ferricyanide. J. Biochem. (Tokyo). 96:1813–1821. [DOI] [PubMed] [Google Scholar]
- Ubbink, M., M. Ejdeback, B. G. Karlsson, and D. S. Bendall. 1998. The structure of the complex of plastocyanin and cytochrome f, determined by paramagnetic NMR and restrained rigid-body molecular dynamics. Structure. 6:323–335. [DOI] [PubMed] [Google Scholar]
- Ullmann, G. M., M. Hauswald, A. Jensen, N. M. Kostic, and E. W. Knapp. 1997a. Comparison of the physiologically equivalent proteins cytochrome c6 and plastocyanin on the basis of their electrostatic potentials. Tryptophan 63 in cytochrome c6 may be isofunctional with tyrosine 83 in plastocyanin. Biochemistry. 36:16187–16196. [DOI] [PubMed] [Google Scholar]
- Ullmann, G. M., E. W. Knapp, and N. M. Kostic. 1997b. Computational simulation and analysis of dynamic association between plastocyanin and cytochrome f. Consequences for the electron-transfer reaction. J. Am. Chem. Soc. 119:42–52. [Google Scholar]
- Warwicker, J., and H. C. Watson. 1982. Calculation of the electric potential in the active site cleft due to alpha-helix dipoles. J. Mol. Biol. 157:671–679. [DOI] [PubMed] [Google Scholar]
- Zhou, J., J. G. Fernandez-Velasco, and R. Malkin. 1996. N-terminal mutants of chloroplast cytochrome f: Effect on redox reactions and growth in Chlamydomonas reinhardtii. J. Biol. Chem. 271:6225–6232. [DOI] [PubMed] [Google Scholar]