Abstract
This paper describes insig-2, a second protein of the endoplasmic reticulum that blocks the processing of sterol regulatory element-binding proteins (SREBPs) by binding to SCAP (SREBP cleavage-activating protein) in a sterol-regulated fashion, thus preventing it from escorting SREBPs to the Golgi. By blocking this movement, insig-2, like the previously described insig-1, prevents the proteolytic processing of SREBPs by Golgi enzymes, thereby blocking cholesterol synthesis. The sequences of human insig-1 and -2 are 59% identical. Both proteins are predicted to contain six transmembrane helices. The proteins differ functionally in two respects: (i) production of insig-1, but not insig-2, in cultured mammalian cells requires nuclear SREBPs; and (ii) at high levels of expression, insig-1, but not insig-2, can block SCAP movement in the absence of exogenous sterols. The combined actions of insig-1 and -2 permit feedback regulation of cholesterol synthesis over a wide range of sterol concentrations.
The gated movement of sterol regulatory element-binding proteins (SREBPs) from the endoplasmic reticulum (ER) to the Golgi complex is the central event in lipid homeostasis in animal cells (1–4). SREBPs are membrane-bound transcription factors that activate genes encoding enzymes required for synthesis of cholesterol, unsaturated fatty acids, triglycerides, and phospholipids. Immediately after their synthesis on ER membranes, SREBPs bind to SCAP (SREBP cleavage-activating protein), a polytopic membrane protein that contains a sterol-sensing domain. In sterol-depleted cells, SCAP escorts SREBPs to the Golgi where the SREBPs are processed by two membrane-bound proteases (site-1 protease and site-2 protease) that release the active portions of SREBPs into the cytosol so that they can enter the nucleus. In sterol-overloaded cells, SCAP undergoes a conformational change mediated through its membranous sterol-sensing domain (5). As a result, SCAP is retained in the ER, abrogating SREBP processing and decreasing lipid synthesis. Under certain conditions unsaturated fatty acids can also block SREBP processing, but the mechanism is not known (6).
Recently, we identified insig-1 as an ER protein that binds SCAP and facilitates the sterol-mediated retention of the SCAP/SREBP complex in the ER (7). Addition of sterols to cultured cells causes the SCAP/SREBP complex to bind to insig-1 as determined by coimmunoprecipitation and blue native gel electrophoresis techniques. This binding does not occur when SCAP harbors a point mutation in the sterol-sensing domain (Y298C) that abolishes sterol regulation.
Under certain conditions, the total amount of insig protein can be rate-limiting for the retention of the SCAP/SREBP complex in the ER. Thus, when SCAP is overexpressed by transfection, sterols no longer block its movement to the Golgi, apparently because insig proteins have become saturated (8). Overexpression of insig-1 restores sterol-mediated regulation (7). These observations led to the conclusion that sterol-mediated SCAP retention depends on binding to insig-1 or related insig proteins. When the amount of insig-1 exceeds the amount of SCAP, SREBP processing is blocked even in sterol-depleted cells.
Here, we report that vertebrate genomes contain a gene that encodes a protein, designated insig-2, that is a close homolog of insig-1. We demonstrate that insig-2 can also bind the SCAP/SREBP complex and cause its retention in the ER in a sterol-dependent fashion. Insig-2 differs from insig-1 in two important respects: (i) insig-1, but not insig-2, depends on nuclear SREBPs for its expression; and (ii) the action of insig-2 shows an absolute requirement for sterols. Even at high levels of expression, insig-2 does not cause ER retention of the SCAP/SREBP complex unless sterols are present. The combined actions of insig-1 and -2 may allow fine-tuning of SREBP processing under conditions of widely varying sterol supply and demand.
Materials and Methods
Materials used in this study and methods (cDNA cloning of insig-1 and -2, construction of expression plasmids, and Northern blot analysis) may be found in Supporting Materials and Methods, which is published as supporting information on the PNAS web site, www.pnas.org.
Plasmids.
The following recombinant expression plasmids have been described: pTK-HSV-BP-2 and pTK-HSV-BP-1a, encoding wild-type HSV-tagged human SREBP-2 and human SREBP-1a, respectively, under control of the weak thymidine kinase (TK) promoter (9); pCMV-SCAP and pCMV-SCAP(Y298C), encoding wild-type and mutant hamster SCAP, respectively, under control of the strong cytomegalovirus (CMV) promoter (10); pVSVG-T7, encoding the G protein from the ts045 mutant strain of vesicular stomatitis virus (VSV) (11). pCMV-Insig-1-Myc and pCMV-Insig-2-Myc encode full-length versions of human insig-1 and human insig-2, respectively, followed by six tandem copies of a c-Myc epitope tag (see Supporting Materials and Methods for details of plasmid construction).
Tissue Culture Media.
Medium A contains a 1:1 mixture of Ham's F-12 medium and Dulbecco's modified Eagle's medium containing 100 units/ml penicillin and 100 μg/ml streptomycin sulfate. Medium B contains medium A supplemented with 5% (vol/vol) FCS, 5 μg/ml cholesterol, 1 mM sodium mevalonate, and 20 μM sodium oleate. Medium C contains medium A supplemented with 5% (vol/vol) newborn calf lipoprotein-deficient serum, 50 μM sodium compactin, and 50 μM sodium mevalonate.
Cell Culture.
Cells were grown in monolayer at 37°C in an atmosphere of 8–9% CO2. Chinese hamster ovary (CHO)-7 cells are a clone of CHO-K1 cells selected for growth in lipoprotein-deficient serum (12). CHO/pS2P cells are a clone of CHO-7 cells stably transfected with pCMV-HSV-S2P, a plasmid that encodes human site-2 protease under control of the CMV promoter (13). M19 cells (deficient in site-2 protease), SRD-12B cells (deficient in site-1 protease), and SRD-13A cells (deficient in SCAP) are previously described cholesterol and unsaturated fatty acid auxotrophs derived from γ-irradiated CHO-K1 cells (M19 cells) or CHO/pS2P cells (SRD-12B and SRD-13A cells) (13–15). N-BP1a and N-BP2 cells are lines of M19 cells transfected with plasmids encoding the nuclear forms of SREBP-1a and SREBP-2, respectively, under control of the ecdysone-inducible promoter (16). CHO/pInsig-1-Myc cells are a clone of CHO-7 cells stably transfected with pCMV-Insig-1-Myc, a plasmid that encodes human insig-1 under control of the CMV promoter (7). CHO/pInsig-2-Myc cells were generated by transfection of CHO-7 cells with pCMV-Insig-2-Myc, followed by selection in medium B containing 700 μg/ml G418. Surviving colonies were isolated with cloning cylinders, expanded, and screened for expression of insig-2.
CHO-K1 cells were maintained in medium A supplemented with 5% FCS. CHO-7 cells were maintained in medium A supplemented with 5% newborn calf lipoprotein-deficient serum. CHO/pS2P cells were maintained in medium A supplemented with 5% lipoprotein-deficient serum and 500 μg/ml G418. N-BP1a and N-BP2 cells were maintained in medium B supplemented with 750 μg/ml G418 and 500 μg/ml Zeocin. M19, SRD-12B, and SRD-13A cells were maintained in medium B. CHO/pInsig-1-Myc and CHO/pInsig-2-Myc cells were maintained in medium B containing 500 μg/ml G418.
Transient Transfection of SRD-13A Cells.
On day 0, SRD-13A cells were set up for experiments at 4 × 10⁵ cells per 60-mm dish or 8 × 10⁵ cells per 100-mm dish in medium B. On day 2, the cells were transfected with the indicated plasmids by using FuGENE 6 reagent (Roche Molecular Biochemicals) as described (15). The total amount of DNA in each transfection was adjusted to 5–6 μg per dish by addition of pTK mock vector and/or pcDNA3 mock vector. After transfection, cells were incubated at 37°C for 12–16 h in medium A supplemented with 5% FCS. On day 3, the cells were switched to medium C containing 1% (wt/vol) hydroxypropyl-β-cyclodextrin. After incubation at 37°C for 1 h, cells were washed twice with PBS and switched to medium C in the absence or presence of sterols added in ethanol [final ethanol concentration, 0.5% (vol/vol)]. After incubation for 4 h, cells were washed twice with PBS and harvested for preparation of cell extracts for immunoblot analysis and immunoprecipitation (see below).
Immunoblot Analysis.
The pellets from two 60-mm dishes of transfected SRD-13A cells were suspended in 0.2 ml of buffer A [10 mM Tris⋅HCl (pH 7.4)/100 mM NaCl/1% (wt/vol) SDS] containing protease inhibitors (10 μg/ml leupeptin/5 μg/ml pepstatin A/2 μg/ml aprotinin/25 μg/ml N-acetyl-leucinal-leucinal-norleucinal) as described (11). Protein concentration of the extracts was determined using the BCA kit (Pierce), after which the extracts were mixed with 5× SDS loading buffer [150 mM Tris⋅HCl (pH 6.8)/15% SDS/25% (vol/vol) glycerol/0.02% (wt/vol) bromophenol blue/12.5% (vol/vol) 2-mercaptoethanol]. After boiling for 5 min, the extracts were subjected to SDS/PAGE, transferred to nitrocellulose filters, and subjected to immunoblot analysis. Gels were calibrated with prestained molecular weight markers (Bio-Rad), and antibodies were used at the following concentrations: anti-SREBP-2 IgG-1D2, 1–5 μg/ml; anti-SREBP-1 IgG-2A4, 1 μg/ml; anti-SCAP IgG-9D5, 5 μg/ml; anti-Myc IgG-9E10, 1 μg/ml; and anti-mouse IgG (Jackson ImmunoResearch), 0.2 μl/ml. Bound antibodies were visualized by chemiluminescence using the Supersignal Substrate System (Pierce) according to manufacturer's instructions. Filters were exposed to Kodak X-Omat Blue XB-1 films at room temperature for 1–60 s.
Immunoprecipitation.
The pellets from two 100-mm dishes of transfected SRD-13A cells were suspended in 1 ml of buffer B [50 mM Hepes-KOH (pH 7.4)/100 mM NaCl/1.5 mM MgCl2/0.1% (vol/vol) Nonidet P-40] containing protease inhibitors (see above). Cell lysates were prepared and immunoprecipitation was performed as described (10) with the following modifications. Precleared lysates were rotated for 16 h at 4°C with 20 μg of either control nonimmune IgG or polyclonal anti-Myc IgG together with 50 μl of protein A/G agarose beads (Santa Cruz Biotechnology). The resulting supernatants after centrifugation were mixed with 5× SDS loading buffer. The pelleted beads were washed for 15 min at 4°C with 1 ml of buffer B four times, and resuspended in 100 μl of buffer A containing protease inhibitors and mixed with 5× SDS loading buffer. Supernatants and pellets were boiled for 5 min, and subjected to SDS/PAGE and immunoblot analysis.
In Vitro Vesicle-Formation Assay.
The protocol used in this study was identical to that of figure 8 in Nohturfft et al. (11). Briefly, the 1.6 × 10⁴-g fraction of membranes was isolated from transfected hamster cells treated in the absence or presence of sterols and incubated with nucleoside triphosphates and rat liver cytosol to generate ER-derived transport vesicles, which then were separated from donor membranes by differential centrifugation. Vesicles and donor membranes were then subjected to SDS/PAGE and immunoblot analysis to measure incorporation of proteins into ER-derived transport vesicles.
Results
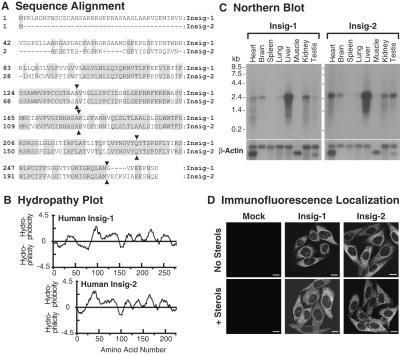
Fig. 1A compares the amino acid sequences of human insig-1 (7) and insig-2, the latter compiled from multiple EST clones (see Supporting Materials and Methods). Insig-2 differs from insig-1 primarily in the NH2-terminal sequence, which is much shorter in insig-2. Both proteins are hydrophobic with six postulated membrane-spanning helices (Fig. 1B). Insig-1 and -2 mRNAs are both expressed in multiple organs of the mouse, with especially high expression in the liver (Fig. 1C). Immunofluorescence studies of cells overexpressing epitope-tagged versions of both proteins show an ER distribution with no apparent change in the presence of sterols (Fig. 1D).
Figure 1.
Characteristics of human insig-1 and -2. (A) Amino acid sequence alignment. Identical residues are shaded. Junctions between exons are indicated by triangles. GenBank accession numbers for human insig-1 and -2 are AY112745 and AF527632, respectively. (B) Hydropathy plot. The residue-specific hydropathy index was calculated over a window of 18 residues (23) by using software from DNASTAR. (C) Northern blot analysis of insig-1 and -2 mRNAs in mouse tissues. Filters containing poly(A)+ RNA (2 μg per lane) from mouse tissues (CLONTECH) were hybridized with 32P-labeled probes against mouse insig-1 and mouse insig-2 (1.5 × 10⁶ cpm/ml for each probe) for 1 h at 68°C as described in Supporting Materials and Methods. Filters were exposed to Kodak X-Omat films with intensifying screens at −80°C for 18 h. The same filters were subsequently hybridized with a 32P-labeled probe against human β-actin (1.5 × 10⁶ cpm/ml) and exposed to film for 3 h at −80°C. (D) Immunofluorescence localization of human insig-1 and -2 in stably transfected CHO cells. On day 0, mock-transfected CHO-7 cells (Mock), CHO/pInsig-1-Myc cells (insig-1), and CHO/pInsig-2-Myc cells (insig-2) were seeded onto coverslips (4 × 10⁴ cells per 37-mm well) in medium B. On day 2, the cells were washed twice with PBS and switched to medium C in the absence (no sterols) or presence of 1 μg/ml of 25-hydroxycholesterol plus 10 μg/ml of cholesterol (+ sterols). On day 3, the cells were fixed, and indirect immunofluorescence was carried out as described (7). (Scale bars, 10 μm.)
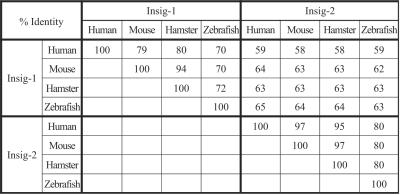
Insig-2 is more highly conserved than insig-1 among various vertebrate species (Fig. 2). The amino acid sequences of human and hamster insig-1 and -2 are 80% and 95% identical, respectively. Zebrafish and human insig-2 are 80% identical. Most of the variation occurs in the hydrophilic NH2- and COOH-terminal sequences.
Figure 2.
Amino acid sequence conservation among insig proteins from various species. Sequences of insig-1 and -2 from human, mouse, hamster, and zebrafish were aligned against each other by using the ALIGN program (www2.igh.cnrs.fr/bin/align-guess.cgi; ref. 24). The percentages of identical amino acids are shown. GenBank accession numbers: AY112745 (human insig-1); AF527630 (mouse insig-1); AF527628 (hamster insig-1); AF527626 (zebrafish insig-1); AF527632 (human insig-2); AF527631 (mouse insig-2); AF527629 (hamster insig-2); and AF527627 (zebrafish insig-2).
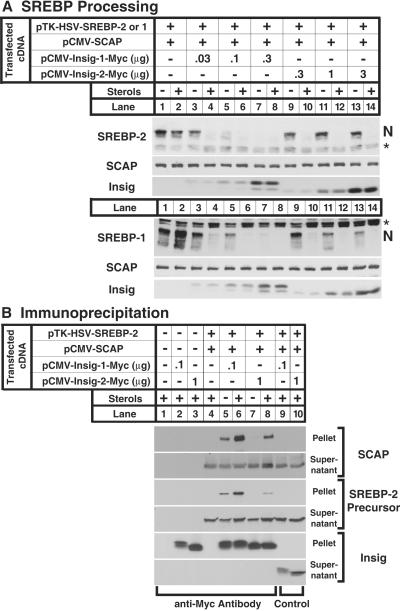
To test the function of insig-2, we used SRD-13A cells, a line of CHO cells that is deficient in SCAP, owing to mutations in both alleles (15). We transfected these cells transiently with a cDNA encoding SCAP under control of the strong CMV promoter, which overproduces SCAP (Fig. 3A Upper). The cells were also transfected with a cDNA encoding epitope-tagged SREBP-2, one of the two predominant isoforms of SREBP expressed in cultured cells (17), and either insig-1 or -2. The cells were incubated either in sterol-depleted conditions or sterol-overloaded conditions. Total cell extracts were subjected to SDS/PAGE and blotted with various antibodies. When SCAP was overexpressed, we observed the nuclear form of SREBP-2, and it did not decrease when sterols were added (lanes 1 and 2), indicating that the retention process was saturated by the excess SCAP. Expression of a small amount of insig-1 had no effect on nuclear SREBP-2 when sterols were absent, but it permitted strong inhibition when sterols were added (lanes 3 and 4). When higher amounts of insig-1 were expressed, we observed a reduction of nuclear SREBP-2 even in the absence of sterols (lanes 5–8). A different result was observed with insig-2. Expression of a low level of insig-2 restored sterol-dependent suppression of SREBP-2 processing (lanes 9 and 10). Even at high levels of expression, insig-2 continued to block SREBP-2 processing only in the presence of sterols (lanes 11–14). Throughout these experiments, we consistently observed that the insig-1 cDNA produced about 10-fold more protein than the insig-2 cDNA, even though both used the same CMV-driven expression vector and the same myc epitope tag. To achieve comparable protein expression levels, we transfected 10-fold more cDNA encoding insig-2 (see insig immunoblot in Fig. 3A). Insig-1 and -2 had the same effect on the processing of SREBP-1a that they had on SREBP-2 (Fig. 3A Lower).
Figure 3.
Actions of insig-1 and insig-2 in transfected hamster cells. (A) Restoration of sterol-mediated inhibition of SREBP-1 and -2 cleavage in cells overexpressing SCAP. On day 0, SRD-13A cells were set up in medium B at 4 × 10⁵ cells per 60-mm dish. On day 2, the cells were transfected with the indicated plasmids: 2 μg of pTK-HSV-SREBP-2 (Upper) or pTK-HSV-SREBP-1a (Lower), 1 μg of pCMV-SCAP, and the indicated amounts of pCMV-Insig-1-Myc or pCMV-Insig-2-Myc. On day 3, cells were switched to medium C containing 1% (wt/vol) hydroxypropyl-β-cyclodextrin and incubated for 1 h at 37°C. Cells were then washed twice with PBS and switched to medium C in the absence or presence of 1 μg/ml 25-hydroxycholesterol plus 10 μg/ml cholesterol (sterols). After incubation for 4 h, cells were harvested, and total cell extracts were prepared as described (11). Aliquots of extracts (50 μg) were subjected to SDS/PAGE and immunoblot analysis with IgG-1D2 (SREBP-2), IgG-2A4 (SREBP-1), IgG-9D5 (SCAP), and IgG-9E10 (insig) as indicated. N denotes the cleaved nuclear form of SREBP-2 or -1. Asterisk denotes a cross-reactive band. (B) Coimmunoprecipitation of insig-1 and -2 with SCAP and SREBP-2. On day 0, SRD-13A cells were set up in medium B at 8 × 10⁵ cells per 100-mm dish. On day 2, the cells were transfected as in A. On day 3, cells were treated as in A. After incubation for 4 h, cells were harvested for immunoprecipitation with polyclonal anti-Myc IgG (lanes 1–8) or control nonimmune IgG (lanes 9, 10) as described in Materials and Methods. Immunoprecipitated pellets (representing 0.25 dish of cells) and supernatants (0.05 dish of cells) were subjected to SDS/PAGE and immunoblot analysis with IgG-1D2 (SREBP-2), IgG-9D5 (SCAP), and IgG-9E10 (insig).
The coimmunoprecipitation experiment of Fig. 3B confirms that insig-2 binds to the SCAP/SREBP-2 complex only in the presence of sterols. Extracts of transfected cells were subjected to immunoprecipitation with an antibody against the myc epitope on insig-1 or -2. Pellets and supernatants were subjected to SDS/PAGE and blotted with various antibodies (Fig. 3B). When 0.1 μg of insig-1 plasmid was transfected, we observed coimmunoprecipitation of SCAP and the SREBP-2 precursor in the absence of sterols (lane 5), and this was increased by sterols (lane 6). With insig-2 there was no precipitation of SCAP or SREBP-2 in the absence of sterols (lane 7), but both proteins were coprecipitated when sterols were present (lane 8). The amounts of insig-1 and -2 expressed in these cells were similar, as determined by immunoblotting against their common myc epitopes. Nevertheless, insig-1 brought down more SCAP and SREBP-2 as compared with insig-2, suggesting that the affinity of insig-1 for SCAP is higher than that of insig-2.
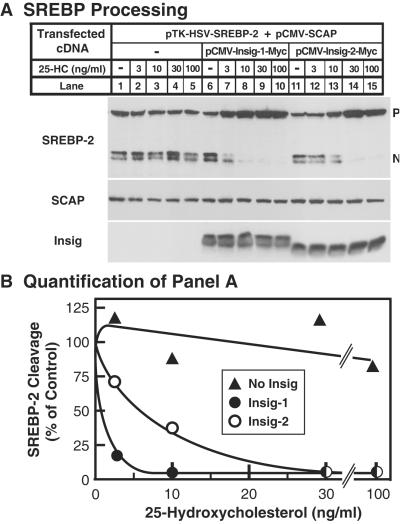
As reported (7), expression of insig-1 in the presence of transfected SCAP rendered SREBP processing extremely sensitive to low concentrations of 25-hydroxycholesterol (Fig. 4A). Insig-2 also shifted the sterol inhibition curve (50% inhibition at 5.7 ng/ml or 14 nM), but the shift was less pronounced than with insig-1 (50% inhibition at 0.8 ng/ml or 2 nM; Fig. 4B).
Figure 4.
Insig-1 and -2 increase sensitivity of SREBP processing to inhibition by 25-hydroxycholesterol. (A) On day 0, SRD-13A cells were set up in medium B at 4 × 10⁵ cells per 60-mm dish. On day 2, the cells were transfected with the indicated plasmids: 2 μg of pTK-HSV-SREBP-2, 1 μg of pCMV-SCAP, and either 0.1 μg of pCMV-Insig-1-Myc or 1 μg of pCMV-Insig-2-Myc. On day 3, cells were switched to medium C containing 1% hydroxypropyl-β-cyclodextrin and incubated for 1 h at 37°C. Cells were then washed twice with PBS and switched to medium C plus the indicated concentration of 25-hydroxycholesterol (25-HC). After incubation for 4 h, total cell extracts were prepared. Aliquots of the extracts (50 μg) were subjected to SDS/PAGE and immunoblot analysis with IgG-1D2 (SREBP-2), IgG-9D5 (SCAP), and IgG-9E10 (insig). N and P denote the cleaved nuclear and uncleaved precursor forms of SREBP-2, respectively. (B) The gels in A were scanned and quantified by densitometry. The intensity of the cleaved nuclear form of SREBP-2 in lanes 1, 6, and 11 was arbitrarily set at 100%.
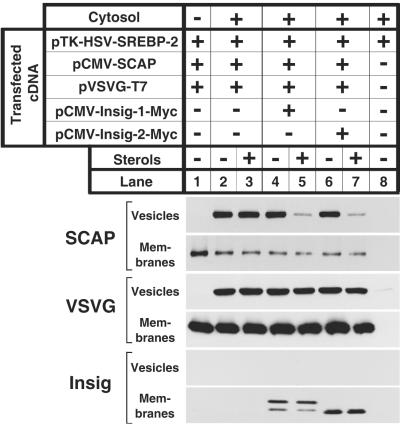
Fig. 5 shows that expression of insig-1 or -2 restored the ability of sterols to block the exit of overexpressed SCAP from the ER as determined by an in vitro vesicle-formation assay. In previous studies using this assay, we found that sterol-mediated regulation of SCAP budding could only be demonstrated in membranes from nontransfected cells (11), presumably because the endogenous insig proteins are saturated when SCAP is overexpressed (7). The availability of the insig cDNAs allowed us to study this process in transiently transfected cells. Membranes were prepared from cells that were transfected with cDNAs encoding SREBP-2, SCAP, the G protein of VSV, and insig-1 or -2. The cells were incubated in the absence or presence of sterols, after which membranes were isolated. The membranes were incubated with cytosol in vitro under conditions that permit the budding of vesicles from the ER (11). The donor membrane fraction and the budding vesicles were separated by centrifugation and subjected to SDS/PAGE and immunoblotting. The G protein of VSV, a transmembrane protein that is exported from the ER to the Golgi, was used as a control for nonspecific effects on ER budding. In the absence of cytosol, no SCAP or the G protein of VSV was incorporated into the vesicle fraction (lane 1). In the presence of cytosol, SCAP and the G protein of VSV were both incorporated into vesicles (lane 2), and sterols had no effect on either protein (lane 3). Coexpression of insig-1 or -2 did not affect budding in the absence of sterols (lanes 4 and 6), but it permitted sterols to specifically block SCAP budding without affecting the budding of the G protein of VSV (lanes 5 and 7).
Figure 5.
Restoration of sterol-mediated inhibition of SCAP budding from ER membranes in vitro by insig-1 and -2. On day 0, SRD-13A cells were set up in medium B at 8 × 10⁵ cells per 100-mm dish and grown at 37°C. On day 2, the cells were transfected with the indicated plasmids: 2 μg of pTK-HSV-SREBP-2, 1 μg of pCMV-SCAP, 1 μg of pVSVG-T7, and either 0.1 μg of pCMV-Insig-1-Myc or 1 μg of pCMV-Insig-2-Myc. After incubation at 40°C for 12 h, the cells were switched to medium C containing 1% (wt/vol) hydroxypropyl-β-cyclodextrin and incubated for 1 h at 40°C. Cells were then washed twice with PBS and switched to medium C in the absence or presence of 1 μg/ml 25-hydroxycholesterol plus 10 μg/ml cholesterol (sterols) as indicated. After incubation for 4 h at 40°C, cells were harvested. Membranes were incubated in vitro under conditions that permit vesicle budding as described in figure 8 of Nohturfft et al. (11). Aliquots (80 μg protein) of the membranes were incubated in the absence (lane 1) or presence (lanes 2–6) of rat liver cytosol for 15 min at 28°C. Vesicle and membrane fractions were separated by centrifugation, and aliquots containing 100% of the vesicle protein and 15% of the membrane protein were subjected to SDS/PAGE and immunoblot analysis with IgG-9D5 (SCAP), anti-T7⋅Tag antibody (VSVG), and IgG-9E10 (Insig).
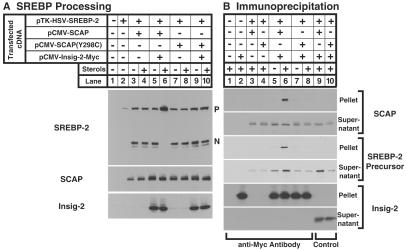
When SCAP bears a substitution of a tyrosine for a cysteine at position 298 in the sterol-sensing domain (Y298C), the protein is no longer retained in the ER on sterol addition (18). This mutant SCAP also fails to bind to insig-1 (7). To determine whether SCAP(Y298C) fails to interact with insig-2, we transfected SRD-13A cells with cDNAs encoding epitope-tagged SREBP-2, wild-type or mutant SCAP, and insig-2 (Fig. 6A). Insig-2 restored sterol regulation of SREBP-2 cleavage when cells expressed wild-type SCAP (lanes 5 and 6), but not when they expressed SCAP(Y298C) (lanes 9 and 10). An antibody against epitope-tagged insig-2 brought down wild-type SCAP and SREBP-2 in the presence of sterols (Fig. 6B, lane 6), but there was no coprecipitation when the cells expressed SCAP(Y298C) (lane 8).
Figure 6.
Sterol-dependent interaction of insig-2 with wild-type SCAP, but not with sterol-resistant mutant SCAP(Y298C). (A) On day 0, SRD-13A cells were set up in medium B at 4 × 10⁵ cells per 60-mm dish. On day 2, the cells were transfected with the indicated plasmids: 2 μg of pTK-HSV-SREBP-2, 1 μg of either pCMV-SCAP or pCMV-SCAP(Y298C), and 1 μg of pCMV-Insig-2-Myc. On day 3, cells were switched to medium C containing 1% hydroxypropyl-β-cyclodextrin and incubated for 1 h at 37°C. Cells were then washed twice with PBS and switched to medium C in the absence or presence of 0.1 μg/ml 25-hydroxycholesterol plus 10 μg/ml cholesterol (sterols). After incubation for 4 h, cells were harvested. Aliquots of cell extracts (50 μg) were subjected to SDS/PAGE and immunoblot analysis with IgG-1D2 (SREBP-2), IgG-9D5 (SCAP), and IgG-9E10 (insig-2). N and P denote the cleaved nuclear and uncleaved precursor forms of SREBP-2, respectively. (B) On day 0, SRD-13A cells were set up in medium B at 8 × 10⁵ cells per 100-mm dish. On day 2, the cells were transfected as in A. On day 3, cells were treated as in A. After incubation for 4 h, cells were harvested for immunoprecipitation with polyclonal anti-Myc IgG (lanes 1–8) or control nonimmune IgG (lanes 9, 10) as described in Materials and Methods. Immunoprecipitated pellets (representing 0.25 dish of cells) and supernatants (0.05 dish of cells) were subjected to SDS/PAGE and immunoblot analysis with IgG-1D2 (SREBP-2), IgG-9D5 (SCAP), and IgG-9E10 (insig-2).
Earlier studies in our laboratory (19) showed that the insig-1 mRNA is increased by nuclear SREBPs (7). To determine whether insig-2 is regulated similarly, we used N-BP cells. These genetically engineered CHO cells are unable to process their own SREBPs, owing to an absence of site-2 protease, but they express truncated nuclear forms of either SREBP-1a or SREBP-2 under control of a promoter that is induced by ponasterone A (16). Ponasterone A-mediated induction of nuclear SREBP-1a or SREBP-2 in these cells led to a marked increase in insig-1 mRNA (Fig. 7A, lanes 2 and 4). On the other hand, the insig-2 mRNA was expressed constitutively and was not affected by induction of either SREBP. To test this SREBP dependence in another way, we measured the mRNAs encoding insig-1 and -2 in a variety of mutant CHO cells with defects in processing of SREBPs. Insig-1 mRNA was present in wild-type CHO-K1 cells and CHO/pS2P cells, a parental wild-type line for mutant SRD-12B and SRD-13A cells, when they were incubated in the absence of sterols (Fig. 7B, lanes 1 and 5), and it declined when SREBP processing was inhibited by sterols (lanes 2 and 6). Insig-1 mRNA was not expressed in M19 cells, which lack site-2 protease (Fig. 7B, lanes 3 and 4). Insig-1 was also not expressed in SRD-12B and SRD-13A cells that lack the site-1 protease and SCAP, respectively (lanes 7–10). In striking contrast, all of these cell lines expressed similar amounts of insig-2, and there was no regulation by sterols.
Figure 7.
SREBPs regulate expression of insig-1 mRNA, but not insig-2 mRNA in hamster cells. (A) On day 0, N-BP cell lines were set up at 1 × 10⁶ cells per 100-mm dish in medium B. On day 2, the cells were switched to medium A supplemented with 5% lipoprotein-deficient serum and the indicated amount of ponasterone A. After incubation for 24 h at 37°C, the cells were harvested for preparation of total RNA. Total RNA (10 μg per lane) was subjected to electrophoresis and hybridized for 1 h at 68°C with 32P-labeled probes against hamster insig-1, hamster insig-2, and human β-actin (1.5 × 10⁶ cpm/ml for each probe) as described in Supporting Materials and Methods. Filters were exposed to films with intensifying screens at −80°C for 2 days (insig-1), 7 days (insig-2), or 3 h (β-actin). (B) On day 0, cells were set up in medium B at the following density: 5 × 10⁵ cells per 100-mm dish (CHO-K1, CHO/pS2P, and SRD12B cells) and 8 × 10⁵ cells per 100-mm dish (M19 and SRD13A cells). On day 2, the cells were switched to medium C in the absence or presence of 1 μg/ml of 25-hydroxycholesterol plus 10 μg/ml of cholesterol (sterols). After incubation for 18 h at 37°C, the cells were harvested, and total RNA was analyzed as described in A. Filters were exposed to films at −80°C for 5 days (insig-1 and -2) and 1 h (β-actin).
Discussion
The current results indicate that cells contain a second isoform of insig that binds to SCAP in a sterol-regulated fashion and is capable of retaining the SCAP/SREBP complex in the ER. Insig-1 and -2 are both polytopic membrane proteins of the ER. They differ in two important respects: (i) at high levels of expression, insig-1, but not insig-2, can block SREBP processing in the absence of added exogenous sterols; and (ii) insig-1, but not insig-2, requires nuclear SREBPs for its expression.
The existence of a constitutively expressed form of insig resolves a paradox inherent in previous data (7). If all insig depended on nuclear SREBPs for expression, then sterols might have only a transient ability to block SREBP processing. When cells are depleted of sterols, SCAP would dissociate from insig-1 and enter budding vesicles, thereby carrying SREBPs to the Golgi for proteolytic processing. The resultant nuclear SREBPs would turn on synthesis of sterols and also insig-1. The combination of sterols and insig-1 would lead eventually to a decline in SREBP processing. When SREBPs disappear from the nucleus, insig-1 would no longer be produced, but new SCAP would be synthesized. Eventually the amount of SCAP would exceed the amount of insig-1. This would permit SCAP to escape from the ER, carrying SREBPs to the Golgi even though cellular sterols were still high. Insig-2 should prevent this escape. Inasmuch as insig-2 is constitutively expressed, its levels would not fall when SREBPs disappear from the nucleus, and this would allow continued blocking of SCAP transport, but only as long as sterols remain high.
The 25-hydroxycholesterol concentration curve of Fig. 4 suggests that insig-1 acts at lower sterol concentration than insig-2. If conditions exist in which insig-1 is selectively reduced, then cells would be expected to require higher levels of sterols to suppress SREBP processing. Indeed, cells may modulate their response to sterols by regulating the ratio of insig-1 to insig-2.
The existence of two forms of insig may have implications for the differential regulation of the SREBP-1 and -2 isoforms. Under the usual conditions of cell culture, the processing of these two isoforms is activated in parallel by sterol deprivation and repressed by sterol addition (1). However, when cells are depleted of fatty acids, the processing of SREBP-1a, but not SREBP-2, becomes resistant to sterol inhibition (6). Moreover, in livers of hamsters (20) and mice (J. Horton, I. Shimomura, M.S.B., and J.L.G., unpublished work), there is a divergence in the regulation of processing of SREBP-2 and -1c. The latter is derived from an alternate transcript from the SREBP-1 gene that predominates over the SREBP-1a transcript in liver. When animals are treated with a combination of a cholesterol synthesis inhibitor (lovastatin) and a bile acid binding resin (cholestyramine), hepatic cholesterol is depleted, and this elicits the expected increase in the processing of SREBP-2. Paradoxically, the amount of nuclear SREBP-1c decreases. In part, this is due to diminished transcription of the SREBP-1c gene, owing to a deficiency of an endogenous oxysterol ligand for the liver X receptor, which is required for SREBP-1c production (21, 22). In addition, there appears to be an inhibition of SREBP-1c processing in these sterol-depleted livers. Further studies are necessary to determine whether the two different forms of insig, both of which are expressed in liver, may account for the two different patterns of regulation of SREBP processing in this organ.
A major unresolved question relates to the mechanism by which binding of SCAP to insig-1 or -2 leads to its retention in the ER. Inasmuch as neither insig-1 nor -2 has an obvious ER retention signal, it seems likely that these proteins must bind to other proteins that tether the insig/SCAP/SREBP complex in the ER. Present efforts are underway to identify other members of this postulated ER retention apparatus.
Supplementary Material
Acknowledgments
We thank our colleagues Tong Yang, Peter Espenshade, and Russell DeBose-Boyd for helpful discussions; Peter Espenshade for critical review of the manuscript; Debra Morgan, Tuyet Dang, Carla Dorsett, and Clinton Steffey for excellent technical assistance; Lisa Beatty and Angela Carroll for invaluable help with tissue culture; and Jeff Cormier and Melody Kerr for DNA sequencing. This research was supported by grants from the National Institutes of Health (HL-20948), the Perot Family Foundation, and the Keck Foundation.
Abbreviations
- CHO
Chinese hamster ovary
- CMV
cytomegalovirus
- ER
endoplasmic reticulum
- SREBP
sterol regulatory element-binding protein
- SCAP
SREBP cleavage-activating protein
- VSV
vesicular stomatitis virus
Footnotes
References
- 1.Brown M S, Goldstein J L. Proc Natl Acad Sci USA. 1999;96:11041–11048. doi: 10.1073/pnas.96.20.11041. [DOI] [PMC free article] [PubMed] [Google Scholar]
- 2.Edwards P A, Tabor D, Kast H R, Venkateswaran A. Biochim Biophys Acta. 2000;1529:103–113. doi: 10.1016/s1388-1981(00)00140-2. [DOI] [PubMed] [Google Scholar]
- 3.Goldstein J L, Rawson R B, Brown M S. Arch Biochem Biophys. 2002;397:139–148. doi: 10.1006/abbi.2001.2615. [DOI] [PubMed] [Google Scholar]
- 4.Horton J D, Goldstein J L, Brown M S. J Clin Invest. 2002;109:1125–1131. doi: 10.1172/JCI15593. [DOI] [PMC free article] [PubMed] [Google Scholar]
- 5. Brown, A. J., Sun, L., Feramisco, J. D., Brown, M. S. & Goldstein, J. L. (2002) Mol. Cell, in press. [DOI] [PubMed]
- 6.Hannah V C, Ou J, Luong A, Goldstein J L, Brown M S. J Biol Chem. 2001;276:4365–4372. doi: 10.1074/jbc.M007273200. [DOI] [PubMed] [Google Scholar]
- 7. Yang, T., Espenshade, P. J., Wright, M. E., Yabe, D., Gong, Y., Aebersold, R., Goldstein, J. L. & Brown, M. S. (2002) Cell, in press. [DOI] [PubMed]
- 8.Yang T, Goldstein J L, Brown M S. J Biol Chem. 2000;275:29881–29886. doi: 10.1074/jbc.M005439200. [DOI] [PubMed] [Google Scholar]
- 9.Hua X, Sakai J, Brown M S, Goldstein J L. J Biol Chem. 1996;271:10379–10384. doi: 10.1074/jbc.271.17.10379. [DOI] [PubMed] [Google Scholar]
- 10.Sakai J, Nohturfft A, Cheng D, Ho Y K, Brown M S, Goldstein J L. J Biol Chem. 1997;272:20213–20221. doi: 10.1074/jbc.272.32.20213. [DOI] [PubMed] [Google Scholar]
- 11.Nohturfft A, Yabe D, Goldstein J L, Brown M S, Espenshade P J. Cell. 2000;102:315–323. doi: 10.1016/s0092-8674(00)00037-4. [DOI] [PubMed] [Google Scholar]
- 12.Metherall J E, Goldstein J L, Luskey K L, Brown M S. J Biol Chem. 1989;264:15634–15641. [PubMed] [Google Scholar]
- 13.Rawson R B, Cheng D, Brown M S, Goldstein J L. J Biol Chem. 1998;273:28261–28269. doi: 10.1074/jbc.273.43.28261. [DOI] [PubMed] [Google Scholar]
- 14.Hasan M T, Chang T Y. Somatic Cell Mol Genet. 1994;20:481–491. doi: 10.1007/BF02255839. [DOI] [PubMed] [Google Scholar]
- 15.Rawson R B, DeBose-Boyd R, Goldstein J L, Brown M S. J Biol Chem. 1999;274:28549–28556. doi: 10.1074/jbc.274.40.28549. [DOI] [PubMed] [Google Scholar]
- 16.Pai J, Guryev O, Brown M S, Goldstein J L. J Biol Chem. 1998;273:26138–26148. doi: 10.1074/jbc.273.40.26138. [DOI] [PubMed] [Google Scholar]
- 17.Shimomura I, Shimano H, Horton J D, Goldstein J L, Brown M S. J Clin Invest. 1997;99:838–845. doi: 10.1172/JCI119247. [DOI] [PMC free article] [PubMed] [Google Scholar]
- 18.Nohturfft A, DeBose-Boyd R A, Scheek S, Goldstein J L, Brown M S. Proc Natl Acad Sci USA. 1999;96:11235–11240. doi: 10.1073/pnas.96.20.11235. [DOI] [PMC free article] [PubMed] [Google Scholar]
- 19.Luong A. Ph.D. dissertation. Dallas: University of Texas Southwestern Medical Center; 2000. [Google Scholar]
- 20.Sheng Z, Otani H, Brown M S, Goldstein J L. Proc Natl Acad Sci USA. 1995;92:935–938. doi: 10.1073/pnas.92.4.935. [DOI] [PMC free article] [PubMed] [Google Scholar]
- 21.Repa J J, Liang G, Ou J, Bashmakov Y, Lobaccaro J-M A, Shimomura I, Shan B, Brown M S, Goldstein J L, Mangelsdorf D J. Genes Dev. 2000;14:2819–2830. doi: 10.1101/gad.844900. [DOI] [PMC free article] [PubMed] [Google Scholar]
- 22.DeBose-Boyd R A, Ou J, Goldstein J L, Brown M S. Proc Natl Acad Sci USA. 2001;98:1477–1482. doi: 10.1073/pnas.98.4.1477. [DOI] [PMC free article] [PubMed] [Google Scholar]
- 23.Kyte J, Doolittle R F. J Mol Biol. 1982;157:105–132. doi: 10.1016/0022-2836(82)90515-0. [DOI] [PubMed] [Google Scholar]
- 24.Pearson W R, Wood T, Zhang Z, Miller W. Genomics. 1997;46:24–36. doi: 10.1006/geno.1997.4995. [DOI] [PubMed] [Google Scholar]
Associated Data
This section collects any data citations, data availability statements, or supplementary materials included in this article.


