Abstract
Total internal reflection fluorescence microscopy was used to detect single fluorescently labeled voltage-gated Shaker K+ channels in the plasma membrane of living cells. Tetramethylrhodamine (TMR) attached to specific amino acid positions in the voltage-sensing S4 segment changed fluorescence intensity in response to the voltage-driven protein motions of the channel. The voltage dependence of the fluorescence of single TMRs was similar to that seen in macroscopic epi-illumination microscopy, but the exclusion of nonchannel fluorescence revealed that the dimming of TMR upon voltage sensor rearrangement was much larger than previously thought, and is due to an extreme, ≈20-fold suppression of the elementary fluorescence. The total internal reflection voltage-clamp method reveals protein motions that do not directly open or close the ion channel and which have therefore not been detected before at the single-channel level. The method should be applicable to a wide assortment of membrane-associated proteins and should make it possible to relate the structural rearrangements of single proteins to simultaneously measured physiological cell-signaling events.
Dynamic readouts of the structural rearrangements in membrane proteins have been obtained from changes in the fluorescence of site-specifically attached dyes (1–11). In ion channels the fractional fluorescent change (ΔF) can be large and very specific, differing in direction and amplitude and in which functional step is detected as the dye-attachment site is moved from one residue to the next (2, 9, 10). The mechanism of the fluorescence report is not known.
The fluorescence studies have so far been confined to large ensembles of proteins, where the variation from protein to protein in occupancy of distinct states blurs the transitions between them, even when activating signals are synchronized by voltage clamping. Such blurring can be avoided in single-molecule determinations (12–14). Obstacles to optical detection have so far limited single-molecule optical studies of protein rearrangement to purified preparations, out of the native cellular context. We have overcome these obstacles for the optical detection of structural rearrangements in single-membrane proteins in living cells, enabling functional transitions that do not open or close gates to be detected on the single-channel level.
Materials and Methods
Molecular Biology.
Fluorescence experiments were performed on nonconducting (W434F) (15), ball-deleted (Δ6–46) (16) ShH4 Shaker channels (17), after the removal of two native cysteines (C245V and C462A) (2) to ensure that membrane-impermeant fluorescent thiols would attach exclusively to a known position of cysteine addition. Site-directed mutagenesis, cRNA synthesis, and cRNA injection into Xenopus oocytes were as described (3), leading to high-density channel expression in all of the experiments.
Oocyte Preparation.
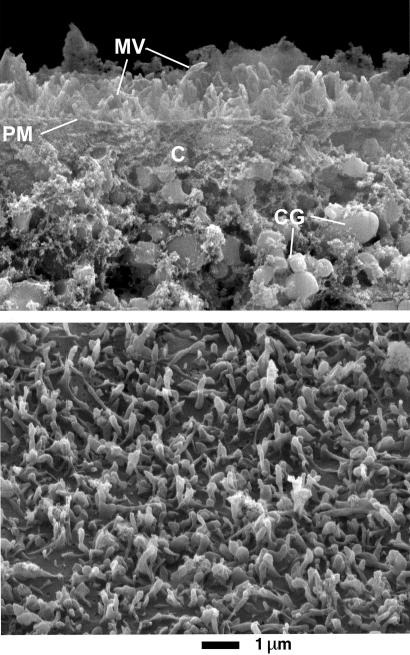
The vitelline membrane was found to be about 3 μm thick by scanning electron microscopy (not shown) and to refract or scatter the excitation light so that it penetrated into the cytoplasm, illuminating cortical granules. Mechanical removal of the vitelline membrane after 15 min of exposure to a hypertonic solution (220 mM NaAspartate/2 mM MgCl2/10 mM EGTA/10 mM Hepes, pH 7) revealed an ≈1-μm-thick layer of extracellular matrix, too thick for penetration of the evanescent field. Therefore, after labeling (see below), the extracellular matrix was removed enzymatically by incubation in a mixture of 2 mg/ml hyaluronidase and 0.5 units/ml neuraminidase (Sigma) for 12–20 min at 12°C. Oocytes were then mechanically devitellineized. Numerous microvilli that were ≈1 μm in length and 0.2 μm in thickness were visible in scanning electron microscopy of oocytes after removal of the extracellular matrix and vitelline membrane (Fig. 1B). For scanning electron microscopy, oocytes were fixed in 2.5% glutaraldehyde and 1% OsO4. Bluemink et al. (18) reported that the microvilli in oocytes range from 1 to 2 μm in length, suggesting that some of the longer microvilli may have been sheared in our preparation. The fact that a dense lawn of microvilli survived treatment is probably because collagenase and hyaluronidase removed microfilament attachments between the vitelline membrane and microvilli before removal of the vitelline membrane, minimizing shearing. In any case, the electrical and fluorescent measurements (see Fig. 3) show that if the microvilli shear then they reseal before recording.
Figure 1.
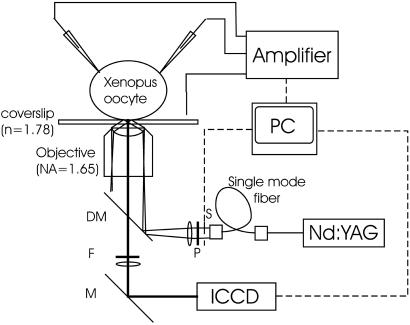
TIR microscopy system for voltage-clamp fluorometry. The Nd:YAG laser beam (λ = 532 nm) was attenuated by neutral density filters, passed through a single-mode optical fiber (OZ Optics, Carp, Canada) for spatial filtering and expansion, linearly polarized in the s direction by a polarizer (Newport, Fountain Valley, CA), and focused onto the back focal plane of the 1.65-N.A. objective at its edge by a dichroic mirror. This process causes the laser beam to emerge at an angle shallower than the critical angle. The oil and coverslip have the same refractive index (1.78), so that total reflection of the shallow angled beam occurs at the interface between the coverslip and cytosol (index of refraction = 1.35–1.45). The evanescent field decays exponentially with a space constant of ≈50 nm (see Materials and Methods), therefore exciting the oocyte surface most strongly. Fluorescent emission was filtered with a 572.5- to 647.5-nm bandpass filter. Detection was with an image-intensified cooled charge-coupled device (CCD) (see Materials and Methods).
Figure 3.
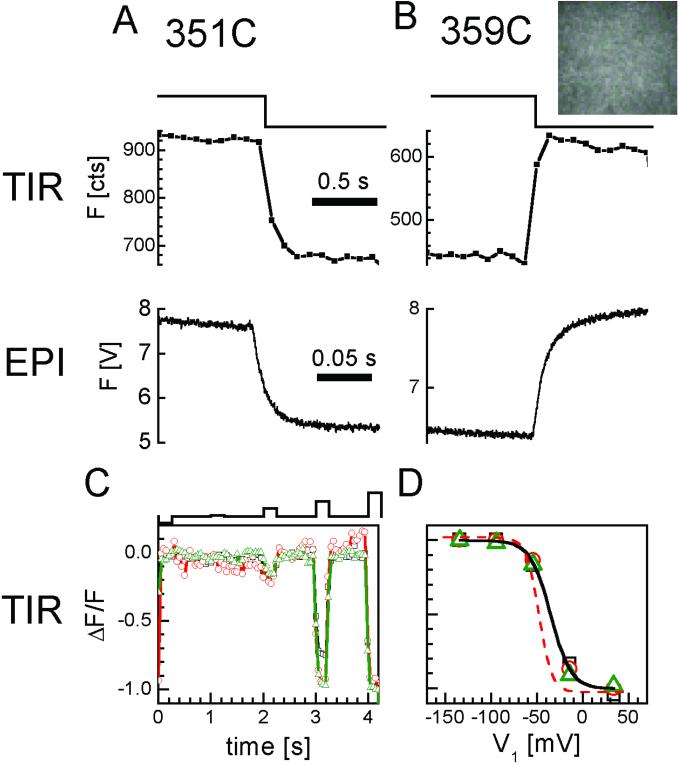
Optical detection of channel rearrangements in TIR excitation and epi-illumination. (A and B) TMR fluorescence increases at 351 (A) and decreases at 359 (B) in response to depolarization (−100 to +40 mV), under both penetrating epi-illumination (epi) (optical patch of 500-μm diameter; photodetection with a photomultiplier), and evanescent field excitation by TIR illumination (optical patch of 20-μm diameter; photodetection with the CCD at 10 frames per s). (B Inset) CCD image of the 359-TMR optical patch in TIR. (C and D) Good quality voltage clamping of optical patch in evanescent field. (C) Successive voltage steps to different levels (top) from a holding potential of −100 mV to −140, −90, −50, −10, and +30 mV, changes fluorescence over similar voltage ranges for three oocytes. Low TIR illumination intensity (0.1 mW per 20-μm-diameter spot). (20 frames per s.) (D) Comparison between the voltage dependence of fluorescence in TIR compared with epi-illumination. TIR from devitellineized oocytes with the extracellular matrix removed (symbols) fit with single Boltzmann (solid curve). Epi-illumination from oocytes with vitelline and extracellular matrix intact (dashed single Boltzmann fit).
Fluorescent Labeling.
Oocytes expressing Shaker channels with a single introduced cysteine at position 351 or 359 were labeled with tetramethylrhodamine-5-maleimide (TMRM; Molecular Probes). The nanosecond excited-state lifetime of TMRM is much shorter than the microsecond or longer dwell times associated with known functional states of the channel, making the dye a good reporter of structural changes that take place around the dye during functional transitions. TMRM attachment to Shaker channels was maximized in several ways (2): (i) the charged TMRM fluorophore does not permeate the plasma membrane; (ii) maleimide chemistry is highly specific for cysteines; (iii) native membrane protein cysteines were blocked with the nonfluorescent tetraglycine maleimide; and (iv) two native Shaker cysteines, in S1 and S6, were mutated.
After RNA injection, oocytes were incubated for 3–4 days at 12°C, blocked with 1 mM tetraglycine maleimide for 3–5 min at room temperature in a hyperpolarizing solution [110 mM N-methyl-d-glucamine methane sulfonate/1 mM Ca(Mes)2/10 mM Hepes, pH 7.5] and then washed five times. Oocytes were then either labeled directly or after 4–18 h at room temperature. Labeling with 10–20 nM (low labeling) to 200 nM (high labeling) TMRM was in a depolarizing solution (110 mM KCl/1.5 mM MgCl2/0.8 mM CaCl2/10 mM Hepes, pH 7.5) at 10–12°C and was followed by three washes and incubation in the depolarizing solution. Block and labeling were done before removal of the vitelline layer. For oocytes expressing 359C channels, labeling in the depolarizing solution immediately after block in the hyperpolarizing solution was particularly effective because 359C, but not cysteines on native membrane proteins, is exposed only at depolarized potentials (19).
Total Internal Reflection (TIR) Excitation and Detection.
Fluorescence detection and excitation were performed by using an Olympus IMT-2 microscope (Olympus, New Hyde Park, NY), after adaptation of the tube lens to make the microscope compatible with infinity-corrected lenses. The beam of a 100-mW Nd-YAG 532-nm laser (Coherent Radiation, Palo Alto, CA) was reflected off of a HQ545LP dichroic (Chroma Technology, Brattleboro, VT) and focused at the back focal plane of an Apo 100 × 1.65-numerical aperture (N.A.) oil/∞ objective (Olympus), so that it emerged into the immersion oil at an angle shallower than the critical angle θc, but close to the maximum angle of emergence for a very thin illumination layer. Under our conditions: θc = sin−1 (n1/n2) ≈ 61°, n2 is the coverslip refractive index (1.78, Olympus) (20–22). The maximum angle of emergence θ is given by: θ = sin−1 (N.A./n2) ≈ 68°, where N.A. is the numerical aperture of the objective (1.65). Under these conditions, illumination generated an evanescent field of excitation decaying exponentially from the glass/buffer interface into the buffer (decay length to 1/e in about 50 nm) (Fig. 1A). The exciting spot was 15–25 μm in diameter. To minimize the rate of photodestruction, the power of the exciting light was attenuated with neutral density filters. Single fluorescent molecules were observed with excitation powers from 500 μW to 4 mW. Fluorescent emission was filtered with an HQ572.5–647.5 bandpass filter (Chroma). Detection was with a Pentamax GenIV intensified camera at an intensifier setting of 80%. Images were usually recorded in the 2 × 2 hardware binned mode, which yields a pixel size in the image plane of 225 nm. This optical system enabled the detection of single TMRM molecules that approached or adhered to the coverslip in dilute dye solutions. When oocytes were imaged, with the vitelline membrane and extracellular matrix surrounding the plasma membrane intact, evanescent field excitation yielded fluorescence images consisting of some bright spots scattered against a diffuse background with considerable out-of-focus brightness. This outcome can be explained by the high refractive index of the vitelline membrane, producing direct penetration of the exciting light into the cytoplasm. After removal of the vitelline membrane and extracellular matrix, the fluorescence image became sharp and almost free of the out-of-focus haze.
In contrast to dye in solution, where fluorescent spots were highly mobile from frame to frame (25- to 50-ms exposures), the fluorescence pattern of oocytes was stable for the duration of a 10-s movie, with no lateral motion of the spots. However, as discussed in the text, during the unilluminated interval of 2 min between movies, tetramethylrhodamine (TMR)-labeled single channels often appeared as new spots, or in spots where other TMR-labeled channels had been bleached. This finding is consistent with a slow diffusion of unbleached channels in the z axis, along the length of the microvilli, and deeper into the evanescent field.
TIR Excludes Autofluorescence from the Cell Interior.
Oocytes have a special advantage not possessed by other cells: a pigment granule layer located just beneath the plasma membrane on the animal pole, which blocks excitation of the cell interior. A comparison of the autofluorescence of oocytes illuminated with epi-illumination excitation showed that the pigmented layer attenuates the autofluorescence by 7.6-fold in the average oocyte (pigmented animal pole fluorescence = 0.66 ± 0.03 V photomultiplier output; unpigmented vegetal pole = 5.01 ± 0.95 V photomultiplier output; n = 10, ± SD). Evanescent field excitation eliminated the difference between the pigmented and nonpigmented poles, indicating that, as expected, the evanescent field does not penetrate into the cell interior. This finding indicates that evanescent wave excitation bypasses the need for a pigment layer, making other cell types equally suitable for both ensemble and single-protein optical recording at the cell surface.
Electrophysiology and Solutions.
Two-electrode voltage clamping was performed with a Dagan CA-1B amplifier (Dagan Instruments, Minneapolis). The external solution contained 110 mM NaMES, 2 mM Ca(Mes)2, and 10 mM Hepes, pH 7.5. TIR voltage clamping was performed in the presence of 30 mM triplet-state quencher cysteamine (MEA) (Sigma) to slow photodestruction.
Fluorescence Analysis.
Fluorescent spots that responded to voltage were identified by subtracting in WINVIEW software (Princeton) the average of a pair of image frames acquired at the holding potential immediately before a depolarizing step from the average of the next two frames taken during the depolarizing step. Pixels with nonzero intensity in the difference image (spots where the voltage step evoked a ΔF) were analyzed by making a time trace of that spot's intensity across all frames in the movie by using the METAMORPH software (Universal Imaging, Media, PA). The time traces were subsequently sorted for the single-molecule signature of abrupt disappearance (quantal bleaching), and these single-molecule fluorescence trajectories were analyzed up to the time of bleaching. Automated data processing was done with custom software written in LABVIEW (National Instruments, Austin, TX). Fractional dimming was determined from single TMR-labeled channel spots that bleached abruptly and completely to background, and had no residual voltage response. The dim level was determined from the last 5–10 frames before the step to the bright voltage, and this level was subtracted by the background fluorescence level in the first 5–10 frames immediately after bleaching in the bright state. This difference was expressed as a fraction of the voltage-driven ΔF (dim level − bright level, with the bright level determined from all of the bright points before bleaching). In this way, the fractional dim state brightness = (dim − background)/(bright − dim).
Results and Discussion
Macroscopic TIR on Shaker Channels.
Shaker K+ channels expressed in Xenopus oocytes were labeled at single introduced cysteines with TMR-5′-maleimide under conditions that minimize nonspecific attachment of dye (Materials and Methods). Evanescent field excitation, which drops off exponentially in intensity with distance from the coverslip, was used to confine excitation to the membrane and thus reduce autofluorescence. The evanescent field was set up by TIR off of the coverslip supporting the oocyte, and detection was with an intensified CCD camera (Fig. 1; Materials and Methods).
Channels were labeled in and near the voltage-sensing S4 transmembrane segment. Labeling was either at position 351, in the S3–S4 linker, or at position 359, in the external end of S4, which is accessible only when the membrane is depolarized (19). These two positions were chosen because they both have a large ΔF in epi-illumination measurements and because their fluorescence changes in opposite directions upon membrane depolarization. To bring the plasma membrane of the oocyte close enough to the coverslip so that it would be efficiently excited by the evanescent field, the vitelline membrane was removed mechanically and the ≈1-μm-thick extracellular matrix was removed enzymatically (Materials and Methods). This treatment bared the oocyte's ≈1-μm-long and ≈0.2-μm-thick microvilli (finger-like protrusions of the plasma membrane) so that their tips could be in the evanescent field (Fig. 2 Lower).
Figure 2.
Scanning-electron micrograph of devitellineized oocyte surface after enzymatic removal of extracellular matrix. (Upper) Cross-sectional view, which reveals microvilli (MV) about 1 μm long projecting from the plasma membrane (PM) toward the outside and cortical granules (CG) on the cytosolic side (C). Several Shaker channels may be present at each microvillus tip, having a membrane surface area of about 0.01 μm2. (Lower) Surface view of oocyte showing disposition and density of microvilli. Because the evanescent field of excitation has a space constant of ≈50 nm (see Materials and Methods), only the tips of the microvilli, or their side surface if they lie with their main axis parallel to the coverslip, are likely to be observed with evanescent field excitation.
For macroscopic TIR recordings, channels were labeled to between 10% and 100% of saturation with 200 nM TMR (Materials and Methods), yielding a milky fluorescence image (Fig. 3B Inset). Depolarizing voltage steps from −100 mV to +40 mV, which drive S4 from the resting to the activated conformation (2, 23–26), changed the fluorescence intensity of the entire optical patch, increasing fluorescence at site 351, and decreasing fluorescence at site 359 (Fig. 3 A and B). The ΔF values were uniform in the small (10- to 25-μm diameter) evanescent field of illumination.
Unlike with penetrating epi-illumination, TIR illumination is very sensitive to the proximity of the dye to the coverslip, raising the possibility that channel motion, or a possible movement of the membrane with voltage (e.g., due to cellular swelling or shrinking), could change the depth of the dye in the evanescent field, and thus produce a ΔF. However, the fact that in TIR the ΔF at 351 was opposite to that at 359 for the same depolarizing voltage step, which is the same as was seen in large (300–600 μm in diameter) membrane patches excited by penetrating epi-illumination (Fig. 3 A and B), indicates that the fluorescence report under TIR excitation is the same as under epi-illumination and that it is due to the change in protein structure around the dye.
In TIR only a thin layer of extracellular electrolyte exists in the <100 nm between the membrane and the coverslip, making for a pathway that could have a high resistance between the outer face of the optical patch and the bath electrode, and so could reduce the voltage across the membrane. To avoid this potential problem, we confined our analysis to the edge of the optical patch that was closest to the voltage-sensing electrode, where the voltage control was good enough to give a fluorescence–voltage relation similar to that obtained with epi-illumination (Fig. 3 C and D). In epi-illumination the optical patch is much farther (microns) from the coverslip and the fluorescence of the optical patch lying on the coverslip has been shown to follow the voltage dependence of the gating current measured from the entire surface of the cell (3).
Optical Detection of Single Channels.
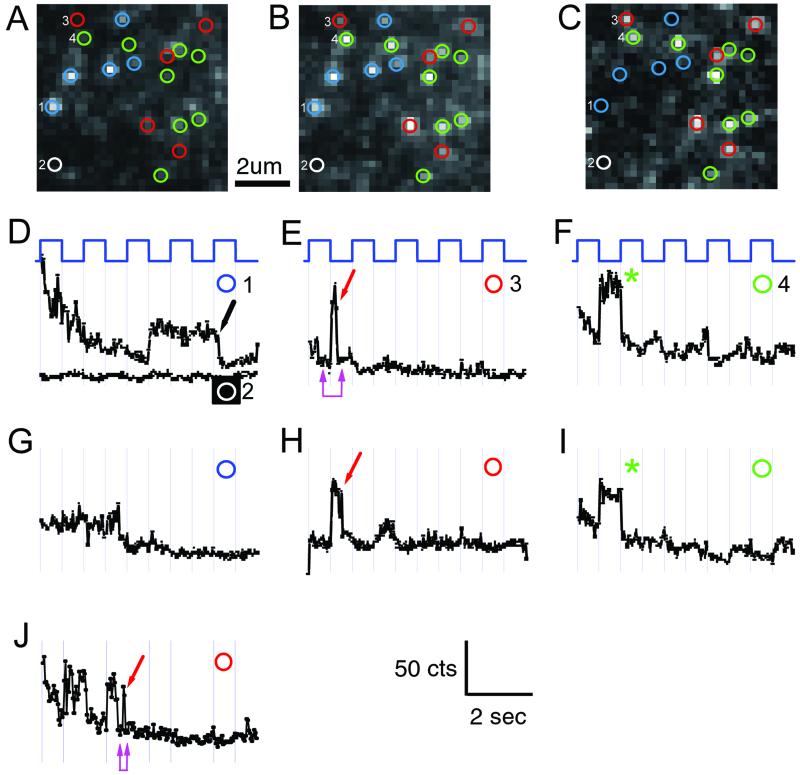
A reduction of dye concentration by 20-fold (Materials and Methods) yielded a sparse and random distribution of diffraction-limited bright spots in the optical patch (Fig. 4 A–C). Depolarization from −100 to + 20 mV for channels labeled sparsely at site 359 evoked a general decrease in brightness throughout the optical patch, as was seen with dense labeling (Fig. 3). All of the spots that changed fluorescence with voltage became dimmer upon depolarization (Fig. 4 A–C). In successful recordings, many spots in an optical patch responded to voltage. However, some spots were insensitive to voltage (Fig. 4 A–D and G; blue circles). They therefore probably represent TMRs nonspecifically adhered to the oocyte surface, or bound to cysteines on native oocyte membrane proteins. Some TMRs may have also been correctly attached to channels that were removed from the plasma membrane by endocytosis, and therefore were not affected by changes in plasma membrane voltage.
Figure 4.
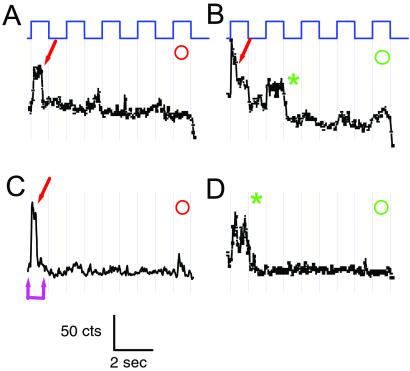
Elementary ΔF of single TMRM molecules attached to 359C. (A–C) Voltage dependence of fluorescence detected on a 30 × 30 pixel region (6.75 × 6.75 μm on the cell surface; 1/16 of total CCD image). (A) Average of two frames at +20 mV, immediately before repolarization. (B) Average of two frames immediately after repolarization from +20 to −100 mV. (C) Spots where intensity was modulated by voltage were all brighter at negative voltage, characteristic of 359-TMRM channels, and were identified for analysis as bright spots in the difference image (C = B − A). (D–J) Trajectories of fluorescence intensity of four spots (D–H from optical patch in A–C and J from another patch) (y axis range = 270–450 counts) during a 10-s movie. Abrupt irreversible decreases in fluorescence are quantal bleach events (arrows). Elimination by quantal bleaching of further response to voltage identifies single-channel trajectories (red arrows). (D and G) Bright spots that did not respond to voltage (blue circles) are likely TMRMs attached to nonchannel proteins; nonresponsive dim spots (white circles) are background. (E, F, and H–J) 359-TMRM spots bleached in either the bright state (red circles and arrows), or did not get bright again upon repolarization, indicating bleaching in the preceding dim state (green circles and asterisks). (Numbers in D–F correspond to pixels numbered in images A–C.) (E, F, and I) The dim state is strongly quenched and indistinguishable from the background after bleaching: (i) No difference between dim-state intensity at +20 mV before bleaching and background at −100 mV after bleaching (E and J double magenta arrow); (ii) dim-state bleaching (in F and I) (green asterisk) occurs without measurable decrease in fluorescence. Note that small voltage-driven ΔF remaining after bleach (F and H) is likely from channels farther from the coverslip. High-intensity illumination: 1.2 mW per 20-μm-diameter spot. Steps are from holding potential of −100 mV in 50% duty cycle between −100 mV and +20 mV (1 s at each voltage). (20 frames per s.)
In optical patches where the spots were sparsely distributed their fluorescence tended to drop off in abrupt steps during the illumination (Figs. 4 and 5, arrows). These drops in fluorescence were irreversible over the time course of a 10-s movie, consistent with bleaching due to photodestruction. In some cases bleaching occurred in multiple steps (Figs. 4H and 5B). In other cases a single step of photobleaching reduced the fluorescence to the level of the background (Figs. 4E and 5 A and C). The abrupt photobleaching events either occurred from one 25-ms frame to the next, or else took place over one or two frames of intermediate fluorescence. This decline of fluorescence is what would be expected for a rapid disappearance that either takes place near the beginning or end of a frame (the former case), or else near the middle of a frame (the latter case). Given that the average rate of bright-state bleaching for an ensemble of spots in an optical patch was slow (τ = ≈6 s) (not shown), the chance that two TMRs would bleach within the same 25-ms frame time is very low. This finding indicates that most of the abrupt bleaching events are cases of quantal bleaching of single TMR molecules. Therefore, each spot in which a single step of bleaching eliminated all ensuing response to voltage is due to the fluorescence of a single dye, and the fluorescence report that precedes the quantal bleach is due to the molecular motions of a single S4. After rapid bleaching of the brightest channel dyes, ones that were most intensely excited because they were closest to the coverslip, dimmer channel dyes sometimes survived, probably because they were farther from glass and were weakly excited.
Figure 5.
Elementary ΔF of single TMRM molecules attached to 351C. Trajectories of fluorescence intensity of four spots in one optical patch (y axis range = 270–450 counts) during a 10-s movie (same color code, voltage protocol, imaging and illumination as in Fig. 3). Spots where intensity was modulated by voltage were all brighter at positive voltage, characteristic of 351-TMRM channels. Single channels were identified by quantal bleaching in the bright state (arrows). Dim-state bleaching was also observed (asterisk).
As with macroscopic epi-illumination and TIR, single TMRs attached to site 359 became brighter at negative voltage (Fig. 4), whereas single TMRs at site 351 had the opposite behavior and became dimmer (Fig. 5). The fluorescence of TMR was strongly suppressed in the dim states at both 351 and 359, reduced to an intensity level that was very close to the background level remaining after photodestruction of the dye (Figs. 4 E and J and 5C, magenta double arrows). The fractional brightness of the dim state was suppressed by 20-fold compared with the bright state [(dim − background)/(bright − dim) = 0.05 ± 0.03 (n = 9)]. Although numerous cases of quenching when dyes are conjugated to proteins are documented, this instance is the most dramatic case of fluorescence suppression due to structural rearrangement in a protein of which we are aware. The photophysical basis of the dimming has yet to be defined.
Photobleaching took place for 351 and 359 in both the bright (Figs. 4 E, H, and J and 5 A–C; red arrow) and dim (Figs. 4 F and I and 5 B and D; green asterisk) states. Because the fluorescence of the dim state could not be distinguished from background, it was not possible to observe directly the dim-state bleaching events. Instead, dim-state bleaching was only detected when the fluorescence simply did not reappear upon return to the bright voltage. Because the dim-state bleaching took place during the entire 1 s of dim time, it could have included photodestruction of multiple dyes. As a result, we only identified a spot as a single-channel-attached TMR when it bleached in the bright state, where we could distinguish between single-step and multistep photobleaching. By slowing photodestruction and increasing detection efficiency it should become possible to increase the observation time or the frame rate to study the functional basis of bright-state fluctuations in the signal that we discern in rare long traces (Fig. 4J).
Conclusion
Evanescent field excitation of cells under voltage clamp has enabled us to detect single dye molecules attached to voltage-gated ion channels. The changes in fluorescence intensity report the local protein motion in one subunit of the channel in a single S4 voltage-sensing transmembrane helix. This finding shows detection of functional protein motion at the single-protein level in living cells. The TIR voltage-clamp method can be thought of as a structural analog of the patch clamp, in that it provides a measurement of the molecular rearrangements that underlie gating in single channels. The method permits detection of gating rearrangements that do not open or close the ion channel and which have therefore not been detected before at the single-channel level. For this reason, the method makes it possible to extend single-molecule recording to other classes of membrane protein. The compatibility with voltage clamping means that it should be possible to relate directly the structural rearrangements of individual proteins, or the stochastic association of protein pairs measured with single-pair fluorescence resonance energy transfer, to simultaneously measured physiological cell-signaling events.
Acknowledgments
We thank Marla Feller for help in designing and building the initial version of the experimental setup, Medha Pathak, Arnd Pralle, and Xavier Michalet for important help with theory and analysis, and Yoshinori Marunaka for help with electron microscopy. We also thank Carlos Bustamante, H. Peter Larsson, Harold Lecar, Shimon Weiss, Mario Moronne, and the members of the Isacoff laboratory for many fruitful discussions. This work was supported by National Institutes of Health Grant R01NS35549, the Department of Energy, and the Packard Foundation. The development of the 1.65-N.A. objective lens was made possible by Grant-in-Aid 05558099 from the Ministry of Education, Science, and Culture, Japan (to S.T.), and the stay of S.T. at Berkeley was supported by a Grant-in-Aid (Project for Creation and Development) from the same ministry. A.S. was supported by the Erwin Schrödinger Fellowship of the Austrian Fonds zur Förderung der wissenschaftlichen Forschung.
Abbreviations
- TIR
total internal reflection
- TMR
tetramethylrhodamine
- TMRM
tetramethylrhodamine-5-maleimide
- N.A.
numerical aperture
- CCD
charge-coupled device
Footnotes
This paper was submitted directly (Track II) to the PNAS office.
References
- 1.Liu R, Sharom F J. Biochemistry. 1996;35:11865–11873. doi: 10.1021/bi960823u. [DOI] [PubMed] [Google Scholar]
- 2.Mannuzzu L M, Moronne M M, Isacoff E Y. Science. 1996;271:213–216. doi: 10.1126/science.271.5246.213. [DOI] [PubMed] [Google Scholar]
- 3.Mannuzzu L M, Isacoff E Y. J Gen Physiol. 2000;115:257–268. doi: 10.1085/jgp.115.3.257. [DOI] [PMC free article] [PubMed] [Google Scholar]
- 4.Cha A, Bezanilla F. Neuron. 1997;19:1127–1140. doi: 10.1016/s0896-6273(00)80403-1. [DOI] [PubMed] [Google Scholar]
- 5.Cha A, Bezanilla F. J Gen Physiol. 1998;112:391–408. doi: 10.1085/jgp.112.4.391. [DOI] [PMC free article] [PubMed] [Google Scholar]
- 6.Cha A, Snyder G E, Selvin P R, Bezanilla F. Nature (London) 1999;402:809–813. doi: 10.1038/45552. [DOI] [PubMed] [Google Scholar]
- 7.Kobilka B K, Gether U. Adv Pharmacol. 1998;42:470–473. doi: 10.1016/s1054-3589(08)60790-5. [DOI] [PubMed] [Google Scholar]
- 8.Loots E, Isacoff E Y. J Gen Physiol. 1998;112:377–389. doi: 10.1085/jgp.112.4.377. [DOI] [PMC free article] [PubMed] [Google Scholar]
- 9.Glauner K S, Mannuzzu L M, Gandhi C S, Isacoff E Y. Nature (London) 1999;402:813–817. doi: 10.1038/45561. [DOI] [PubMed] [Google Scholar]
- 10.Gandhi C S, Loots E, Isacoff E Y. Neuron. 2000;27:585–595. doi: 10.1016/s0896-6273(00)00068-4. [DOI] [PubMed] [Google Scholar]
- 11.Li M, Farley R A, Lester H A. J Gen Physiol. 2000;115:491–508. doi: 10.1085/jgp.115.4.491. [DOI] [PMC free article] [PubMed] [Google Scholar]
- 12.Sakmann B, Neher E. Single-Channel Recording. 2nd Ed. New York: Plenum; 1995. [Google Scholar]
- 13.Mehta A D, Rief M, Spudich J A, Smith D A, Simmons R M. Science. 1999;283:1689–1695. doi: 10.1126/science.283.5408.1689. [DOI] [PubMed] [Google Scholar]
- 14.Xie X S, Lu H P. J Biol Chem. 1999;274:15967–15970. doi: 10.1074/jbc.274.23.15967. [DOI] [PubMed] [Google Scholar]
- 15.Perozo E, MacKinnon R, Bezanilla F, Stefani E. Neuron. 1993;11:353–358. doi: 10.1016/0896-6273(93)90190-3. [DOI] [PubMed] [Google Scholar]
- 16.Hoshi T, Zagotta W N, Aldrich R W. Science. 1990;250:533–538. doi: 10.1126/science.2122519. [DOI] [PubMed] [Google Scholar]
- 17.Kamb A, Iverson L E, Tanouye M A. Cell. 1987;50:405–413. doi: 10.1016/0092-8674(87)90494-6. [DOI] [PubMed] [Google Scholar]
- 18.Bluemink J G, Hage W J, van den Hoef M H F, Dictus W. Eur J Cell Biol. 1983;31:85–93. [PubMed] [Google Scholar]
- 19.Baker O S, Larsson H P, Mannuzzu L M, Isacoff E Y. Neuron. 1998;20:1283–1294. doi: 10.1016/s0896-6273(00)80507-3. [DOI] [PubMed] [Google Scholar]
- 20.Axelrod D. Methods Cell Biol. 1989;30:245–270. doi: 10.1016/s0091-679x(08)60982-6. [DOI] [PubMed] [Google Scholar]
- 21.Funatsu T, Harada Y, Tokunaga M, Saito K, Yanagida T. Nature (London) 1995;374:555–559. doi: 10.1038/374555a0. [DOI] [PubMed] [Google Scholar]
- 22.Steyer J A, Horstmann H, Almers W. Nature (London) 1997;388:474–478. doi: 10.1038/41329. [DOI] [PubMed] [Google Scholar]
- 23.Larsson H P, Baker O S, Dhillon D S, Isacoff E Y. Neuron. 1996;16:387–397. doi: 10.1016/s0896-6273(00)80056-2. [DOI] [PubMed] [Google Scholar]
- 24.Yang N, George A L, Jr, Horn R. Neuron. 1996;16:113–122. doi: 10.1016/s0896-6273(00)80028-8. [DOI] [PubMed] [Google Scholar]
- 25.Yusaf S P, Wray D, Sivaprasadarao A. Pflügers Arch. 1996;433:91–97. doi: 10.1007/s004240050253. [DOI] [PubMed] [Google Scholar]
- 26.Starace D M, Stefani E, Bezanilla F. Neuron. 1997;19:1319–1327. doi: 10.1016/s0896-6273(00)80422-5. [DOI] [PubMed] [Google Scholar]


