Abstract
Some marine bacterial species form mucosal layers, called veils, on sulfidic marine sediment. The bacteria attached to this veil actively swim and exert force on the surrounding fluid. The bacteria can break free of the veil and swim, chemotacting back to the veil. Over time the veil forms holes arranged in a hexagonal pattern. Motivated by this system, we present a simplified model to describe pattern formation induced by force-generating bodies embedded in a layer surrounded by fluid. When the bacteria break free of the layer, they are advected by the flow and diffuse. Competition between the fluid flow generated by the embedded bacteria and diffusion of the swimmers leads to a novel instability that drives bacterial aggregation. Analytic and numeric analysis of this system correctly defines the length scale and developmental timescale for the biological system. Similar flow dynamics may also play a role in other biological systems such as encrusting bryozoan colonies.
INTRODUCTION
Pattern formation during morphogenesis is a well-known and highly studied process. Often, cell movements exert force on the environment, and the environment, in turn, exerts force back on the cells. This feedback can lead to complex phenomena. A classic example is mesenchymal morphogenesis where crawling cells pull on the extracellular matrix (Trinkhaus, 1980). The stress induced in the matrix produces anisotropy in the layer that affects the cells' motion. This mechanical coupling results in spatially organized cell aggregations. Physical models capture the dynamic interplay present in this system and provide useful insights on the biology (Murray, 1993; Murray et al., 1983; Oster et al., 1983). This interplay between development and the environment is seen in many other biological systems such as limb morphogenesis (Wolpert and Stein, 1984), formation of microvilli (Oster et al., 1985), and, more recently, mechanical stress has been shown to induce neurogenesis in nonneuronal cell cultures (Feron et al., 1999).
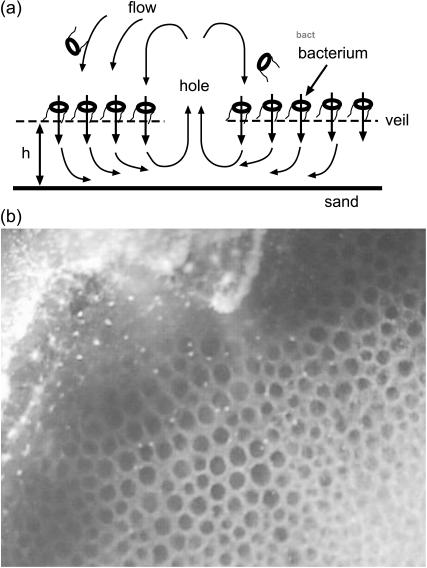
Similar coupling with the environment leads to pattern formation in developing biofilms (Stoodley et al., 1999). A biofilm is a microbial aggregate with constituent microbes connected to each other and a substrate by means of an extracellular polymeric substance, which is a muscous or gel-like polymer matrix secreted by the microbes (Bryers and Characklis, 1982; Costerton et al., 1995). Biofilms are medically and technologically important as they cause infection, corrode equipment, and lead to higher costs for production and distribution of product. Some sulfide-oxidizing bacteria aggregate into bacterial veils, colonies similar to biofilms that form above sulfidic marine sediment (Fenchel, 1994; Fenchel and Glud, 1998; Jorgensen and Revsbech, 1983; Thar and Kuhl, 2002). These veils form when swimming cells get stuck together by the mucous they secrete. Although stuck to the aggregate, the bacteria keep rotating their flagella pulling oxygen-rich fluid through the colony. Advection and consumption of oxygen set up an oxygen gradient toward which other bacteria chemotact. This process leads to veil growth. A fully developed veil is, therefore, a mucous mat with embedded bacteria that are actively rotating their flagella (Fig. 1 a).
FIGURE 1.
(a) Schematic diagram showing the bacterial veil with embedded and swimming bacteria and the idealized fluid flow (arrows). The holes provide an outlet for circulation flow. (b) Two-day-old veil showing honeycomb pattern of regular spaced (∼ 300 μm) holes. Picture courtesy of R. Thar.
Bacterial veils sit near the bacteria's optimal oxygen concentration (2–10 μM, depending on species) (Fenchel and Glud, 1998; Thar and Kuhl, 2002). The cells are attached to the veil, typically on the upper or oxic side, via a long, thread-like stalk. These stalks sometimes break and the cells detach from the veil. Once free, the cells actively swim. Chemotaxis in a U-shaped pattern then brings the cells back to the veil where they can reattach (Thar and Kuhl, 2003).
Pattern formation in the veil is dependent on the height of the veil from the surface (Fenchel and Glud, 1998). When the veil is over a depression in the sediment or when it is raised sufficiently off the surface, a honeycomb-type pattern of regularly spaced holes form in the veil (Fig. 1 b) (Fenchel and Glud, 1998; Thar and Kuhl, 2002). In veils produced by Thiovulum majus, these hole patterns occur in striped and honeycomb patterns (R. Thar, private communication). The holes are typically separated on a length scale comparable to the height of the veil off the surface. Particle tracking near these holes show that they are sources of outflow (Fenchel and Glud, 1998). Interestingly, very similar patterns arise in encrusting bryozoan colonies where ciliated filter feeders pull nutrient-rich fluid down into the colony (Larsen and Riisgard, 2001).
In this article, we suggest a simplified model to describe how fluid flow driven by the bacterial veil can lead to patterns of regularly spaced holes in the colony. As depicted in Fig. 1 a, we note that, in the presence of a hole, recirculating flow above the veil will tend to push any free-swimming bacteria back into the veil away from the hole. This advection of free-swimming bacteria will tend to clump the bacteria together. As higher concentrations of bacteria form in these clumps stronger circulating flow is generated, which further promotes aggregation. Therefore, we break the bacterial population into two groups, a group that is bound to the veil and a group that is not bound and can thus swim freely above the veil. The bound cells are stuck in place at the location of the veil. The veil height above the sediment surface, h, is presumably set by the coupling of the sulfide oxidation reaction to the fluid flow (Thar and Kuhl, 2002). For the purposes of this article, we make no predictions about what sets this height and assume that it is constant across the veil. Rotation of the bound cells' flagella exerts a net force on the surrounding fluid inducing a flow field with velocity, v. On a timescale τb, the bound cells break free of the veil and become part of the free-swimming population.
The free population swims, chemotacts, and is advected by the flow created by the bound population. The random swimming of the free cells acts as an effective diffusion (Berg, 1993), with diffusion constant, Df. Assuming that the height of the veil is constant and set by the sulfide/oxygen gradients implies that any chemotaxis will tend to drive the bacteria back to the veil. Due to the regularity of the chemotactic U-shaped pattern, detached cells will on average swim a height δ above the veil and remain detached for a time τf. In particular, we are assuming that oxygen consumption and transport along with the fluid flow determine δ and τf. It is likely that these parameters depend in a nontrivial way on both the fluid velocity and the oxygen concentration, but, for simplicity, we will assume they are constants. In addition, we will also only treat advection of the free population parallel to the veil surface. We denote by nf and nb the number density of free-swimming and bound cells, respectively. For a one-dimensional veil in a two-dimensional fluid, the dynamic equations governing the two populations of bacteria are
 |
(1) |
 |
(2) |
where vx,δ is the fluid velocity in the x-direction a height δ from the veil.
On average, bacterial veils are a few hundred microns above the surface of the sediment and the flow rates are 30–100 μm/s (Fenchel and Glud, 1998; Thar and Kuhl, 2002). This leads to an estimate of 10−2 for the Reynolds number of the fluid near the veil, and, therefore, inertial effects should be negligible. This Reynolds number is consistent with the experimental observation of a diffusive boundary layer above the veil (Thar and Kuhl, 2002). Ignoring inertial effects, the fluid velocity around the veil satisfies the incompressible Stokes equation,
 |
(3) |
where η is the viscosity of the fluid and p is the pressure.
At the veil, the bound bacteria exert a force per length, K, on the surrounding fluid. We assume that this force is directed straight down and proportional to nb. Therefore,  It is common in viscous fluid dynamics to approximate the flow generated by a continuous distribution of force generators by the flow induced by a line of singular solutions to the Stokes equation. A single point source of force acting in a viscous fluid induces a flow known as a Stokeslet (Lorentz, 1896). Dipole and doublet sources are also possible (see, for example, Pozrikidis, 1992). In this framework, boundary conditions at distant surfaces are handled using image charges (Blake, 1971). Because the Stokes equations are linear, the net flow of the fluid is given by a superposition of these singular solutions. The fluid flow generated by the bacterial veil is, therefore,
 |
(4) |
where Gij(x, x0) is the Green's function tensor describing the flow at point x generated by point sources at x0. The boundary conditions are enforced by the proper choice of Gij. In Eq. 4, i labels the Cartesian coordinates.
We will assume an infinite, one-dimensional bacterial veil at y = h. The fluid is considered to be two-dimensional and semiinfinite with a no-slip boundary condition at y = 0. Therefore, the Green's function in Eq. 4 is (Pozrikidis, 1992):
 |
(5) |
where X = x − x0,  and
and  is the location of the image charges. In Eq. 5, Sij is the two-dimensional Stokeslet tensor, and
  and
and  are the dipole potential and periodic doublet tensors that enforce the no-slip boundary condition at y = 0 (for a complete description, see Pozrikidis, 1992). Using Eqs. 4 and 5,
 |
(6) |
where
 |
(7) |
is the xy component of the Green's function (Eq. 5) evaluated at y = h + δ.
A natural rescaling of Eqs. 1 and 2 is  and
and  A typical bacterial diffusion constant is Df ∼ 10−5cm2/s (Berg, 1993). Thus, the characteristic timescale for the veil is τD ≡ h2/Df ∼ 100 s. This choice of rescaling leads to four dimensionless control parameters that define the dynamics of the system. k− = τD/τb and k+ = τD/τf are rate constants that set the relative equilibrium concentration of bound to unbound bacteria (at equilibrium, nb = k+ nf /k−).
  is the dimensionless average swimming height, and Pc = αh3/4ηDf acts like a Peclet number and defines the relative importance of advection to diffusion. Scaling arguments suggest that for
  the homogeneous equilibrium distribution of bound and unbound bacteria will be stable, whereas, for
  flow generated by the bound bacteria should lead to aggregation and hole formation as described previously. Near the veil, the fluid velocity is ∼10−2cm/s. Therefore, Pc ∼ 10.
To analyze the stability about the homogeneous distribution, we set  Expanding Eqs. 1, 2, and 6 to first order in ε leads to a linear system for the perturbations
  and
and 
 |
(8) |
where the first-order component of the advection term is
 |
(9) |
Setting the determinant of the linear system in Eq. 8 to zero defines the growth rate of the q-mode,
 |
(10) |
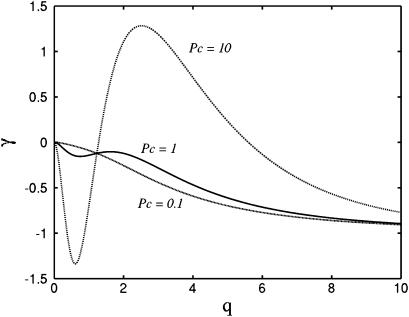
From Eq. 10, the zeros of γ are set by Pck+θ − k−q2 = 0. As these roots only depend on the ratio of k− to k+, the behavior of the instability is independent of the absolute magnitude of these rate constants. In Fig. 2, we plot γ as a function of q for Pc = 0.1, Pc = 1, and Pc = 10. We use values k+ = 10, k− = 1, and  For small values of q, the growth rate is damped out due to the inability to set up recirculating flows on length scales much longer than h. For large q, diffusion dominates and the growth rate is negative. As suggested by the scaling arguments, positive values of γ exist for
  and advection from the recirculating flow drives the system unstable. The length scale for the instability is set by q, which gives a spacing of approximately h.
FIGURE 2.
Growth rate versus wave number for Pc = 0.1 (dashed line), Pc = 1.0 (solid line), and Pc = 10 (dotted-dashed line). For all plots, k+ = 10.0, k− = 1.0, and 
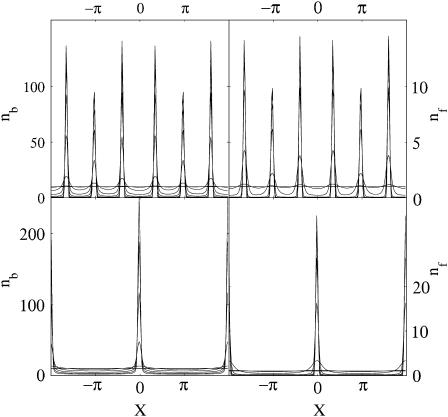
Numerical solution of Eqs. 1 and 2 using a conservation form discretization on the periodic domain −2π ≤ x ≤ 2π; two-dimensional, periodic Green's functions to integrate Eq. 6 (Pozrikidis, 1992); and an explicit, variable time-step method (MATLAB ode15s) confirms the linear stability analysis. Fig. 3 shows the onset and development of the instability over time for two different values of h. For these simulations, we set nf = 1.0 + ξf(x) and nb = 10.0 + ξb(x), where ξf,b are small random perturbations. As time progresses, a sharp peak or peaks develop in both the bound and free populations. As expected, changing h by a factor of 3 produces an equivalent change in q.
FIGURE 3.
Time evolution of nb (left) and nf (right) from numerical simulation of Eqs. 1, 2, and 6. Top panels show result for h = 1.0; bottom panels for h = 3.0.
The linear stability analysis shows a long-wave zero mode (Fig. 2). The presence of a zero mode is known to lead to chaotic behavior in some circumstances (Kliakhandler and Malomed, 1997; Tribelsky and Tsuboi, 1996). We studied the behaviors of our model on domain sizes of up to 20π in length and ran the simulations for times 10 times longer than the time it took to reach steady state. Based on these studies, we found no apparent effect due to the presence of the zero mode. Eventually a steady state is reached where the maximum density is set by the initial total concentration of bacteria. As the bacteria continuously secrete mucilage, regions of high density of bound bacteria get replenished with gel. In regions of low density, the gel presumably degrades or is washed away by the flow and a hole is formed. As the veil gets closer to the sediment surface, the wavelength of the instability decreases (Fig. 3).
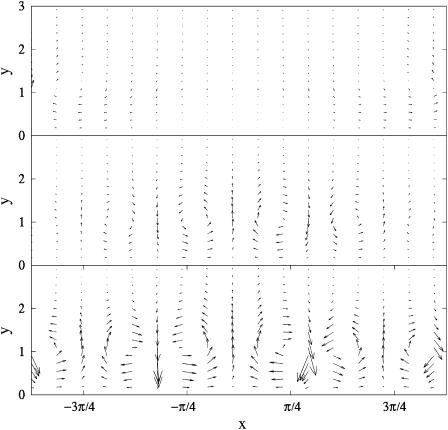
Using Eq. 4 and the numerical solution of nb, it is possible to calculate the flow in the entire two-dimensional, semiinfinite domain. Fig. 4 shows the flow at three different time steps for the simulation depicted in Fig. 3 (bottom panels). A uniform, infinite distribution of bound bacteria does not generate flow as the symmetry does not permit recirculation. At early times, the only flow that is possible arises from the random initial perturbation (Fig. 4, top panel). As the instability begins to develop, vorticity in the flow field sets up a recirculating flow pattern (Fig. 4, middle panel). Similar flows are seen near the holes in bacterial veils (see Fenchel and Glud, 1998). At late times, the sharp aggregation of the bacteria leads to localized spots of downward flow separated by wider and weaker counter current (Fig. 4, bottom panel).
FIGURE 4.
Time series of flow pattern during hole formation. (Top panel) At  random initial conditions produce a small flow. (Middle panel) At
  the bacteria have started to aggregate in three locations. At these locations there is a strong downward flow. In locations where there are fewer bacteria, the return flow dominates the flow produced by the bacteria, setting up circular flow patterns. (Bottom panel) Flow at
  Scaling of arrows in top panel is larger to make the arrows more visible.
This article demonstrates that detachment and reattachment of sulfidic bacteria to the mucus veil they create is sufficient to account for the evenly distributed pattern of holes that develop in mature veils. Experimentally, it is observed that the distance between holes is comparable to the veil height, as is predicted by this model. Simulations also show that the spacing of the holes is moderately dependent on the force exerted by the bacteria on the fluid, which may account for the larger spacing observed in veils of faster swimming bacteria. As our one-dimensional model produces a characteristic wavelength, it suggests that in two dimensions either rolls, square, or hexagonal patterns are possible. Both rolls and hexagonal patterns have been observed experimentally, suggesting that tuning of a parameter, such as the height of the veil, h, or the force per bacterium, α, will transition between these different possibilities in a more complete, two-dimensional model.
We have neglected the physical properties of the mucosal gel. Flow-through gels can lead to “hole-like” instabilities (N. G. Cogan and J. Keener, unpublished data) and may play a role in bacterial veil formation. In addition, the strong recirculating current that develops due to the aggregation of the bacteria may also lead to spatial variations in the oxygen concentration. As the bacteria are known to be chemotactic (Thar and Kuhl, 2003), oxygen gradients arising from the flow may also contribute to hole formation. An alternative model based purely on chemotaxis has recently been suggested (R. Thar and M. Kuhl, unpublished data); however, this model does not take into account the large-scale flows away from the veil or the advection of the bacteria. Similar fluid dynamical coupling may also play a substantial role in the development of bryozoan colonies (Larsen and Riisgard, 2001).
Acknowledgments
The authors thank R. Thar for useful discussions and the image in Fig. 1, and M. Zajac for a critical reading of the manuscript.
C.W. was partially supported by National Science Foundation MCB 0327716 and National Institutes of Health R01 GM072004.
References
- Berg, H. C. 1993. Random Walks in Biology. Princeton University Press, Princeton, NJ.
- Blake, J. 1971. A note on the image system for a Stokeslet in a no-slip boundary. Proc. Camb. Phil. Soc. 70:303–310. [Google Scholar]
- Bryers, J., and W. Characklis. 1982. Process governing primary biofilm formation. Biotechnol. Bioeng. 24:2451–2476. [DOI] [PubMed] [Google Scholar]
- Costerton, J., Z. Lewandowski, D. Caldwell, J. D. Korber, and H. M. Lappin-Scott. 1995. Microbial biofilms. Annu. Rev. Microbiol. 49:711–745. [DOI] [PubMed] [Google Scholar]
- Fenchel, T. 1994. Motility and chemosensory behaviour of the sulfur bacterium Thiovulum majus. Microbiology-UK. 140:3109–3116. [Google Scholar]
- Fenchel, T., and R. Glud. 1998. Veil architecture in a sulphide-oxidizing bacterium enhances countercurrent flux. Nature. 394:367–369. [Google Scholar]
- Feron, F., A. Mackay-Sim, J. Andrieu, K. Matthael, A. Holley, and G. Sicard. 1999. Stress induces neurogenesis in non-neuronal cell cultures of adult olfactory epithelium. Neuroscience. 88:571–583. [DOI] [PubMed] [Google Scholar]
- Jorgensen, B., and N. Revsbech. 1983. Colorless sulfur bacteria, Beggiatoa spp. and Thiovulum spp., in O2 and H2S, microgradients. Appl. Environ. Microbiol. 45:1261–1270. [DOI] [PMC free article] [PubMed] [Google Scholar]
- Kliakhandler, I. L., and B. A. Malomed. 1997. Short-wavelength instability in presence of a zero mode: anomalous growth law. Phys. Lett. A. 231:191–194. [Google Scholar]
- Larsen, P., and H. Riisgard. 2001. Chimney spacing in encrusting bryozoan colonies (membranipora membranacea): video observations and hydrodynamics modeling. Ophelia. 54:167–176. [Google Scholar]
- Lorentz, H. 1896. A general theorem concerning the motion of a viscous fluid and a few consequences derived from it. Versl. K Akad. W. Amsterdam. [in Dutch] 5:168–175. [Google Scholar]
- Murray, J. 1993. Mathematical Biology, 2nd Ed. Springer-Verlag, Berlin, Germany.
- Murray, J., G. Oster, and A. Harris. 1983. A mechanical model for mesenchymal morphogenesis. J. Math. Biol. 19:125–129. [DOI] [PubMed] [Google Scholar]
- Oster, G., J. Murray, and A. Harris. 1983. Mechanical aspects of mesenchymal morphogenesis. J. Embryol. Exp. Morphol. 78:83–125. [PubMed] [Google Scholar]
- Oster, G., J. Murray, and G. Odell. 1985. The formation of microvilli. In Molecular Determinants of Animal Form. Alan R. Liss, New York. 365–384.
- Pozrikidis, C. 1992. Boundary Integral and Singularity Methods for Linearized Viscous Flow. Cambridge University Press. New York.
- Stoodley, P., D. deBeer, J. D. Boyle, and H. M. Lappin-Scott. 1999. Evolving perspectives on biofilm structure. Biofouling. 14:75–90. [Google Scholar]
- Thar, R., and M. Kuhl. 2002. Conspicuous veils formed by vibrioid bacteria on sulfidic marine sediment. Appl. Environ. Microbiol. 68:6310–6320. [DOI] [PMC free article] [PubMed] [Google Scholar]
- Thar, R., and M. Kuhl. 2003. Bacteria are not too small for spatial sensing of chemical gradients. Proc. Natl. Acad. Sci. USA. 100:5748–5753. [DOI] [PMC free article] [PubMed] [Google Scholar]
- Tribelsky, M. I., and K. Tsuboi. 1996. New scenario for transition to turbulence? Phys. Rev. Lett. 76:1631–1634. [DOI] [PubMed] [Google Scholar]
- Trinkhaus, J. 1980. Formation of protrusions of the cell surface during tissue cell movement. In Tumor Cell Surfaces and Malignancy. R. Hynes and C. Fox, editors. Alan R. Liss, New York. 887–906. [PubMed]
- Wolpert, L., and W. Stein. 1984. Molecular aspects of early development. In Proceedings of Symposium on Molecular Aspects of Early Development. G. Malacinski and S. Bryant, editors. Macmillan, New York. 2–21.


