

Abstract
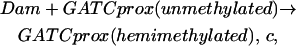
Pyelonephritis-associated pili (Pap) expression in uropathogenic Escherichia coli is regulated by a complex phase variation mechanism involving the competition between leucine-responsive regulatory protein (Lrp) and DNA adenine methylase (Dam). Population dynamics of pap gene expression has been studied extensively and the detailed molecular mechanism has been largely elucidated, providing sufficient information for mathematical modeling. Although the Gillespie algorithm is suited for modeling of stochastic systems such as the pap operon, it becomes computationally expensive when detailed molecular steps are explicitly modeled in a population. Here we developed a Markov Chain model to simplify the computation. Our model is analytically derived from the molecular mechanism. The model presented here is able to reproduce results presented using the Gillespie method, but since the regulatory information is incorporated before simulation, our model runs more efficiently and allows investigation of additional regulatory features. The model predictions are consistent with experimental data obtained in this work and in the literature. The results show that pap expression in uropathogenic E. coli is initial-state-dependent, as previously reported. However, without environment stimuli, the pap-expressing fraction in a population will reach an equilibrium level after ∼50−100 generations. The transient time before reaching equilibrium is determined by PapI stability and Lrp and Dam copy numbers per cell. This work demonstrates that the Markov Chain model captures the essence of the complex molecular mechanism and greatly simplifies the computation.
INTRODUCTION
Phase variation is an important mode of regulation in pathogenic operons. Phase variation can be characterized by a random transition in promoter configurations that result either in a highly transcriptionally active state (ON) or an inactive state (OFF). Associated with each promoter configuration, or operon state, is a corresponding steady state of the protein product of the operon. Transitions between operon states (and therefore protein steady state) occur with a frequency of ∼10−2−10−5 cells (cycles) per generation (Blyn et al., 1989). It is thought that this mechanism allows for a phenotypically diverse bacterial colony and ensures survival of at least a few individuals by always having some members already prepared for a plethora of environmental and immunogenic insult. (For a review of phase variation, see Henderson et al., 1999; Hernday et al., 2004, 2003, 2002.)
There are two fundamental approaches to model a coupled system of chemical reactions: deterministic and stochastic. The deterministic approach uses a set of differential equations to describe the system. It assumes the number of molecules can be approximated as a continuously varying quantity that varies deterministically, and the fluctuation around the average value of concentration is relatively small (Gibson and Bruck, 2000). These assumptions break down for biological systems, since the number of mRNA or proteins in cells is so small that the traditional continuous deterministic approximation does not capture the stochastic nature of the system.
Stochastic simulation of complex cellular processes using the Gillespie algorithm (Gillespie, 1976) has become common practice (McAdams and Arkin, 1997; Arkin et al., 1998; Wolf and Arkin, 2002) but remains computationally expensive despite recent progress in optimizing its performance (Gibson and Bruck, 2000; Gillespie, 2001). A continuous-time Markov model was previously used to infer system properties of the fim operon regulated by DNA inversion (Wolf and Arkin, 2002). The key feature of the fim model is that Markov states are represented as different protein-DNA complex configurations combined with mean cytosolic levels of regulatory protein at high or low steady-state concentrations. This fundamental modeling insight massively reduces the level of minutia that needs to be modeled and speeds up simulations by orders of magnitude.
Previously, we have used the Gillespie method to model Pap phase variation (Jarboe et al., 2004). Here we derive a Markov Chain model with discrete time and discrete state for the same system. Phase variable operons are typically slow switching with respect to the protein response time. The response time is a measure of the time it takes for a protein to reach the steady-state level after the operon state switches. This slow-operon-switching-fast-protein-response-time property effectively locks the operon into a particular transcriptional activity level for a long period of time (on the order of the life cycle of the bacterium or longer). This feature of the pap operon allows us to discretize the state space according to its DNA methylation pattern and leucine-responsive protein (Lrp) binding pattern. The operon state switches at the early stage of the cell cycle. Once the state is determined, it remains unchanged for the rest of the cell life before division. Thus, the timescale of our Markov Chain is cell generation and large blocks of time can be skipped between two state transitions by this discrete time point of view. More importantly, the Markov method encodes the molecular mechanism in the state transition matrix so that the operon state transition can be determined by the transition matrix in one step. The simulation is significantly accelerated compared to the Gillespie method. In this work, we developed a Markov Chain model based on the known molecular mechanisms and investigated the population dynamics of pap operon. This method reproduces the results obtained using the Gillespie method (Jarboe et al., 2004) and the increased computational efficiency allows investigation of additional regulatory features.
Summary of pap operon regulation
The detailed pap operon regulatory mechanism is reviewed elsewhere (Henderson et al., 1999; Hernday et al., 2004, 2003, 2002), and summarized in a previous modeling work (Jarboe et al., 2004). Our model focuses on the role of three regulatory proteins: DNA adenine methylase (Dam), Lrp, and PapI. The core of the Pap phase-variability is the competition between Lrp and Dam within the regulatory region. The pap regulatory region encompasses the divergently transcribed papI and papB genes together with the 400-basepair intergenic region (Hernday et al., 2002), as shown in Fig. 1. Two methylation sites, GATCprox and GATCdist (in terms of their position relative to papB), are located in the regulatory region. GATCprox and GATCdist are each overlapped by a group of Lrp binding sites (Nou et al., 1995). Phase OFF cells are fully methylated at GATCdist with Lrp bound at GATCprox, which blocks the RNA polymerase binding to DNA so that the cells are turned off. In contrast, the phase ON cells are fully methylated at GATCprox and bound by Lrp at GATCdist.
FIGURE 1.

Regulatory region of the E. coli pap operon. The papB and papI genes are divergently transcribed. GATCprox and GATCdist sites are located in the intergenic region and represented by rectangles. Both GATC sites are subjected to methylation by Dam and overlapped by the Lrp binding sites.
It was reported that the pap phase OFF-to-ON switch rate is ∼100-fold lower than the ON-to-OFF rate, resulting in a mostly phase OFF population (Blyn et al., 1989; Hernday et al., 2003). The transition from the OFF state to the ON state occurs shortly after DNA replication. During DNA replication, Lrp is dissociated from DNA. The fully methylated GATCdist site of the OFF operon becomes hemimethylated. Since the newly synthesized DNA is nonmethylated, it provides an opportunity for Lrp to bind to GATCdist. However, Lrp cannot bind to GATCdist directly. It has higher binding affinity to GATCprox and will first bind to GATCprox rather than GATCdist. Even if GATCprox becomes fully methylated, Lrp still binds to it first, but with much lower affinity (Braaten et al., 1994; Nou et al., 1993; Van der Woude et al., 1992, 1996). For switching to the ON state, Lrp must shift to GATCdist with the aid of local regulator PapI before GATCdist becomes fully methylated. Since Lrp binding and Dam methylation are mutually exclusive at GATCdist (Braaten et al., 1994), Lrp cannot shift to the fully methylated GATCdist. Thus the key to switching to the ON state is the competition occurring at both GATCprox and GATCdist. At GATCprox, Lrp binding competes with Dam methylation. At GATCdist, the translocation of Lrp-PapI complex competes with methylation. For switching from OFF state to ON state, Lrp and Lrp-PapI complex must succeed these two battles.
EXPERIMENTAL PROCEDURE
We performed experiments to verify the model prediction of population dynamics. The Pap pili expression was monitored by a pap-lacZYA promoter fusion (Braaten et al., 1994) in an E. coli K-12 strain MC4100 obtained from David Low of University of California, Santa Barbara. A single colony of the pap-lacZYA fusion strain was inoculated into a shaking tube, containing 5 mL of M9 minimal medium with 0.2% glycerol and 0.0015 mM kanamycin. The turbidity was determined by spectrophotometer. The cell growth rate in the exponential phase was 0.8 doubling/h. After ∼9–12 generations, the culture was diluted to fresh medium such that the initial optical density at 600 nm is <0.002 by calculation. Meanwhile, samples from the exponential phase culture were diluted 10−4–10−6-fold and plated on agar containing 0.2% glycerol M9 medium with 5-bromo-4-chloro-3indolyl-β-D-galactoside (X-gal, 300 μg/ml final concentration) for cell count. After 36 h of growth at 37°C, the colonies on the agar plate were scored for Lac phenotype. Colonies of Lac+ phenotype were attributed to phase ON cells. Colonies of Lac-phenotype were assigned as phase OFF cells.
MODEL DEVELOPMENT
Stochastic modeling method
To model a system in the stochastic framework, we assume that the system is in a given state, i.e., specific volume, temperature, and number of molecules of each component. Consider a set of reactions occurring in the system:
 |
 |
 |
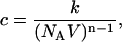
The constants c1, c2, and c3 are probability coefficients of the reactions. In our example, the probability that a molecule of A reacts with a molecule of B per unit time is c1. The probability coefficient c can be derived from the elementary reaction rate constant k. For a reaction of order n,
 |
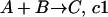
where V is the system volume and NA is Avogadro's number (Gillespie, 1976). In a system of number of molecule A (#A) and number of molecule B (#B), the probability of reaction A + B → C occurring per unit time is μ = (#A) × (#B) × c1.
We apply this probabilistic approach to the pap system and describe the Dam methylation, Lrp binding, and Lrp translocation events using chemical reactions. Each reaction has a probability coefficient. For example, consider the Dam methylation at the bare GACTprox site. This event is written in the form of a chemical reaction,
 |
which says one molecule of Dam methylates the bare GATCprox site with probability c per unit time. If there are (#Dam) molecules of Dam in the system, the probability of methylation at the bare GATCprox site is Kdam = (#Dam) * c. Note that since there is only one copy of pap operon in the cell, and such a reaction does not consume either operon or Dam, we can treat Kdam as a constant ignoring the cell volume change. Thus our model gives each event in pap regulatory system a probabilistic description.
Model assumptions
The essence of the current pap regulatory mechanism can be summarized by the following modeling assumptions:
Each time Dam methylates only one GATC site located on the top or bottom DNA strand. This event occurs with probability Kdam. Each of the four GATC sites on DNA double strands has the equal probability (Kdam) to be methylated. If Lrp is bound to GATCprox or GATCdist, Dam cannot methylate that site, since Lrp binding blocks methylation (Braaten et al., 1994; Nou et al., 1993; Van der Woude et al., 1992, 1996).
Lrp first binds to GATCprox. The methylation of GATCprox does not block Lrp binding, but lowers the Lrp binding probability (Braaten et al., 1994; Nou et al., 1993; Van der Woude et al., 1992, 1996). Thus, the chance of Lrp binding to GATCprox is in the order of GATCprox (nonmethylated) > GATCprox (hemimethylated) > GATCprox(fully methylated).
Lrp bound to GATCprox can shift to GATCdist if GATCdist is not fully methylated. The probability of Lrp translocation is affected by the DNA methylation pattern. Hemimethylation of GATCdist does not prevent Lrp movement, but reduces the translocation probability compared to unmethylated GATCdist. Consider the following three DNA configurations and assume Lrp has bound to GATCprox (Fig. 2). The translocation probability is in the order of (1) > (2) > (3). For example, in (1) the GATCprox has been fully methylated, whereas GATCdist is bare. Lrp will be very uncomfortable to sit at GTACprox and very likely to move to GATCdist. Its translocation probability will be large. In contrast, Lrp would like to stay at GATCprox in (3), as GATCdist is hemimethylated. Its translocation probability will be small.
Though Lrp can shift to GATCdist site by itself, this rarely happens. When Lrp is bound at GATCprox, PapI binds to the Lrp-GATCprox complex and facilitates the movement of Lrp to GATCdist. Because PapI is one of the gene products of the pap operon, this feedback loop maintains the switch in the ON state. In this manner, PapI can be modeled as a ligand in complex with Lrp-GATCprox. Since multiple molecules of Lrp and PapI are involved in the formation of this complex, we use the Hill equation to model the effect of PapI on Lrp translocation. Suppose the basal translocation rate of Lrp (without PapI) is Ktran, then the translocation probability in the presence of PapI is:
 (#) papI is the number of PapI molecules present in the cell; const is a constant that reflects the PapI effect on Lrp translocation. (In our simulation, n = 6, K = 25, and const = 30000; see Table 1 for Ktran).
Lrp translocation to GATCdist is irreversible.
Pap transcription machinery is highly active only when Lrp is bound to GATCdist, and GATCprox is fully methylated (the ON state). Otherwise, RNA polymerase transcribes the pap operon at a low basal rate.
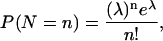
For simplicity, we model transcription and translation in a single step: O → O + P, where O is the pap operon and P is the gene product. We treat one successful transcription and translation as an event, with the occurrence frequency in time interval (0, t) following Poisson distribution. Thus, the number of PapI produced during one cell generation can be simulated by Poisson distribution,
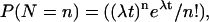 where P(N = n) is the probability of producing n molecules of PapI, and t is cell-generation time.
We assume the half-life of PapI follows exponential distribution, P(T < t) = 1 − e−λt.
We assume that each cell contains a single copy of the pap operon.
FIGURE 2.

DNA methylation pattern affects Lrp translocation. Methylated GATC sites are represented by solid rectangle with the triangle. The probabilities of Lrp translocation from GATCprox to GATCdist are in the order of (1) > (2) > (3).
Markov state space
The pap operon regulatory mechanism allows us to discretize the cell into five stable states, each defined by the pap promoter methylation and Lrp binding pattern (Fig. 3) Corresponding to each state is a steady state of the pap operon products. State 1 and state 2 are ON states. Cells in either of these states express pili on their surface. States 3–5 are OFF states. Other combinations of methylation and Lrp binding pattern either violate the mechanism or are transient states which will converge to one of the five stable states. For example, a GATC site which is not bound by Lrp must be fully methylated, because Dam will methylate it within seconds. Our model assumptions suggest that the configuration in which GATCdist is fully methylated and bound by Lrp cannot exist (violating assumptions 3 and 5). But state 5 with GATCprox fully methylated and bound by Lrp can exit, because Lrp can still bind to the fully methylated GATCprox, though with small probability reaching this state (Braaten et al., 1994; Nou et al., 1993; Van der Woude et al., 1992, 1996).
FIGURE 3.

The possible stable operon states. States 1 and 2 are ON states with Lrp-PapI complex bound to GATCdist and GATCprox fully methylated. States 3–5 are OFF states with Lrp bound to GATCprox and GATCdist fully methylated.
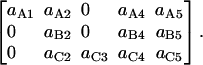
State transition matrix T
The consequence of full methylation at GATCdist (or GATCprox) is the locked-on (locked-off) state during the cell life. The state transition occurs at the early stage of the new cell cycle. Computation of the state transition matrix T is the key to our model since the new operon state is fully governed by the matrix T. Here we show that the transition matrix T can be obtained from the product of Heritance matrix (H) and a switching matrix (A), both of which can be derived from the pap phase variation mechanism. With the transition matrix, it is easy to determine the operon state switches between successive generations.
Heritance matrix H
During DNA replication, Lrp bound to the promoter region is dissociated from DNA. In addition, the newly synthesized DNA strand is nonmethylated, providing a possibility to change the DNA methylation pattern. Thus, three intermediate states defined by the methylation pattern of the newly-synthesized double-stranded DNA will emerge from the five stable states (Fig. 4). For example, the stable state 1 has 100% probability to form intermediate state A. The state 2 has 50% probability to form intermediate state A, and 50% probability to form intermediate state B. The methylation pattern of parent cells leaves epigenetic imprints to daughter cells: a pap operon in the ON state (not fully methylated at GATCdist), when replicated, will yield daughter cells with nonmethylated GATCdist. But daughters of the OFF cell are at least hemimethylated at GATCdist. In this manner, daughters of phase ON cells are more likely to attain the ON state than daughters of phase OFF cells. We store this epigenetic information in a heritance matrix H (5 × 3) (Fig. 4), with its rows corresponding to the five stable states: 1, 2, 3, 4, and 5, respectively, and its columns to the three intermediate states: A, B, and C, respectively. Each entry of H stores the transition probabilities from the corresponding stable state to the intermediate state.
FIGURE 4.

Operon transition from the stable state to the intermediate state. States 1–5 are stable states. A, B, and C are intermediate states. The transition probabilities from stable states to intermediate states are stored in the heritance matrix H.
Switching matrix A
The intermediate states are unstable. They will soon be methylated by Dam and bound by Lrp. All these events occur within minutes at the beginning of the cell cycle, resulting in one of the five stable states. The pap operon state (phase ON versus phase OFF) is thus determined. We construct a switching matrix A (3 × 5) to store the transition probabilities from the intermediate states to the stable states, with its rows corresponding to the intermediate states and columns to the stable states. We shall show how to derive the matrix A analytically.
First, it is impossible to transit from intermediate state A to state 3, from intermediate state B to state 2 and state 3, and from intermediate state C to state 1, since the methylated GATC site cannot be demethylated within the short time period before the stable state establishes. So the corresponding entries of the matrix A are zero. To compute the remaining entries, we conducted the following analysis (see Table 1 for notations).
TABLE 1.
Probability coefficients for reactions
| Reaction/event | Parameter (s−1) |
|---|---|
| Dam methylation | Kdam = 0.001 |
| Lrp binding at nonmethylated GATCprox | Klrp(1) = 0.1 |
| Lrp binding at hemimethylated GATCprox | Klrp(2) = 0.05 |
| Lrp binding at fully methylated GATCprox | Klrp(3) = 0.005 |
Lrp translocation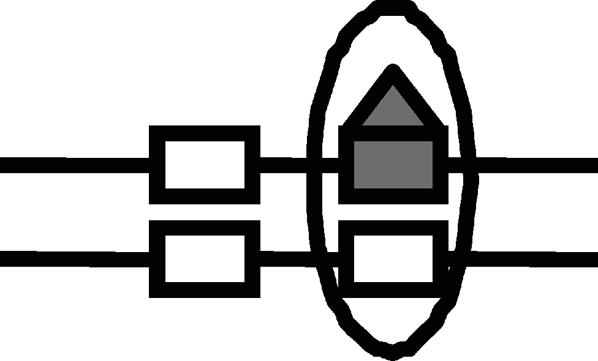
|
Ktran(1) = 1 * 10−5 |
Lrp translocation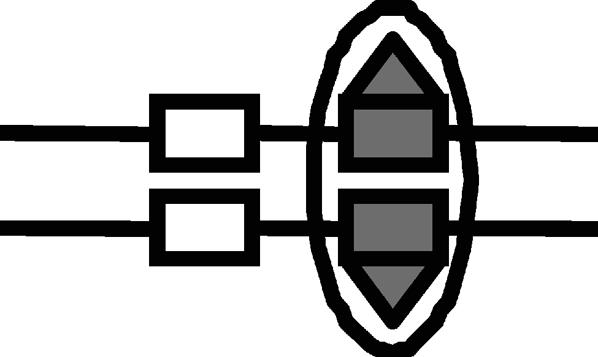
|
Ktran(2) = 5 * 10−4 |
Lrp translocation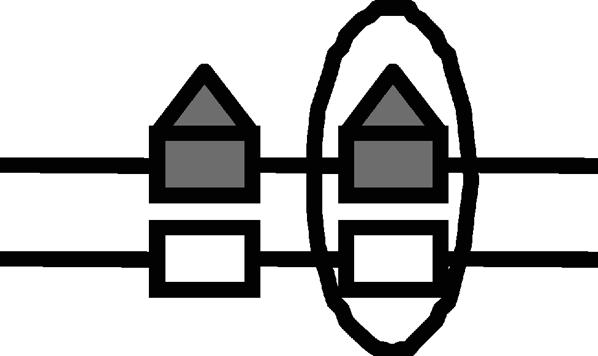
|
Ktran(3) = 6 * 10−6 |
Lrp translocation
|
Ktran(4) = 5 * 10−5 |
Lrp translocation
|
Ktran(5) = 1 * 10−6 |
Probabilities of Lrp binding at GATCprox and Lrp translocation to GATCdist are affected by the DNA methylation pattern. The corresponding DNA methylation patterns for Lrp translocation are illustrated by figures. The numerical values were used in our simulation.
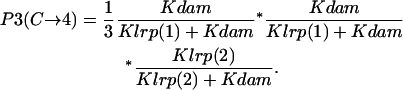
As an example, to compute the transition probability from the intermediate state A to the stable state 1, we recognize that there are two possible ways from the intermediate state A to the state 1 (Fig. 5), according to the model assumption:
- Lrp binding at GATCprox → Lrp translocation to GATCdist. The process involves two competitions: i), competition between Lrp binding and Dam methylation at GATCprox, and ii), competition between PapI-assisted Lrp translocation and methylation at GATCdist. If Lrp succeeds in both competitions, intermediate state A can get to state 1. Thus the probability of success is
with parameters defined in Table 1. The first term is the probability of Lrp binding at GATCprox before this site becomes fully methylated. The second term is the probability of Lrp translocation occurring before GATCdist becomes methylated.
- GATCprox fully methylated → Lrp binding at GATCprox → Lrp translocation. The probability of accomplishing the series of events is
Note that one-third (1/3) in the first term comes from the probability of methylating GATCprox to from the three bare GATC sites (two GATCdist and one GATCprox). The DNA methylation pattern changes along with the competition process, which affects Lrp binding and translocation probability.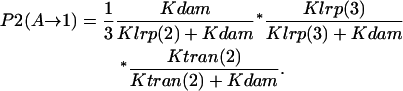
FIGURE 5.

The possible paths from the intermediate state A to the stable state 1. The success probabilities for the two paths are P1(A→1) and P2(A→1), respectively. The transition probability from intermediate state A to the stable state 1 is P1(A→1) + P2(A→1).
The transition probability from intermediate state A to state 1 is the summation of P1(A → 1) and P2(A → 1). In this way, we analytically derived the transition probability from the intermediate states to the stable states for every entry of switching matrix A (see Experimental Procedure, above). Multiplying the heritance matrix (H) by the switching matrix (A) yields the state transition matrix (T), which contains the transition probabilities among the stable states, and which completely governs the operon state transition between two successive generations.
 |
Model parameters and modeling algorithm
We use similar conditions as Jarboe et al. (2004) for simulation. Each cell has 78 Dam molecules (Boye et al., 1992; Rasmussen et al., 1995) and 343 Lrp molecules (Chen et al., 2001). The cell growth rate is 0.8 doublings/h, which is the cell growth rate under our experiment condition (M9 minimal medium containing 0.2% glycerol in shake flasks at 37°C). Since the basal pap transcription rate is approximately one-eighth of the ON transcription rate (Van der Woude et al., 1995), we assume that in one generation the phase ON cell produces an average of 64 molecules of PapI, and the OFF cell, eight molecules of PapI. Thus in the Poisson distribution,
 |
we set λ = 64 for phase ON cells and λ = 8 for phase OFF cells. We assume the average life of PapI is 100 min, and set λ = 100 for the exponential distribution, P(T < t) = 1 − e−λt. The reaction probability coefficients are listed in Table 1.
The following algorithm is used to determine the state transition from the parent cell to the daughter cell:
Initiate the operon state of the parent cell. For the ON cell, the initial state can be assigned to either state 1 or 2, which gives identical results. Similarly, the OFF cell can be assigned to states 3, 4, or 5 with no difference in results.
Determine the number of PapI in the cell based on Poisson probability
 (λ = 64 for phase ON cells, λ = 8 for phase OFF cells). The Poisson random number is given by the following procedure: Generate a series of random number ui, i = 1, …k, from the uniform distribution in the unit interval; then calculate
  and compare the product with e−λ at each k. The Poisson random number, n, is the first value of k such that the product is <e−λ.
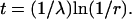
Assign an age to each PapI by the exponential distribution P(T < t) = 1 − e−λt (λ = 100). To generate an exponential random number t, one first generates a random number r from the uniform distribution in the unit interval, and then obtains the exponential random number t by
Calculate the number of PapI inherited by the daughter cell (# i-PapI) by comparing the age of PapI with the cell division time (75 min). The particular PapI molecule is passed on to the daughter cell only if its age is greater than the cell division time.
Calculate the transition matrix T using (# i-PapI) as a parameter.
Determine the operon state of the daughter cell based on the parent state and the transition probability characterized by the matrix T.
The above algorithm is repeated for each cell in the population. The following algorithm is used to simulate the population dynamics:
Inoculation. Set the initial population size p1 (p1 = 40 cells in our simulation). Set the initial generation g = 1. Set the ON fraction × 1. Assign an operon state to each cell according to the ON fraction (× 1).
Growth. Decide each daughter cell's state by the state transition algorithm stated above. Calculate the ON cell fraction for each generation. Because of cell growth, the population size doubles in each generation. To avoid excessive computation time due to overpopulation, the population size is reset to P1 after a certain generation, say 9, while keeping the current ON cell fraction. The simulation continues by repeating the above steps.
Termination. Stop simulation when a specific generation is reached.
Model prediction: population dynamics of pap expression
Using the model described above, we investigated the population dynamics of Pap operon expression. With the transition matrix describing the probability of transition between different states, model simulation shows that the populations arising from 100% ON cells or 100% OFF cells exhibit a long transient period of ∼60 generations before reaching an equilibrium level of 3% ON (Fig. 6). Note that the results from multiple simulations are shown for each initial condition. As stated above, each simulation starts with an initial population of cells and continues for many generations. Due to the stochastic nature of the events being modeled, different simulations can have slightly different results. During the transition period, the population generated from an initially ON cell contains more ON cells than the population generated from an initially OFF cell. This initial state dependency of Pap expression has been noted in the literature (Blyn et al., 1989; Braaten et al., 1994) and was reproduced using the Gillespie method (Jarboe et al., 2004). However, the details of this phenomenon remained unclear.
FIGURE 6.

Phase ON cell fraction versus cell generation. Simulations started from either 100% ON cells or 100% OFF cells. Results for four representative simulations are shown for each initial condition.
Examining the mechanism of Pap expression, we identified factors that contribute to the transient memory of expression. These factors include Pap regulation proteins, such as PapI, Lrp, and Dam, which can be passed on to the next generation if their turnover times are greater than the generation time and the degree of DNA methylation, which is semiconserved during DNA replication. Since the degree of DNA methylation is a consequence of Lrp and Dam competition, it is not an independent variable in the model. We thus focus on these three regulatory proteins.
PapI is a local regulator of the pap operon, whose expression level is controlled by the pap operon. The ON cells have a higher PapI level, which can be transferred to the daughter cells and facilitate the translocation of Lrp from GATCprox to GATCdist, thus increasing the probability of ON states. Therefore, the stability of PapI is expected to affect the generation memory. We examined the effect of PapI degradation on the operon initial state dependency (Fig. 7). In our wild-type model, the average half-life of PapI is 50 min, which is longer than the cell half-life (37.5 min). Shortening the average PapI half-life to 37.5 min decreases the initial state dependency, whereas stabilizing PapI increases the initial state dependency. The PapI half-life affects both the transition period and the equilibrium level. With a 50-min PapI half-life, the transition period lasts ∼300 generations; the Gillespie method results (Jarboe et al., 2004) simulated 10 generations only and the PapI stability was not investigated. Thus the increased computational efficiency of the Markov Chain model presented here allows a more thorough investigation of the pap regulatory elements.
FIGURE 7.

The effect of PapI half-life on the initial state dependency. Simulations were performed with average PapI half-life: 37.5 min, 50 min, and 65 min, and started from 100% ON cells. Results for three representative simulations are shown for each PapI half-life.
Lrp and Dam are global regulators. Their intracellular levels are affected by physiological and environmental factors. It has been reported that the Lrp level is cell growth-rate regulated (Chen et al., 1997, 2001; Landgraf et al., 1996; Rasmussen et al., 1994, 1995). We investigated the effect of Lrp copy number on Pap pili expression. The simulation was carried out with the wild-type Dam level (78 molecules per cell). As shown in Fig. 8, increasing the Lrp level increases the ON population during the transition period. However, the activation is saturated above 300 copies of Lrp per cell. This is reasonable, since overexpression of Lrp has a negative effect on the pap transcription. Lrp may occupy not only GATCdist but also GATCprox. When the positive and negative effects reach equilibrium, the activation by Lrp is saturated. Pap expression is also sensitive to the Dam level (Fig. 9), which affects the transient time more than the equilibrium state. Lowering the Dam level from 78 molecules/cell to 30 molecules/cell increases the transition period and equilibrium level. The effect of Lrp and Dam on pap expression was investigated using the Gillespie method (Jarboe et al., 2004) with similar results. However, with the Gillespie method only the equilibrium state was reported. The model presented here allows investigation of both the transition period and the equilibrium state.
FIGURE 8.

Effect of Lrp copy number on Pap pili expression. Results for three representative simulations are shown for each Lrp level.
FIGURE 9.

Effect of Dam copy number on Pap pili expression. Results for three representative simulations are shown for each Dam level.
Experimental verification
It has been reported that populations grown in glycerol minimal medium arising from an ON parent (100% phase ON cells) have an ON population of 34 ± 7% at the 25th generation (Blyn et al., 1989) or 27 ± 1% from the detailed simulation using the Gillespie method (Jarboe et al., 2004). Our model predicts 22 ± 6% at the 25th generation from an initially ON parent (Fig. 10). Populations arising from an OFF parent were reported to have 0.4 ± 0.2% of ON cells at the 25th generation (Blyn et al., 1989) or 2 ± 0% (Jarboe et al., 2004) using the Gillespie method. Our model predicts 3 ± 0.6% at the 25th generation (Fig. 10). Thus the Markov Chain model is in reasonable agreement with literature data and the detailed Gillespie model.
FIGURE 10.

Comparison of results from the Markov Chain model, Gillespie model (Jarboe et al., 2004), and reported data (Blyn et al., 1989). Results are presented for the wild-type model. The ON cell fraction of populations from 100% ON cells (initially ON, shaded) and 100% OFF cells (initially OFF, not shaded) are reported. The y axis is log scale. Error bars represent one standard deviation.
To verify the population dynamics during the transition period, we performed experiments starting from populations with different ON fractions and measured the ON fraction up to 100 generations. The detailed method is described in Experimental Procedure, above. The Pap pili expression was monitored by use of a pap-lacZYA promoter fusion (Braaten et al., 1994). Experiment 1 started with a population of 9.57% phase ON cells. Experiment 2 started with a population of 2.65% phase ON cells. The experimental results are consistent with the trends predicted by our model, although there is a consistent underestimation of the ON state by the model after 20 generations (Fig. 11). This underestimation may be due to a slight discrepancy in the estimated parameter values. The experimental data also confirms the convergence of the ON cell fraction. Starting from 9.57% ON cells, the population contains ∼3% ON cells eventually. But if the ON cell fraction falls into the equilibrium region, as in Experiment 2, it remains at this level with only small fluctuations from generation to generation.
FIGURE 11.

Comparison of the Markov Chain model results and our experimental results. Error bars represent one standard deviation. (a) Both simulation and experiment started from the ON fraction of 9.57%. (b) Both simulation and experiment started from the ON fraction of 2.65%. Results are shown for five representative simulations in both a and b.
DISCUSSION
Mathematical modeling provides detailed characterization of dynamics for complex systems. For phase variable transcriptional control, stochastic fluctuations tend to dominate the system behavior. Therefore, conventional deterministic modeling approaches do not adequately represent the behavior of such systems. Instead, stochastic approaches such as Gillespie's method (Gillespie, 1976) are a natural choice. Jarboe et al. (2004) have used the Gillespie method to model the Pap phase variation mechanism. However, because the Gillespie method explicitly accounts for the individual reactive collisions among the molecules (Puchalka and Kierzek, 2004), it becomes computationally expensive for a complex system involving large number of molecules and reactions, such as the Pap system. Here we developed a simplified model based on the Markov Chain approach that allows efficient simulation of population dynamics.
In the pap system, the Markov state space is well defined by the DNA methylation and Lrp binding patterns at the control region of the operon, which we termed the operon state. The operon state is determined soon after cell division. Once decided, it is locked for the remainder of the generation. Thus the Markov Chain has discrete time points defined by cell division. The transition between the operon states is primarily governed by two competitions: competition between methylation and Lrp binding at GATCprox, and competition between methylation and Lrp translocation at GATCdist. Instead of simulating each individual molecular interaction in the Gillespie method, the Markov Chain approach precalculates the transition probabilities analytically based on detailed molecular mechanism of these competitions. The Markov Chain model presented here reproduces results obtained using the Gillespie method (Jarboe et al., 2004) and allows investigation of more computationally intensive components of pap regulation. Hence, the Markov Chain model significantly accelerates simulation and still captures the essence of population dynamics in molecular terms.
Our model framework is based on the molecular mechanisms, but most of the parameters are estimated since the literature data are sparse. The model prediction was partially validated experimentally, based both on literature and data reported in this work, suggesting that the parameters used are realistic. The consistent underestimation of the frequency of the ON state after many generations suggests discrepancy with the estimated parameters. In particular, we focused on the initial state dependency of Pap expression. Our experimental data for population dynamics from two different initial states agreed reasonably well with the model prediction. Furthermore, our model predicts that after a transition period, the population will reach an equilibrium state with ON fraction at ∼3%. The length of transition period is determined by PapI stability and the copy number of Lrp and Dam per cell. The convergence of the ON fraction has biological relevance. In general, the cell favors the OFF state more than the ON state. The ON-to-OFF switch rate is 100-fold higher than the OFF-to-ON rate (Blyn et al., 1989; Hernday et al., 2003). The default OFF state could save cellular energy when pili expression may not be needed or could be deleterious (Hernday et al., 2003). It is advantageous for the population to keep only a small fraction of ON cell after it has settled down in a new environment. The population conserves energy by doing this. On the other hand, it can rapidly convert to phase ON state if Pap pili confer a selective advantage to new environmental stimuli.
If a population needs to stay in the ON state for a longer time, for example, to better adapt to a new environment, what should it do? Our model suggests the adaptation could be achieved by controlling the PapI degradation and the copy numbers of Lrp and Dam. We hypothesize that by sensing the environmental factors, the protein degradation machinery may make the decision to stabilize PapI, which strengths the parent-to-daughter memory and keep the high ON fraction longer. This hypothesis remains to be tested. The model also suggests that Lrp has significant effects on pap expression at a low concentration; at the high concentration, the Lrp effect is saturated. This is confirmed by reported data that pap expression is not affected by exogenous leucine when Lrp is present in micromolar concentration (Braaten et al., 1994; White-Ziegler et al., 2000). On the other hand, decreasing Dam copy number significantly elongates the transition period and increases the equilibrium level, both of which contribute to adapting to environmental change.
APPENDIX: DERIVATION OF SWITCHING MATRIX A
The switching matrix A is derived entry by entry from the pap regulatory mechanism. (See Table 1 for notations. Note that P in the formula stands for probability.)
Intermediate state A → stable state 1
- Lrp binding at GATCprox → Lrp translocation:

- GATCprox fully methylated → Lrp binding at GATCprox → Lrp translocation:

Probability (intermediate state A → stable state 1) = P1(A → 1) + P2(A → 1).
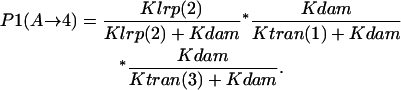
Intermediate state A → stable state 2
- Lrp binding at GATCprox → GATCdist hemimethylated → Lrp translocation:
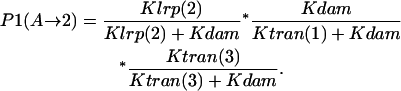
- GATCprox fully methylated → Lrp binding at GATCprox → GATCdist hemimethylated → Lrp translocation:
- GATCprox fully methylated → GATCdist hemimethylated → Lrp binding at GATCprox → Lrp translocation:

- GATCdist hemimethylated → Lrp binding at GATCprox → Lrp translocation:
- GATCdist hemimethylated → GATCprox fully methylated → Lrp binding at GATCprox → Lrp translocation:
Probability (intermediate state A → stable state 2) = P1(A→2) + P2(A→2) + P3(A→2) + P4 (A→2) + P5(A→2).
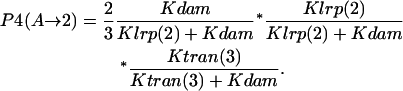
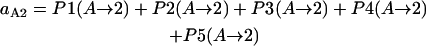
Intermediate state A → stable state 4
- Lrp binding at GATCprox → GATCdist hemimethylated → GATCdist fully methylated:
- GATCdist hemimethylated → Lrp binding at GATCprox → GATCdist fully methylated:

- GATCdist hemimethylated → GATCdist fully methylated → Lrp binding at GATCprox:

Probability (intermediate state A → stable state 4) = P1(A→4) + P2(A→4) + P3(A→4).
Intermediate state A → stable state 5
Probability (intermediate state A → stable state 5) = 1 − P(A→1) − P(A→2) − P(A→4).
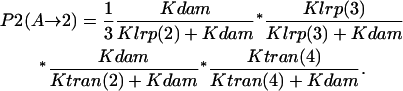
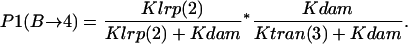
Intermediate state B → stable state 2
- Lrp binding at GATCprox → Lrp translocation:
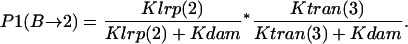
- GATCprox fully methylated → Lrp binding at GATCprox → Lrp translocation:
Probability (intermediate state B → stable state 2) = P1(B→2) + P2(B→2).
Intermediate state B → stable state 4
- Lrp binding at GATCprox → GATCdist fully methylated:
- GATCdist fully methylated → Lrp binding at GATCprox:

Probability (intermediate state B → stable state 4) = P1(B→4) + P2(B→4).
Intermediate state B → stable state 5
Probability (intermediate state B → stable state 5) = 1 − P(B→2) − P(B→4).
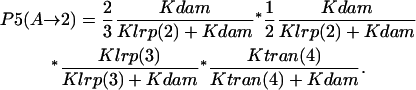
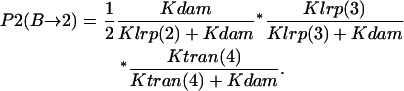
Intermediate state C → stable state 2
- Lrp binding at GATCprox → Lrp translocation:

- GATCprox hemimethylated → Lrp binding at GATCprox → Lrp translocation:

- GATCprox hemimethylated → GATCprox fully methylated → Lrp binding at GATCprox → Lrp translocation:
Probability (intermediate state C → stable state 2) = P1(C→2) + P2(C→2) + P3(C→2).
Intermediate state C → stable state 3
- Lrp binding at GATCprox → GATCdist fully methylated:

- GATCdist fully methylated → Lrp binding at GATCprox:
Probability (intermediate state C → stable state 3) = P1(C→3) + P2(C→3).
Intermediate state C → stable state 4
- GATCprox hemimethylated → Lrp binding at GATCprox → GATCdist fully methylated:
- GATCprox hemimethylated → GATCdist fully methylated → Lrp binding at GATCprox:
- GATCdist fully methylated → GATCprox hemimethylated → Lrp binding at GATCprox:
Probability (intermediate state C → stable state 4) = P1(C→4) + P2(C→4) + P3(C→4).
Intermediate state C → stable state 5
Probability (intermediate state C → stable state 5) = 1 − P(C→2) − P(C→3) − P(A→4).
 |
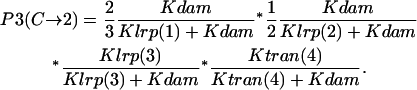
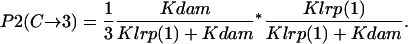
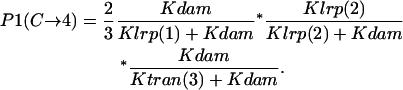
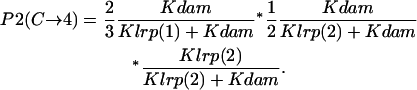
In summary, the entries of switching matrix A = are
 |
 |
 |
 |
 |
 |
 |
 |
 |
 |
 |
 |
 |
 |
 |
References
- Arkin, A., J. Ross, and H. H. McAdams. 1998. Stochastic kinetic analysis of developmental pathway bifurcation in phage λ-infected Escherichia coli cells. Genetics. 149:1633–1648. [DOI] [PMC free article] [PubMed] [Google Scholar]
- Blyn, L. B., B. A. Braaten, C. A. Whiteziegler, D. H. Rolfson, and D. A. Low. 1989. Phase variation of pyelonephritis-associated pili in Escherichia coli—evidence for transcriptional regulation. EMBO J. 8:613–620. [DOI] [PMC free article] [PubMed] [Google Scholar]
- Boye, E., M. G. Marinus, and A. Lobnerolesen. 1992. Quantitation of dam methyltransferase in Escherichia coli. J. Bacteriol. 174:1682–1685. [DOI] [PMC free article] [PubMed] [Google Scholar]
- Braaten, B. A., X. W. Nou, L. S. Kaltenbach, and D. A. Low. 1994. Methylation patterns in pap regulatory DNA control pyelonephritis-associated pili phase variation in Escherichia coli. Cell. 76:577–588. [DOI] [PubMed] [Google Scholar]
- Chen, C. F., J. Lan, M. Korovine, Z. Q. Shao, L. Tao, J. Zhang, and E. B. Newman. 1997. Metabolic regulation of Lrp gene expression in Escherichia coli K-12. Microbiology. (UK). 143:2079–2084. [DOI] [PubMed] [Google Scholar]
- Chen, S. L., Z. Q. Hao, E. Bieniek, and J. M. Calvo. 2001. Modulation of Lrp action in Escherichia coli by leucine: effects on non-specific binding of Lrp to DNA. J. Mol. Biol. 314:1067–1075. [DOI] [PubMed] [Google Scholar]
- Gibson, M., and J. Bruck. 2000. Efficient exact stochastic simulation of chemical systems with many species and many channels. J. Phys. Chem. 104:1876–1889. [Google Scholar]
- Gillespie, D. T. 2001. Approximate accelerated stochastic simulation of chemically reacting systems. J. Chem. Phys. 115:1716–1733. [Google Scholar]
- Gillespie, D. T. 1976. General method for numerically simulating stochastic time evolution of coupled chemical reactions. J. Comput. Phys. 22:403–434. [Google Scholar]
- Henderson, I. R., P. Owen, and J. P. Nataro. 1999. Molecular switches—the ON and OFF of bacterial phase variation. Mol. Microbiol. 33:919–932. [DOI] [PubMed] [Google Scholar]
- Hernday, A., B. Braaten, and D. Low. 2004. The intricate workings of a bacterial epigenetic switch. Adv. Exp. Med. Biol. 547:83–89. [DOI] [PubMed] [Google Scholar]
- Hernday, A., B. Braaten, and D. Low. 2003. The mechanism by which DNA adenine methylase and PapI activate the pap epigenetic switch. Mol. Cell. 12:947–957. [DOI] [PubMed] [Google Scholar]
- Hernday, A., M. Krabbe, B. Braaten, and D. Low. 2002. Self-perpetuating epigenetic pili switches in bacteria. Proc. Natl. Acad. Sci. USA. 99:16470–16476. [DOI] [PMC free article] [PubMed] [Google Scholar]
- Jarboe, L. R., D. Beckwith, and J. C. Liao. 2004. Stochastic modeling of the phase-variable pap operon regulation in uropathogenic Escherichia coli. Biotechnol. Bioeng. 88:189–203. [DOI] [PubMed] [Google Scholar]
- Landgraf, J. R., J. C. Wu, and J. M. Calvo. 1996. Effects of nutrition and growth rate on Lrp levels in Escherichia coli. J. Bacteriol. 178:6930–6936. [DOI] [PMC free article] [PubMed] [Google Scholar]
- Puchalka, J., and A. M. Kierzek. 2004. Bridging the gap between stochastic and deterministic regimes in the kinetic simulations of the biochemical reaction networks. Biophys. J. 86:1357–1372. [DOI] [PMC free article] [PubMed] [Google Scholar]
- McAdams, H. H., and A. Arkin. 1997. Stochastic mechanisms in gene expression. Proc. Natl. Acad. Sci. USA. 94:814–819. [DOI] [PMC free article] [PubMed] [Google Scholar]
- Nou, X. W., B. Braaten, L. Kaltenbach, and D. A. Low. 1995. Differential binding of Lrp to two sets of pap DNA-binding sites mediated by PapI regulates pap phase variation in Escherichia coli. EMBO J. 14:5785–5797. [DOI] [PMC free article] [PubMed] [Google Scholar]
- Nou, X. W., B. Skinner, B. Braaten, L. Blyn, D. Hirsch, and D. Low. 1993. Regulation of pyelonephritis-associated pili phase-variation in Escherichia coli—binding of the Papl and the Lrp regulatory proteins is controlled by DNA methylation. Mol. Microbiol. 7:545–553. [DOI] [PubMed] [Google Scholar]
- Rasmussen, L. J., A. Lobnerolesen, and M. G. Marinus. 1995. Growth-rate-dependent transcription initiation from the Dam P2 promoter. Gene. 157:213–215. [DOI] [PubMed] [Google Scholar]
- Rasmussen, L. J., M. G. Marinus, and A. Lobnerolesen. 1994. Novel growth-rate control of Dam gene-expression in Escherichia coli. Mol. Microbiol. 12:631–638. [DOI] [PubMed] [Google Scholar]
- Van der Woude, M., B. Braaten, and D. Low. 1996. Epigenetic phase variation of the pap operon in Escherichia coli. Trends Microbiol. 4:5–9. [DOI] [PubMed] [Google Scholar]
- Van der Woude, M. W., L. S. Kaltenbach, and D. A. Low. 1995. Leucine-responsive regulatory protein plays dual roles as both an activator and a repressor of the Escherichia coli pap fimbrial operon. Mol. Microbiol. 17:303–312. [DOI] [PubMed] [Google Scholar]
- Van der Woude, M. W., B. A. Braaten, and D. A. Low. 1992. Evidence for global regulatory control of pilus expression in Escherichia coli by Lrp and DNA methylation—model-building based on analysis of pap. Mol. Microbiol. 6:2429–2435. [DOI] [PubMed] [Google Scholar]
- White-Ziegler, C. A., A. Villapakkam, K. Ronaszeki, and S. Young. 2000. H-NS controls pap and DAA fimbrial transcription in Escherichia coli in response to multiple environmental cues. J. Bacteriol. 182:6391–6400. [DOI] [PMC free article] [PubMed] [Google Scholar]
- Wolf, D. M., and A. P. Arkin. 2002. Fifteen minutes of fim: control of type 1 pili expression in E. coli. OMICS. 6:91–114. [DOI] [PubMed] [Google Scholar]