

Abstract
Molecular dynamics simulations of a homology model of the ligand binding domain of the α7 nicotinic receptor are conducted with a range of bound ligands to induce different conformational states. Four simulations of 15 ns each are run with no ligand, antagonist d-tubocurarine (dTC), agonist acetylcholine (ACh), and agonist ACh with potentiator Ca2+, to give insight into the conformations of the active and inactive states of the receptor and suggest the mechanism for conformational change. The main structural factor distinguishing the active and inactive states is that a more open, symmetric arrangement of the five subunits arises for the two agonist simulations, whereas a more closed and asymmetric arrangement results for the apo and dTC cases. Most of the difference arises in the lower portion of the ligand binding domain near its connection to the adjacent transmembrane domain. The transfer of the more open state to the transmembrane domain could then promote ion flow through the channel. Variation in how subunits pack together with no ligand bound appears to give rise to asymmetry in the apo case. The presence of dTC expands the receptor but induces rotations in alternate directions in adjacent subunits that lead to an asymmetric arrangement as in the apo case. Ca2+ appears to promote a slightly greater expansion in the subunits than ACh alone by stabilizing the C-loop and ACh positions. Although the simulations are unlikely to be long enough to view the full conformational changes between open and closed states, a collection of different motions at a range of length scales are observed that are likely to participate in the conformational change.
INTRODUCTION
The many details of the ligand-induced conformational change in nicotinic acetylcholine receptors (nAChRs), a change that leads to ion conduction through the receptor pore, are beginning to be pieced together into a coherent mechanism (Itier and Bertrand, 2001; Grutter and Changeux, 2001; Sine, 2002; Karlin, 2002; Unwin, 2003; Absalom et al., 2004; Lester et al., 2004). This process has been especially aided by the determination of atomistic structures of AChBP (Brejc et al., 2001; Sixma and Smit, 2003; Celie et al., 2004), a distant homolog of the ligand binding domain of nAChR, and a structure of the transmembrane domain (TMD) of the receptor from the Torpedo electric organ (Miyazawa et al., 2003). The AChBP crystal structure with bound HEPES appears to be in a ligand-bound state now that a crystal structure with agonists bound has been solved (Celie et al., 2004). This ligand-bound structure should correspond to either an active or desensitized state for nAChRs. Upon agonist binding, the residues of the binding site are believed to form an aromatic cage (Lester et al., 2004), drawing the C-loop toward the binding site (Karlin, 2002; Fairclough et al., 2003), a motion particularly evident by comparing the recent AChBP crystal structures with and without carbamoylcholine (Celie et al., 2004). This C-loop motion in turn somehow propagates downward toward the TMD (Grosman et al., 2000; Chakrapani et al., 2004). Electron microscopy (EM) data of the Torpedo receptor with and without the agonist acetylcholine (ACh) bound reveal a 15° clockwise rotation of the lower part of the inner sheet relative to the outer sheet (Unwin, 1995; Unwin et al., 2002), which may be transmitted to the TMD M2 helices that open up the channel (Unwin, 2003; Lester et al., 2004; Absalom et al., 2004; Corry, 2004). In heteromeric nAChRs such as the muscle receptor, it has been observed that only the two nonadjacent α subunits undergo significant conformational change from a nonequivalent to an equivalent form relative to the other three subunits in the pentamer, leading to a pseudosymmetric state (Unwin et al., 2002). Simulations imply that this asymmetry in the resting state extends to homomeric receptors such as the α7 nAChR (Henchman et al., 2003).
The strategy employed in this work is to perturb a homology model of the ligand binding domain (LBD) of the α7 nAChR toward different functional states by placing appropriate ligands in the binding sites and running separate molecular dynamics (MD) simulations to relax the structure toward the appropriate state for the bound molecule. Four simulations of 15 ns are run. An apo simulation is run to bring the system to a resting state; an antagonist-bound simulation would bring about another inactive state; an agonist simulation should maintain an active state; and an agonist with potentiator bound should lead to an enhanced active state. The antagonist used here is d-tubocurarine (dTC), a natural product produced by the curare vine that is a μM inhibitor of α7 (Chavez-Noriega et al., 1997). The agonist used is the endogenous neurotransmitter ACh, and the potentiator is Ca2+, which is bound in a location near to the binding site to the residues E161 and D163, which in mutation experiments have been implicated in affecting the Ca2+ response (Galzi et al., 1996). The other suspected Ca2+ binding site, nearer the TMD at E44 and E172, has not been studied here (Galzi et al., 1996; Le Novère et al., 2002). Having generated different structures for different ligands, the goal is then to understand the mechanism of how ligand binding induces these conformational changes to various functional states. This is done by characterizing the motion in the binding pockets, ligand motion, subunit interfaces, and motions elsewhere in the entire LBD and looking for correlations between all of these.
METHOD
System setup
The preparation of the α7 ligand binding domain homology model has been described elsewhere (Henchman et al., 2003). In summary, the homology model was built from the AChBP crystal structure (Brejc et al., 2001) using MODELLER (Šali and Blundell, 1993). Four α7-ligand complexes were prepared in total: apo, five ACh molecules, five dTC molecules, five ACh ions, and five Ca2+ ions. ACh and dTC were docked into each of the five binding sites individually using AutoDock (Morris et al., 1998) and the same protocol as described earlier (Henchman et al., 2003). Ca2+ ions were placed at the midpoint of the terminal side-chain carbons of E188 on the C-loop on one subunit, and of E161 and D163 on the G-loop of the other subunit. Fig. 1 shows the location of these residues and loops. Water oxygen atoms were added using GRID (Goodford, 1985) and hydrogens were added using WHAT IF (Vriend, 1990). For the apo protein, 74 Na+ and 54 Cl− ions were randomly swapped with single water molecules. These ion concentrations, when combined with the −20 charge of the LBD, produce a neutral system that closely mimics physiological 0.15-M and 0.11-M concentrations for Na+ and Cl− ions. For the liganded systems, an appropriately smaller number of Na+ ions was added to conserve neutrality. The protein and ions were modeled with the AMBER parm99 force field (Wang et al., 2000) and water by TIP3P (Jorgensen et al., 1983). ACh and dTC were modeled with the GAFF force field (Wang et al., 2004), and dTC were modeled with the GAFF force field (Wang et al., 2004) and RESP charges (Bayly et al., 1993) derived from a Gaussian optimization (HF/6-31G*) (Frisch et al., 1998).
FIGURE 1.

Location of all the residues discussed in the text (Y187 in the binding site is omitted for clarity but is shown later) at the interfaces between two subunits. The coordinates are from the starting homology model. The Cys-loop, β1-β2 linker, C-loop, G-loop, and chain termini are also marked.
MD protocol
Simulations were conducted using the NAMD2 program (Kale et al., 1999), periodic boundary conditions, and the particle mesh Ewald (Essmann et al., 1995) with a grid size of 100 Å in each direction. The nonbonded cutoff was 9 Å, the switching distance for smoothing was 8 Å, and the nonbonded pair-list distance was 10.5 Å; SHAKE (Ryckaert et al., 1977) for bonds to hydrogens with a rigid tolerance of 10−8 Å allowed a 2-fs time step; the r-RESPA multiple time-step method (Tuckerman et al., 1992) was employed with 2 fs for bonded, 4 fs short-range for nonbonded, and 8 fs for long-range electrostatic forces; the NPT ensemble was maintained with a Langevin thermostat with damping force of 1 ps−1 and an isotropic Langevin Piston barostat with a period of 200 fs and decay time of 500 fs. With restraints on all nonsolvent heavy atoms of 30 kcal mol−1Å−2, each system was first minimized for 1000 steps using conjugate gradient and the line-search algorithm. This was followed by 10 ps of solvent-only equilibration at 50 K followed by ten 10-ps runs with progressively lower restraints and higher temperature, finishing at no restraints and 310 K. Each simulation then continued on for 15 ns. All simulations were run on 64 processors of Blue Horizon at the San Diego Supercomputer Center.
Analysis methods
The same coloring scheme and nomenclature is used as in our earlier article (Henchman et al., 2003). The five subunits are named SA, SB, SC, SD, and SE and colored yellow, orange, red, pink, and purple, respectively. Interfaces are denoted by the two subunits that form them. For example, IAB is the interface between SA and SB, and at this interface, SA is referred to as the principal subunit and SB as the complementary subunit (Celie et al., 2004). The location of all residues and loops discussed in the text are shown in Fig. 1. An explanation of loop nomenclature may be found elsewhere (Sine et al., 2002). The two nitrogens in dTC are numbered as N1 and N2 according to Gao et al. (2003). N1 is the lower nitrogen in the docked orientation. Analysis of the data over the whole simulation is done at 10-ps intervals. All plots are smoothed using 100-ps bins to aid readability. All structural figures were made in VMD (Humphrey et al., 1996) and Raster3D (Merritt and Bacon, 1997).
Radius of gyration
The radius of gyration, Rg, measures the breathing of the pore of the LBD by quantifying the degree to which each subunit expands inward or outward relative to the central pore axis (aligned with the z axis). It is defined as
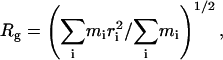 |
where the sum is over Cα atoms of the protein, mi is the mass of the atom, and ri = (x2 + y2)1/2 is the distance between the atom and the central axis of the LBD pore (the z axis).
Molecule unwrapping
A coordinate transformation is applied that unwraps the protein, making it easier to view all the subunits simultaneously with minimal distortion. The coordinate transformation is a mapping from cylindrical coordinates (r, θ, z) to a new set of cartesian coordinates (x′,y′,z′) as follows:
 |
The arbitrary parameter rscale maps the angular θ coordinate to a distance and is set to 25 Å, the most common r value of all atoms in the receptor, a choice which minimizes distortion.
Chameleon plots
These plots use color to visualize conformational change during the simulation along a specific coordinate of interest. They alleviate the difficulties of observing subtle changes that are difficult to observe with more established methods such as superimposition. The change measured is the change in ri for each Cα atom from the starting value to the value averaged over the last 5 ns after superimposition of the whole receptor on the starting structure. This change is mapped onto the protein structure with blue indicating an increase, red a decrease, and white no change. The darkest shades of blue and red indicate motions of 6 Å or more. Similar plots in the z and θ coordinates are also possible but were found to display less interesting motion and are not shown.
Subunit interface
The amount of contact at the subunit interfaces for a given structure is quantified as the number of interactions between atom pairs with van der Waals surfaces closer than 3 Å, where each atom comes from a different subunit. The location of where the contacts are taking place averaged over the whole simulation is indicated with a density grid, termed a contact density. The value in each grid box is calculated as the double sum  , where njt is the number of neighboring atoms (defined above) in a different subunit for atom j at time t. Structures are taken every 10 ps and a 1-Å grid is used and viewed with an isosurface at value 100.
Ligand angle
The flexibility of the ligand in the binding site is quantified using the angle of the internal ligand axis with the central pore z axis of the LBD. The ligand axis for ACh is the nitrogen-carbonyl carbon axis for ACh. For dTC, it is the N1-oxygen axis using the methoxy oxygen on the same aryl ring as the hydroxy group.
Ligand density
The distributions of positions of the ligands are visualized using density plots of a few key atoms accumulated over the whole simulation. The grids are calculated for the nitrogen and carbonyl carbon on ACh, the two nitrogens, N1 and N2, and the same methoxy oxygen as used for the ligand axis of dTC, and the Ca2+ ion itself. Ligand positions every 10 ps are accumulated, the grid has a 1-Å resolution, and the plots are visualized with an isosurface of value 5.
RESULTS
Breathing motions of the pentamer
The aim of this work is to determine the nature of active and inactive conformations of the LBD. Indeed, different configurations of the pentamers are observed for each of the four simulations. The right-hand side of Fig. 2 shows the initial structure together with the final structure of each simulation. The radius of gyration plots on the left of Fig. 2 quantify how much each subunit moves inward or outward about the central pore. The first striking observation is that the apo structure contracts slightly, whereas the three liganded structures expand. The average Rg is lowest for the apo simulation at ∼25.6 Å (averaged over the last 5 ns) but larger for the three liganded simulations: 26.4 Å for dTC, 26.3 Å for ACh, and 26.5 Å for Ca2+/ACh. The determining factor in this expansion seems to be the presence of a ligand.
FIGURE 2.

Initial structure (top) and final structures after 15 ns for the four simulations, apo, dTC, ACh, and Ca2+/ACh. Shown are the Cαs of each subunit with radius two times the van der Waals radius. Cαs are colored according to the subunit (A, yellow; B, orange; C, red; D, pink; and E, purple). The radius of gyration, Rg, is also plotted as a function of time for each subunit and simulation, smoothed over 100-ps intervals, with the coloring matching the subunits and the total receptor (black).
An even more striking observation is that the apo and dTC structures appear more asymmetric, whereas the ACh and Ca2+/ACh structures are more symmetric. In particular, for apo, two subunits, SC and SE, move outward, whereas the other three move inward. This same asymmetry with nonadjacent subunits moving outward was observed in an earlier simulation of α7 (Henchman et al., 2003), although in that case it was SA and SD that moved outward, and the asymmetry arose very early in the simulation rather than at the 9-ns mark as found in this simulation. The only significant differences between the two simulation protocols are the simulation program NAMD instead of AMBER and the slightly higher temperature of 310 K in this simulation instead of 300 K, as used before. This confirming result adds credence to this observation of asymmetry, and the fact that different subunits moved inward and outward suggests that the very nearly symmetrical initial structure was not biased to move in one particular direction but was probably sensitively dependent on the random initial velocities of the atoms. The asymmetry for dTC is slightly different. SD moves substantially outward, SA moves outward a small amount, and SE moves inward, although it is clear that this trend is not uniform throughout the simulation for subunits SA, SB, and SC. Even though the subunits move outward on average, the central pore appears to be narrower due to some degree of subunit rotation. The Rg values for the subunits of the ACh and Ca2+/ACh structures are much more uniform. Only SE in the Ca2+/ACh structure fails to expand outward. Presumably, these motions may be directly transmitted from the LBD to the narrow ion-gating region of the TMD and are a plausible explanation for initiating ion flow, discussed later.
Details of the breathing motions
One of the limitations of the subunit Rg is that it only indicates motion of the whole subunit and does not indicate more detailed motions at a smaller scale. It is impossible to tell from this analysis whether the motions are arising from rigid body motion of the whole subunit or much smaller parts such as loops. Hence, a more detailed description is desired. Chameleon plots (see Methods) were devised for this purpose, together with molecule unwrapping (see Methods) to aid in the visualization of the whole receptor at one time. Fig. 3 contains a chameleon plot for each simulation and displays motion in the radial coordinate, r. From these plots, it is immediately apparent which parts of the receptor have moved. In the apo case, it can be seen that the outward motion, colored blue in subunits SC and SE, is not a purely rigid body motion but rather involves only the lower portion of the receptor, indicating internal subunit flexibility. More notably, the motion takes place lower down in the LBD, exactly where it needs to to influence the TMD. Of the other three subunits, the lower parts of SB and SD remain fairly stationary, whereas that of SA moves inward quite substantially. These motions correspond to counterclockwise rotation for SA and SE and clockwise motion for SC. Counterclockwise rotation would be consistent with the directions of motions observed in EM (Unwin et al., 2002) if the LBD is relaxing to the resting state. The motion appears to involve a distortion of the β-sheet involving a small degree of relative motion between the inner and outer sheets, as hypothesized from EM data (Unwin et al., 2002). In most cases, both loops in this region, the Cys-loop and the β1-β2 linker, display little individual motion relative to the β-strands to which they are attached. Being at the interface with the TMD, their mobility is expected to be greatly restricted in the full receptor, although some mobility may still be required to communicate motion.
FIGURE 3.

Chameleon plot for the unwrapped LBD (not the real structure) of the r coordinate for the four simulations, apo, dTC, ACh, and Ca2+/ACh from top to bottom. The change in r for each Cα about the central axis relative to that of the starting structure is calculated and averaged over the last 5 ns for each simulation. A Cα with a positive value that corresponds to outward motion is colored blue, one with a negative value is colored red, and one with no change is white. The darkest shade of red or blue indicates a 6-Å change.
Another important motion in the apo simulation takes place in the C-loop, an important loop that forms one side of the binding site (see Fig. 1). The mostly white and slightly red color of the loop for all subunits matches closely the color on the adjacent subunit, indicating the motion of the C-loop is also heavily correlated with the subunit to which it is attached. The distance between the Cαs of C189 on the C-loop and L118 on the complementary subunit shown in Fig. 4 A gives an alternative measure of how closely packed is the C-loop. This distance, initially at 10.5 Å in the homology model, rapidly moves inward and hovers around 9 Å for most subunits in the apo simulation. This was also observed in a previous apo simulation (Henchman et al., 2003). On occasions it does fluctuate up to 16 Å for SA and 13 Å for SC and SD, showing that the loop is mobile and does swing out. The remaining motion of interest in the chameleon plots is the small but consistent contraction in the upper half of all subunits, particularly on the left side of the N-terminal helix. This would contribute to the inward motion of the subunits.
FIGURE 4.

Plots of various quantities as a function of time for all four simulations, apo, dTC, ACh, and Ca2+/ACh, from top to bottom, smoothed over 100-ps intervals. The coloring is according to the principal subunit at the interface as described in Fig. 2. (A) The distance between the Cαs of C189 and L118. (B) The number of subunit interface contacts at an interface between pairs of atoms, each of which is on neighboring subunits. A contact is defined if the distance between the atoms' van der Waals surfaces is <3 Å. (C) Ligand orientations in the three liganded simulations, dTC, ACh, and Ca2+/ACh. The orientation is the angle between the ligand's axis and the pore axis (z axis). The axis of dTC is between the methoxy oxygen on the same aryl ring as the hydroxy group and N1, the more distant of the two nitrogens. The axis of ACh is between the nitrogen and the acetate carbon.
The dTC results display asymmetry somewhat differently. In this simulation, three of the subunits appear to move outward in their lower parts, SA, SB, and SD. Subunits SC and SE do the opposite and move inward at the base. In addition there are motions at the top of the receptor that match those at the bottom. SC and SE also move inward at the top quite dramatically, particularly in the helical region on the left, corresponding to clockwise rotation. SD and, to a lesser extent, SA do the opposite at the top and move outward, corresponding to a counterclockwise rotation. All of these motions are accompanied by similar motions to a small degree at the region of contact on the adjacent subunit. At the base of the LBD, the Cys-loop displays some varying flexibility at SA and SC. In the binding site, the C-Loop also differs substantially from the apo simulation and moves outward in all cases, as viewed in the chameleon plots and the C189-L118 Cα distances in Fig. 4 A of 13–15 Å for all interfaces. This outward relative motion almost certainly arises due to the presence of the bulky dTC molecule pushing away the C-loop. Another loop behind the binding site on the complementary face, 101–105, moves inward to varying degrees, presumably due to the presence of the bulky ligand as well.
The two agonist cases are quite different. Once again, it is the lower portion that moves but in these two simulations it almost always moves outward, the only exception being SE,which remains stationary in the Ca2+/ACh simulation. More often than not, the outward motion is on the right-hand side of the lower portion, implying a clockwise rotation. The top halves are fairly constant but also display a slight inward preference on the left and outward preference on the right. This direction is consistent with the clockwise motion observed in the EM structures of receptors activated by ACh (Unwin et al., 2002). The C-loop motions display some variability. In the ACh simulation the C189–L118 Cα distances fluctuate over 10–14 Å for SA and SC and 10–18 Å for SB and SD. However, in SE, the C-loop remains stable at 9 Å. This well-packed position is similar to that in the apo form and supports the idea that the C-loop can move inward upon ligand binding. In the Ca2+/ACh simulation, there is also outward motion of the C-loop, but not as much as in the ACh simulation. Loops at SC and SD, and to a lesser extent SB remain fairly stable at 9–13 Å, with greater motion in SA and SE.
Salt bridges
Changes in the salt bridges between the TMD and the LBD have been implicated in the conformational change in the γ-aminobutyric acid (GABA) receptor (Kash et al., 2003). The only salt bridge possible between the LBD of α7 and the M2-M3 linker of the TMD is between K45 on the β1-β2 linker and D265 on the TMD, in which the charges have reversed positions compared to those in the GABA receptor. The stability of this salt bridge may not be tested in a simulation of only the LBD, but a number of other salt bridges form, as illustrated in Fig. 5. K45 also has the choice to form salt bridges with the adjacent residues E44 and D43. The K45-E44 salt bridge only forms rarely, with the K45-D43 salt bridge predominating. The E44-R132 salt bridge described earlier (Henchman et al., 2003) also remains strong in most cases and only breaks in SA and SB in the apo simulation and in SA, SB, and SC in the Ca2+/ACh simulation. Given that the M2-M3 linker of the TMD is nearby, it is unknown how easily this salt bridge would form in the full receptor. The G-loop and the C-terminus are held in place by a series of salt bridges between R204, R205, and R206 on the C-terminus and E172 and D174 on the G-loop. The strongest of these are D174-R206 and D172-R205 in all simulations. Other salt bridges occasionally form between R132 and E172 on the G-loop on SA in the dTC simulation and on SE in the Ca2+/ACh simulation. Overall, the residues involved in salt bridges are quite dynamic and display few distinct trends between the four simulations. Some of these salt bridges may be artifacts that arise in the absence of the TMD or additional Ca2+ ions near E44 and E172 and may be physiologically insignificant.
FIGURE 5.

Representative structure that shows the salt bridges that form between residues at the base of the TMD. The salt bridge pairs shown are D43-K45, E44-R132, D172-R205, and D174-R204. The chosen structure is from the ACh simulation at 15 ns.
Subunit interfaces
Given the different structural changes taking place in neighboring subunits, it would be expected that there might be changes taking place at the subunit interfaces, and changes are indeed observed. Fig. 4 B indicates the number of intersubunit contacts at each interface as a function of time. The interfaces appear to weaken slightly at the start of all simulations, presumably as unfavorable contacts in the homology model are adjusted and water molecules enter the interface. However, over time a number of differences arise in each simulation both in the number of contacts (see Fig. 4 B) and in where the interfaces come apart, shown by the interface densities in Fig. 6. The number of contacts per interface over the last 5 ns averages 1230 for apo, 1100 for dTC, 1270 for ACh, and 950 for Ca2+/ACh. In the apo simulation, most of the interfaces remain fairly tight throughout the simulation, although IAB and IDE undergo some separation, particularly in the lower portion of the interface. Residues that contribute the most to the subunit separation in the lower third are N46 and Q47 on the β1-β2 linker and S126 and Y128 on the Cys-loop, both of the principal subunit, and I168, N170, and E172 on the G-loop of the complementary subunit. The middle and upper parts of the interface remain in contact but still display some variation. At the other extreme is the ACh/Ca2+ simulation. All interfaces weaken, but in two different ways. IBC and IDE separate in the lower region but remain reasonably intact in the middle and upper regions. The other interfaces maintain contact in the lower region but weaken to varying degrees in the middle or upper regions. The other two simulations are more intermediate in nature. Most of the interfaces for dTC are much weaker than for apo. Three of the interfaces, IAB, ICD, and IEA, come apart in the lower third. However, compensation for the loss of contacts in the lower third takes place in the middle and upper regions, particularly for IEA, the tightest interface of all. The two interfaces that keep contacts in the lower third, IBC and IDE, appear to weaken instead in the middle around the binding site and the upper part. The ACh simulation contains two weak interfaces, IAB and IDE, especially so at the base. The other interfaces are quite strong for most of the simulation, particularly IEA for which the C-loop is tightly packed as discussed earlier. Not surprisingly, there is a strong correlation between C-loop contacts and the distance of the loop from the neighboring subunit described by the C189–L118 Cα distance (Fig. 4 A). The C-loop maintains contact mostly through residues E188 and C189 interacting with W54, L118, and D163 on the complementary subunit. However, the correlation between C-loop contacts and overall interface contacts appears to be inconsistent as observed by comparing Fig. 4, A and B.
FIGURE 6.

Interface densities at an isosurface of value 100 accumulated over all four simulations, apo, dTC, ACh, and Ca2+/ACh, from top to bottom. These plots indicate the number and location of contacts (distance between the atoms' van der Waals surfaces is <3 Å) between pairs of atoms on neighboring subunits.
Ligand positions
The presence of the ligands is assumed to be the source of the different structural changes observed in the simulations, so it is also appropriate to examine their motion in the simulation. Fig. 4 C indicates the angle of the ligand's axis relative to the pore axis. Fig. 7 gives a close-up view of the densities of key ligand atoms over the last 5 ns and representative structures of all ligand heavy atoms relative to important residues in the binding site, excluding C189 and C190 which are omitted for clarity. In all liganded simulations, the ligands remain in the binding sites throughout the simulations. The dTC molecules, marked out by their two nitrogens and a methoxy oxygen, are fairly immobile in their individual binding sites but do differ to some degree. The ligand seems to range from a more vertical position at IBC, tipping to the right at ICD and IEA, further over at IDE, and completely horizontal at IAB. In each case, π-π and cation-π interactions are maintained involving different parts of the ligand and binding site, but the ligand also interacts with different residues. This last dTC molecule rolls over in the binding site at around the 10-ns mark, forming quite a strong electrostatic interaction by placing its two quaternary nitrogens near two aspartates, D196 on the principal subunit, SA, and D163 on the complementary subunit, SB. The other four orientations involve all the binding site residues shown in Fig. 7 as well as S149, Y150, and G151. At IBC, dTC reaches up to E192, whereas at ICD, IDE, and IEA it also reaches out to T76 and N110. Of all the dTC molecules, dTC at IDE displays the closest resemblance to the dTC positions found in earlier modeling and mutagenesis studies in the muscle receptor (Willcockson et al., 2002; Wang et al., 2003) and AChBP (Gao et al., 2003).
FIGURE 7.

Shape of the five binding sites before and after each of the four simulations, a closer view of ligand densities, and ligand binding modes representative of the heaviest density position. Residues shown are Y92, W148, Y187, and Y194 on the principal side and W54, Q56, L108, Q116, and L118 on the complementary side, averaged over the last 5 ns. The densities of representative ligand atoms are shown averaged over the last 5 ns. The two nitrogens of dTC are blue and cyan (N1 and N2, in the nomenclature of Gao et al., 2003) and the oxygen is red, the nitrogen and carbonyl carbon of ACh are blue and green, respectively, and the Ca2+ ion is yellow.
The ACh molecules appear much more mobile than the dTC molecules. For the ACh simulation, the dominant angle of ACh in the binding site relative to the axis of the pore is ∼45°, consistent with 42° measured in NMR experiments (Williamson et al., 2001). However, in all of the five binding sites except IEA, ACh inverts orientation about the long axis on multiple occasions in the simulation. The choline nitrogen remains fairly localized in the aromatic pocket, always interacting with three or four of the aromatic rings of the tyrosines and tryptophans, and sometimes it is higher than average as at IBC and sometimes lower as at IDE. Most of the variability in ligand position comes from the acetate position which adopts at least four positions. Only at IEA does the ACh molecule remain largely localized, the same binding site with the inward-moving stable C-loop, and the same position observed for similar ligands in the AChBP crystal structures (Celie et al., 2004) and docking studies (Le Novère et al., 2002). The choline here has interactions with the faces of Y187 and Y194, W148, the hydroxyl of Y92, and the C189-C190 disulfide bond, in agreement with the importance of these residues to agonist binding (Karlin, 2002). The remainder of this ACh has hydrophobic interactions with L108, L118, and Q56. In the Ca2+/ACh simulation, the ACh molecules are much more constrained, particularly at SBC, SCD, and SDE. Only ACh at IAB displays any significant change in the ACh axis. The Ca2+ ion remains strongly bound to two or three of the carboxylate groups of E161, D163, and E188 throughout the simulation. Its position still displays some upward or downward variation relative to the binding site.
Mobility of the side chains in the binding site
As described earlier, the mobility of the C-loop has a strong effect on the shape of the binding pocket. Other side chains shown in Fig. 7 that make up the binding pocket display similar motions to those observed in the previous apo simulation (Henchman et al., 2003). First, the motion of the binding-site side chains largely reflect the local motions of the subunits to which they are attached, as viewed in the chameleon plots (Fig. 3). Second, the binding site is more collapsed without ligand present than it is with ligand bound as quantified well by the C189–L118 Cα distance described earlier. In particular, the side chain of W148 swings into the middle of the binding site in place of the absent ligand. Other residues display flexibility, but it is difficult to pick out any other particularly distinctive motions of binding site residues that vary consistently between the simulations. Side chains Y92, W148, Y187, Y194, C189, and C190 on the principal subunit of the binding site are fairly rigid, particularly with a ligand bound. Their only significant motion is the occasional ring flipping of the tyrosines. However, side chains on the complementary side, Q56, L108, Q116, L118, and particularly W54, appear more mobile and adopt a number of different conformations. This trend appears the same for all simulations.
DISCUSSION
The objective of this research has been to characterize the nature of the active and inactive states and suggest the allosteric pathway within the LBD through which conformational changes spread due to bound ligands. The main result is the difference in symmetry observed in the LBD depending on whether an agonist, an antagonist, or no ligand is bound. The apo and dTC-bound simulations yield a narrower and asymmetric pore, whereas the ACh and Ca2+/ACh simulations produce a wider and symmetric pore. This difference in symmetry is significant as it suggests a natural mechanism by which the channel opens upon agonist binding, assuming that these same motions are transmitted to the TMD helices that gate the ion flow. The asymmetric and more closed structures found for the apo and antagonist simulations would be consistent with maintaining a narrower ion channel that would hinder ion flow. Conversely, the more open structures obtained with agonist bound may bring about a wider ion channel and initiate ion flow, also in accordance with the role of agonists. The fact that the different structures are consistent with the function of each state in addition to similar results from earlier simulations of α7 (Henchman et al., 2003) and AChBP (Gao et al., 2005) adds credence to the fact that these motions are not simply chance occurrences. This result is also consistent with the subunit asymmetry seen in the EM structure of the muscle receptor without ACh and the symmetry seen with ACh (Unwin et al., 2002), although the asymmetry is already built into the muscle receptor owing to the heteromeric subunit composition, α2βγδ. As noted earlier (Henchman et al., 2003), the subunit sequence of the muscle receptor may have evolved to enhance the stability of the resting asymmetric state, giving a more controlled activation transition as well as requiring exactly two ACh molecules. This asymmetry to symmetry activation mechanism contrasts with the reverse possibility, symmetry to asymmetry, as suggested earlier for the GABA receptor (Horenstein et al., 2001). This hypothesis was based on the differing abilities to form disulfide links between the resting and activated states and on the assumption of symmetry in the resting state. However, their data is also consistent with the opposite mechanism described here from asymmetry to symmetry.
This gain of symmetry suggests a more general activation mechanism for this class of multimeric biomolecules. Much of the understanding of allostery in multimeric proteins has been based on the MWC model (Monod et al., 1965), which assumes that the cooperativity between the subunits arises from the maintenance of overall symmetry and is thus an all-or-nothing response. However, the low Hill coefficients seen for the α7 receptor of no greater than 2 (Corringer et al., 1995; Gopalakrishnan et al., 1995) imply that subunit motions exhibit only partial cooperative behavior. Consequently, subunits are able to act more independently, favoring the likelihood of a more asymmetric structure, which is more likely to occur statistically. Only upon the binding of agonist, which may stabilize each subunit interface in one particular configuration and enhance the subunit cooperativity, is the symmetric active structure favored via the MWC model. Locking in only a few adjacent subunits may be necessary to induce the symmetric activated state. Recent simulations of AChBP bound to ACh (Gao et al., 2005) suggest that having only two nonadjacent ACh molecules bound is sufficient to preserve AChBP in the assumed ligand-bound state rather than a full set of five molecules. Studies of the other Cys-loop receptors suggest that only three bound agonists are sufficient to open the channel. These include the GABA (Amin and Weiss, 1996), 5-HT3 (Mott et al., 2001), and glycine (Gentet and Clements, 2002; Beato et al., 2004) receptors. Another very different explanation is that the asymmetry viewed in the apo and dTC simulations is only part of a larger structural transition whereby only some of the subunits have relaxed to a new position. Without further sampling, it is impossible to distinguish between these two possibilities.
The simulations have revealed global differences distinguishing the active and inactive states. Given that simulations also provide detailed atomistic detail, it would be expected that the differences according to bound ligand may allow the allosteric path from the binding site to the TMD to be traced in a fairly straightforward manner. Indeed, many different structural changes are seen in the simulations at a range of levels that may contribute to the symmetry transition. However, attempts to correlate these with the global motions have proved more difficult. One likely reason is the limited sampling of configurations in a 15-ns simulation. The coincidence of two chance motions in different parts of the receptor will not average out in short simulations, leading to incorrect correlations. In this short time, only small ranges of motion take place and the full motions are likely to be extrapolations of these. Even though 15 ns is a small fraction of the 10- to 20-μs time range believed necessary for activation of the receptor (Sine et al., 1990; Maconochie and Steinbach, 1998), if the process is approximately an exponential decay, then the first 15 ns would be expected to be quite significant. Another explanation of the difficulty of observing clear motions is that the molecular scale of the conformational change might actually be very small, given that the ion channel would only have to change by a few angstroms to switch between the inactive and active states. Dissecting out these small motions from thermal noise, already of amplitude a few angstroms, remains a challenge in simulation analysis. Interpreting motions is also complicated by the use of a homology model. Imperfectly placed side chains may not have had enough time to relax to their desired positions. Nevertheless, this problem would cancel out to some extent between the four simulations and some information may still be extracted about how the motions differ between subunits and depend on bound ligands.
Exactly which parts of the LBD are contributing to this difference in symmetry is shown by the chameleon plots, also introduced in this work. The chameleon plot is a powerful method to reveal structural change, particularly for subtle motions that may be difficult to see using other methods. For example, superimposed structures may appear quite crowded, whereas coloring according to atom mobility contains no directional information. Chameleon plots also indicate motion in a subunit relative to the whole LBD because the superposition is done using the whole LBD rather than only the subunit of interest. Viewing a chameleon plot is aided by the molecule-unwrapping technique, which makes the whole LBD visible in one view. The chameleon plots for all four simulations indicate that most of the differences arise in the lower third of the LBD, the part intuitively most expected to communicate conformational change to the TMD below. The motion observed appears to be a minor deformation of the inner and outer β-sheets to varying degrees, partially consistent with the relative motions of the inner sheet to the outer sheet observed in EM structures (Unwin et al., 2002). The direction of subunit rotation also appears fairly consistent with that observed in the EM structures. In the two agonist simulations, there is a trend for all subunits to rotate clockwise, whereas in the apo and dTC simulations it is more mixed with some subunits rotating counterclockwise, the opposite direction to activation, and some clockwise. This mixture of directions could contribute to the asymmetry for these two simulations. Correlated with this motion is the observed weakening of the interfaces between adjacent subunits. This weakening is supported by cysteine labeling studies of certain residues at the interface in this lower region (Lyford et al., 2003). These experiments suggest that N170 is indeed more exposed upon activation, although E172 appears to be less exposed. This obscuring of E172 upon activation may also be due to a stronger interaction between E172 and E44 mediated by a Ca2+ ion, or greater burial by the β1-β2 linker. It is entirely possible, though, that this motion in the lower third of the subunit is an artifact arising from the absence of the TMD and lipid bilayer. This may be checked in a full-membrane simulation, in preparation (R. L. Law, R. H. Henchman, and J. A. McCammon, unpublished). Further, it may contribute to the difficulty of expressing soluble LBDs of α7 (Wells et al., 1998).
A property that does correlate with the openness of the receptor is the tightness of the interfaces. The general trend is that the smaller the subunit radius of gyration, the more points of contact that subunit has with its neighbors, as would be intuitively expected for a more contracted LBD. When the subunit interfaces are weaker, this weakening takes place in the same region where the outward motion takes place, as observed in the chameleon plots, namely the lower third of the LBD. However, a similar pattern of symmetry and a direct relationship between subunit movement and interface weakening is not so straightforward, partly because every subunit is involved in two interfaces and in turn each interface involves two subunits. At some interfaces with quite different radial motions of two adjacent subunits, there is substantial breaking of the interface, such as IDE for apo and ICD for dTC, but this does not always take place. Part of the discrepancy may arise due to side-chain motions, which would also contribute to the tightness of the interface. The observation that the interfaces on average open up more upon ligand binding supports the idea that the ligands wedge apart the subunits. Wedging, though, cannot be the only requirement for opening the channel since the antagonist dTC wedges open the interfaces but fails to open the channel, whereas the potentiator Ca2+ together with ACh opens the interfaces but not solely due to its bulk.
Some loop motions display significant differences according to the bound ligand. Many of these such as the Cys-loop and the G-loop appear random and uncorrelated with other motions. The most distinctive loop motion appears to be that of the C-loop. It may remain stationary or move inward or outward, and sometimes upward. The inward motion takes place for all loops in the apo and SE in the ACh simulations. Outward motions occur more for liganded simulations, particularly dTC, although ACh when together with Ca2+ seems to limit outward motion. In other studies, the crystal structure of AChBP with nicotine (Celie et al., 2004) versus that with HEPES buffer (Brejc et al., 2001) and MD simulations of AChBP (F. Gao, N. Bren, T. P. Burghardt, S. Hansen, R. H. Henchman, P. Taylor, J. A. McCammon, and S. M. Sine, unpublished) indicate that the C-loop moves inward when agonist is bound, locking in the ligand, but moves outward in the apo form. A similar outward motion of the C-loop was observed in an unliganded simulation of the α7 receptor including the TMD (R. L. Law, R. H. Henchman, and J. A. McCammon, unpublished), suggesting that the presence of the TMD may encourage the outward motion of the C-loop. A backbone hydrogen bond between G152 and P193 is also believed to form when the C-loop is inward and break upon outward motion (Grutter et al., 2003). In this work, this hydrogen bond remained largely intact for all four simulations, only breaking for SE in the dTC simulation. Given the possible correlation between the C-loop and the TMD, it may be that the absence of the TMD in α7 may affect the C-loop's position. Sampling times here may not be long enough to observe the inward motion with agonist bound, but it does occur for one binding site, SE, in the apo and ACh simulations. Another hydrogen bond that may possibly stabilize the ACh bound state, as observed in the crystal structures of AChBP with bound nicotine and carbamolycholine (Celie et al., 2004), is between the hydroxyl of Y187 and the ammonium of K144. Again, no clear correlation was found, with the NZ–OH distance most of the time >6 Å for all simulations and subunits. In the apo state, the C-loop appears to be less ordered, being able to move both inward and outward. Ca2+ would also be expected to influence the C-loop structure since it coordinates to the carboxylate group of E188 on the C-loop and those of E161 and D163 on the G-loop of the neighboring subunit. Indeed, comparing the ACh and Ca2+/ACh simulations, the C-loop appears to be more stable in the Ca2+/ACh simulation, presumably held in place by the Ca2+ ion. Ca2+ may exert its potentiating effect by helping to keep the loop closed around the ligand to enhance its effect. Ca2+ may also stabilize the subunit interface in a single position to maintain a symmetric and consequently more open structure. How the C-loop motions correlate with the rest of the LBD is unclear. In many subunits of the liganded simulations, the C-loop and the base of the LBD move outward together, although this is not always the case. This correlation would be consistent with the wedge hypothesis. It has been suggested that the C-loop communicates with the TMD through the β8-β9 sheet which connects to the C-loop (Brejc et al., 2001). The stable C-loops at SE of ACh and SC and SD of the Ca2+/ACh simulations are accompanied by some outward motion at the base of the receptor, although the correlations are weak.
The binding site is the other obvious location where differences might be expected to arise between the simulations (Lester et al., 2004). The formation of an aromatic cage upon agonist binding is believed to be one of the steps in the allostery pathway. In the ACh simulation, ACh appears quite mobile in the binding pocket, but it is less so with Ca2+ bound. ACh in the IEA binding site where the C-loop moves in appears to be the most stable ACh molecule, implying that this may be the preferred binding mode for ACh. This binding mode does involve the stabilization of an aromatic cage with cation-π interactions with the aromatic W149, Y187, and Y194. ACh is much more restrained with Ca2+ bound. Three ACh molecules at IBC, ICD, and IDE resemble the stable binding mode of ACh in IEA in the ACh simulation, both in binding mode and stability. In these cases, an additional interaction takes place with W54, suggesting that the presence of Ca2+ may facilitate the interaction of W54 with the bound ligand by stabilizing the subunit interface. Although the dTC molecules are more constrained than ACh, they display an interesting trend between the different subunits, ranging from a rather vertical orientation at IBC to a horizontal orientation at IAB. The binding of the bulky dTC molecule may have quite a strong influence on the packing at the subunit interface and the diversity of binding modes may correspondingly contribute to the asymmetric packing of the subunits.
CONCLUSION
Molecular dynamics simulations of the LBD of the α7 nicotinic receptor in the apo form and with antagonist dTC, agonist ACh, and agonist ACh with potentiator Ca2+ have been found to induce different structures whose differences plausibly correspond to their physiological states. A more open, looser packed, symmetric positioning of the subunits characterizes the agonist case and is even more open with potentiator, whereas a more closed and asymmetric LBD results for the apo and dTC cases but with the subunits packed more tightly for apo and more loosely for dTC. This transition from a closed, asymmetric shape to a more open, symmetric one, if it is similarly communicated to the TMD, may be the general theme of the mechanism to allow ion conduction. The precise details of how ligand binding induces these movements still remains to be worked out. However, the simulation has shown a number of motions that are likely to be important in this process. These include the binding modes of the ligands, the formation of the aromatic cage around the agonist, inward and outward motion of the C-loop, motion of the inner and outer sheets in the lower portion of the receptor, some clockwise and counterclockwise rotation of the subunits, as well as salt bridge patterns and separation of the subunit interfaces, also in this lower portion. Combining what is known about the opening mechanism with the observations in these simulations, it is likely that ACh binds in a mode similar to that of the agonists in the recent AChBP liganded crystal structures (Celie et al., 2004), induces the formation of the aromatic cage, and draws in the C-loop, which then makes the lower portion of the receptor translate outward together with some clockwise rotation. The connection between these last motions may take place by weakening the subunit interfaces, as observed here, or through a direct intrasubunit motion along the β8-β9 strand as has been previously proposed (Brejc et al., 2001) but remains unproven by this work. The role of Ca2+ appears to be to stabilize the C-loop and consequently the position of ACh, enhancing the effect of ACh and expanding the LBD further. dTC forces out the C-loop as would be expected. This alone may be sufficient to close the channel by a reverse mechanism to activation, although multiple binding modes of this large molecule may also induce asymmetry in the subunits that keeps the channel closed.
SUPPLEMENTARY MATERIAL
An online supplement to this article can be found by visiting BJ Online at http://www.biophysj.org.
Acknowledgments
We thank David Zhang for assistance with the dTC docking, and Stewart Adcock and Richard Law for helpful discussions.
This work has been supported by grants from the National Science Foundation, National Institutes of Health, the San Diego Supercomputer Center, National Biomedical Computing Resource, NSF Center for Theoretical Biophysics, Accelrys Inc., the W. M. Keck Foundation, and NIH grant NS31744 to S.M.S.
References
- Absalom, N. L., T. M. Lewis, and P. R. Schofield. 2004. Mechanisms of channel gating of the ligand-gated ion channel superfamily inferred from protein structure. Exp. Physiol. 89:145–153. [DOI] [PubMed] [Google Scholar]
- Amin, J., and D. S. Weiss. 1996. Insights into the activation mechanism of ρ1 GABA receptors obtained by coexpression of wild type and activation-impaired subunits. Proc. Roy. Soc. Lond. B. 263:272–282. [DOI] [PubMed] [Google Scholar]
- Bayly, C. I., P. Cieplak, W. D. Cornell, and P. A. Kollman. 1993. A well-behaved electrostatic potential based method using charge restraints for deriving atomic charges - the RESP model. J. Phys. Chem. 97:10269–10280. [Google Scholar]
- Beato, M., P. J. Groot-Kormelink, D. Colquhoun, and L. G. Sivilotti. 2004. The activation mechanism of α1 homomeric glycine receptors. J. Neurosci. 24:895–906. [DOI] [PMC free article] [PubMed] [Google Scholar]
- Brejc, K., W. J. van Dijk, R. V. Klaassen, M. Schuurmans, J. van der Oost, A. B. Smit, and T. K. Sixma. 2001. Crystal structure of an ACh-binding protein reveals the ligand-binding domain of nicotinic receptors. Nature. 411:269–276. [DOI] [PubMed] [Google Scholar]
- Celie, P. H. N., S. E. van Rossum-Fikkert, W. J. van Dijk, K. Brejc, A. B. Smit, and T. K. Sixma. 2004. Nicotine and carbamylcholine binding to nicotinic acetylcholine receptors as studied in AChBP crystal structures. Neuron. 41:907–914. [DOI] [PubMed] [Google Scholar]
- Chakrapani, S., T. D. Bailey, and A. Auerbach. 2004. Gating dynamics of the acetylcholine receptor extracellular domain. J. Gen. Physiol. 123:341–356. [DOI] [PMC free article] [PubMed] [Google Scholar]
- Chavez-Noriega, L. E., J. H. Crona, M. S. Washburn, A. Urrutia, K. J. Elliott, and E. C. Johnson. 1997. Pharmacological characterization of recombinant human neuronal nicotinic acetylcholine receptors hα2β2, hα2β4, hα3β2, hα3β4, hα4β2, hα4β4 and hα7 expressed in Xenopus oocytes. J. Pharmacol. Exp. Ther. 280:346–356. [PubMed] [Google Scholar]
- Corringer, P. J., J. L. Galzi, J. L. Eiselé, S. Bertrand, J. P. Changeux, and D. Bertrand. 1995. Identification of a new component of the agonist binding-site of the nicotinic α7 homooligomeric receptor. J. Biol. Chem. 270:11749–11752. [DOI] [PubMed] [Google Scholar]
- Corry, B. 2004. Theoretical conformation of the closed and open states of the acetylcholine receptor channel. Biochim. Biophys. Acta. 1663:2–5. [DOI] [PubMed] [Google Scholar]
- Essmann, U., L. Perera, M. L. Berkowitz, T. Darden, H. Lee, and L. G. Pedersen. 1995. A smooth particle mesh Ewald method. J. Chem. Phys. 103:8577–8593. [Google Scholar]
- Fairclough, R. H., M. A. Agius, E. Gudipati, L. Silvian, B. Hamaoka, C. C. Beltzner, M. Y. Lin, A. R. Chuang, and D. P. Richman. 2003. Agonist-induced transitions of the acetylcholine receptor. Ann. N. Y. Acad. Sci. 998:101–113. [DOI] [PubMed] [Google Scholar]
- Frisch, M. J., G. W. Trucks, H. B. Schlegel, G. E. Scuseria, M. A. Robb, J. R. Cheeseman, V. G. Zakrzewski, J. A. Montgomery, Jr., R. E. Stratmann, J. C. Burant, S. Dapprich, J. M. Millam, A. D. Daniels, K. N. Kudin, M. C. Strain, O. Farkas, J. Tomasi, V. Barone, M. Cossi, R. Cammi, B. Mennucci, C. Pomelli, C. Adamo, S. Clifford, J. Ochterski, G. A. Petersson, P. Y. Ayala, Q. Cui, K. Morokuma, D. K. Malick, A. D. Rabuck, K. Raghavachari, J. B. Foresman, J. Cioslowski, J. V. Ortiz, A. G. Baboul, B. B. Stefanov, G. Liu, A. Liashenko, P. Piskorz, I. Komaromi, R. Gomperts, R. L. Martin, D. J. Fox, T. Keith, M. A. Al-Laham, C. Y. Peng, A. Nanayakkara, C. Gonzalez, M. Challacombe, P. M. W. Gill, B. Johnson, W. Chen, M. W. Wong, J. L. Andres, C. Gonzalez, M. Head-Gordon, E. S. Replogle, and J. A. Pople. 1998. GAUSSIAN 98, Revision A.7 Ed. Gaussian, Pittsburgh, PA.
- Galzi, J. L., S. Bertrand, P. J. Corringer, J. P. Changeux, and D. Bertrand. 1996. Identification of calcium binding sites that regulate potentiation of a neuronal nicotinic acetylcholine receptor. EMBO J. 15:5824–5832. [PMC free article] [PubMed] [Google Scholar]
- Gao, F., N. Bren, T. P. Burghardt, S. Hansen, R. H. Henchman, P. Taylor, J. A. McCammon, and S. M. Sine. 2005. Agonist-mediated conformational changes in acetylcholine-binding protein revealed by simulation and intrinsic tryptophan fluorescence. J. Biol. Chem. 280:8443–8451. [DOI] [PubMed] [Google Scholar]
- Gao, F., N. Bren, A. Little, H. L. Wang, S. B. Hansen, T. T. Talley, P. Taylor, and S. M. Sine. 2003. Curariform antagonists bind in different orientations to acetylcholine-binding protein. J. Biol. Chem. 278:23020–23026. [DOI] [PMC free article] [PubMed] [Google Scholar]
- Gentet, L. J., and J. D. Clements. 2002. Binding site stoichiometry and the effects of phosphorylation on human α1 homomeric glycine receptors. J. Physiol. (Lond.). 544:97–106. [DOI] [PMC free article] [PubMed] [Google Scholar]
- Goodford, P. J. 1985. A computational procedure for determining energetically favorable binding sites on biologically important macromolecules. J. Med. Chem. 28:849–857. [DOI] [PubMed] [Google Scholar]
- Gopalakrishnan, M., B. Buisson, E. Touma, T. Giordano, J. E. Campbell, I. C. Hu, D. Donnely-Roberts, S. P. Arneric, D. Bertrand, and J. P. Sullivan. 1995. Stable expression and pharmacological properties of the human α7 nicotinic acetylcholine-receptor. Eur. J. Pharmacol. 290:237–246. [DOI] [PubMed] [Google Scholar]
- Grosman, C., M. Zhou, and A. Auerbach. 2000. Mapping the conformational wave of acetylcholine receptor channel gating. Nature. 403:773–776. [DOI] [PubMed] [Google Scholar]
- Grutter, T., and J. P. Changeux. 2001. Nicotinic receptors in wonderland. Trends Biochem. Sci. 26:459–463. [DOI] [PubMed] [Google Scholar]
- Grutter, T., L. P. de Carvalho, N. Le Novère, P. J. Corringer, S. Edelstein, and J. P. Changeux. 2003. An H-bond between two residues from different loops of the acetylcholine binding site contributes to the activation mechanism of nicotinic receptors. EMBO J. 22:1990–2003. [DOI] [PMC free article] [PubMed] [Google Scholar]
- Henchman, R. H., H. Wang, S. Sine, P. Taylor, and J. A. McCammon. 2003. Asymmetric structural motions of the homomeric α7 nicotinic receptor ligand binding domain revealed by molecular dynamics simulation. Biophys. J. 85:3007–3018. [DOI] [PMC free article] [PubMed] [Google Scholar]
- Horenstein, J., D. A. Wagner, C. Czajkowski, and M. H. Akabas. 2001. Protein mobility and GABA-induced conformational changes in GABA(a) receptor pore-lining m2 segment. Nat. Neurosci. 4:477–485. [DOI] [PubMed] [Google Scholar]
- Humphrey, W., A. Dalke, and K. Schulten. 1996. VMD: visual molecular dynamics. J. Mol. Graph. 14:33–38. [DOI] [PubMed] [Google Scholar]
- Itier, V., and D. Bertrand. 2001. Neuronal nicotinic receptors: from protein structure to function. FEBS Lett. 504:118–125. [DOI] [PubMed] [Google Scholar]
- Jorgensen, W. L., J. Chandrasekhar, J. D. Madura, R. W. Impey, and M. L. Klein. 1983. Comparison of simple potential functions for simulating liquid water. J. Chem. Phys. 79:926–935. [Google Scholar]
- Kale, L., R. Skeel, M. Bhandarkar, R. Brunner, A. Gursoy, N. Krawetz, J. Phillips, A. Shinozaki, K. Varadarajan, and K. Schulten. 1999. NAMD2: greater scalability for parallel molecular dynamics. J. Comput. Phys. 151:283–312. [Google Scholar]
- Karlin, A. 2002. Emerging structure of the nicotinic acetylcholine receptors. Nat. Rev. Neurosci. 3:102–114. [DOI] [PubMed] [Google Scholar]
- Kash, T. L., A. Jenkins, J. C. Kelley, J. R. Trudell, and N. L. Harrison. 2003. Coupling of agonist binding to channel gating in the GABAA receptor. Nature. 421:272–275. [DOI] [PubMed] [Google Scholar]
- Le Novère, N., T. Grutter, and J. P. Changeux. 2002. Models of the extracellular domain of the nicotinic receptors and of agonist- and Ca2+-binding sites. Proc. Natl. Acad. Sci. USA. 99:3210–3215. [DOI] [PMC free article] [PubMed] [Google Scholar]
- Lester, H. A., M. I. Dibas, D. S. Dahan, J. F. Leite, and D. A. Dougherty. 2004. Cys-loop receptors: new twists and turns. Trends Neurosci. 27:329–336. [DOI] [PubMed] [Google Scholar]
- Lyford, L. K., A. D. Sproul, D. Eddins, J. T. McLaughlin, and R. L. Rosenberg. 2003. Agonist-induced conformational changes in the extracellular domain of alpha 7 nicotinic acetylcholine receptors. Mol. Pharmacol. 64:650–658. [DOI] [PubMed] [Google Scholar]
- Maconochie, D. J., and J. H. Steinbach. 1998. The channel opening rate of adult- and fetal-type mouse muscle nicotinic receptors activated by acetylcholine. J. Physiol. 506:53–72. [DOI] [PMC free article] [PubMed] [Google Scholar]
- Merritt, E. A., and D. J. Bacon. 1997. Raster3D: photorealistic molecular graphics. Methods Enzymol. 277:505–524. [DOI] [PubMed] [Google Scholar]
- Miyazawa, A., Y. Fujiyoshi, and N. Unwin. 2003. Structure and gating mechanism of the acetylcholine receptor pore. Nature. 423:949–955. [DOI] [PubMed] [Google Scholar]
- Monod, J., J. Wyman, and J. P. Changeux. 1965. On the nature of allosteric transitions: a plausible model. J. Mol. Biol. 12:88–118. [DOI] [PubMed] [Google Scholar]
- Morris, G. M., D. S. Goodsell, R. S. Halliday, R. Huey, W. E. Hart, R. K. Belew, and A. J. Olson. 1998. Automated docking using a Lamarckian genetic algorithm and an empirical binding free energy function. J. Comput. Chem. 19:1639–1662. [Google Scholar]
- Mott, D. D., K. Erreger, T. G. Banke, and S. F. Traynelis. 2001. Open probability of homomeric murine 5-HT3A serotonin receptors depends on subunit occupancy. J. Physiol. (Lond.). 535:427–443. [DOI] [PMC free article] [PubMed] [Google Scholar]
- Ryckaert, J.-P., G. Ciccotti, and H. J. C. Berendsen. 1977. Numerical integration of the cartesian equations of motion of a system with constraints: molecular dynamics of n-alkanes. J. Comput. Phys. 23:327–341. [Google Scholar]
- Šali, A., and T. L. Blundell. 1993. Comparative protein modeling by satisfaction of spatial restraints. J. Mol. Biol. 234:779–815. [DOI] [PubMed] [Google Scholar]
- Sine, S. M. 2002. The nicotinic receptor ligand binding domain. J. Neurobiol. 53:431–446. [DOI] [PubMed] [Google Scholar]
- Sine, S. M., T. Claudio, and F. J. Sigworth. 1990. Activation of torpedo acetylcholine receptors expressed in mouse fibroblasts: single channel current kinetics reveal distinct agonist binding affinities. J. Gen. Physiol. 96:395–437. [DOI] [PMC free article] [PubMed] [Google Scholar]
- Sine, S. M., H. L. Wang, and N. Bren. 2002. Lysine scanning mutagenesis delineates structural model of the nicotinic receptor ligand binding domain. J. Biol. Chem. 277:29210–29223. [DOI] [PubMed] [Google Scholar]
- Sixma, T. K., and A. B. Smit. 2003. Acetylcholine binding protein (AChBP): a secreted glial protein that provides a high-resolution model for the extracellular domain of pentameric ligand-gated ion channels. Annu. Rev. Biophys. Biomol. Struct. 32:311–334. [DOI] [PubMed] [Google Scholar]
- Tuckerman, M., B. J. Berne, and G. J. Martyna. 1992. Reversible multiple time scale molecular-dynamics. J. Chem. Phys. 97:1990–2001. [Google Scholar]
- Unwin, N. 1995. Acetylcholine-receptor channel imaged in the open state. Nature. 373:37–43. [DOI] [PubMed] [Google Scholar]
- Unwin, N. 2003. Structure and action of the nicotinic acetylcholine receptor explored by electron microscopy. FEBS Lett. 555:91–95. [DOI] [PubMed] [Google Scholar]
- Unwin, N., A. Miyazawa, J. Li, and Y. Fujiyoshi. 2002. Activation of the nicotinic acetylcholine receptor involves a switch in conformation of the α subunits. J. Mol. Biol. 319:1165–1176. [DOI] [PubMed] [Google Scholar]
- Vriend, G. 1990. WHAT IF: A molecular modeling and drug design program. J. Mol. Graph. 8:52–56. [DOI] [PubMed] [Google Scholar]
- Wang, H. L., F. Gao, N. Bren, and S. M. Sine. 2003. Curariform antagonists bind in different orientations to the nicotinic receptor ligand binding domain. J. Biol. Chem. 278:32284–32291. [DOI] [PubMed] [Google Scholar]
- Wang, J. M., P. Cieplak, and P. A. Kollman. 2000. How well does a restrained electrostatic potential (RESP) model perform in calculating conformational energies of organic and biological molecules? J. Comput. Chem. 21:1049–1074. [Google Scholar]
- Wang, J. M., R. M. Wolf, J. W. Caldwell, P. A. Kollman, and D. A. Case. 2004. Development and testing of a general AMBER force field. J. Comput. Chem. 25:1157–1174. [DOI] [PubMed] [Google Scholar]
- Wells, G. B., R. Anand, F. Wang, and J. Lindstrom. 1998. Water-soluble nicotinic acetylcholine receptor formed by α7 subunit extracellular domains. J. Biol. Chem. 273:964–973. [DOI] [PubMed] [Google Scholar]
- Willcockson, I. U., A. L. Hong, R. P. Whisenant, J. B. Edwards, H. J. Wang, H. K. Sarkar, and S. E. Pedersen. 2002. Orientation of d-tubocurarine in the muscle nicotinic acetylcholine receptor-binding site. J. Biol. Chem. 277:42249–42258. [DOI] [PubMed] [Google Scholar]
- Williamson, P. T. F., J. A. Watts, G. H. Addona, K. W. Miller, and A. Watts. 2001. Dynamics and orientation of N+(CD3)3– bromoacetylcholine bound to its binding site on the nicotinic acetylcholine receptor. Proc. Natl. Acad. Sci. USA. 98:2346–2351. [DOI] [PMC free article] [PubMed] [Google Scholar]