Abstract
The influence of attractive protein-protein interactions on the organization of photosynthetic proteins within the thylakoid membrane was investigated. Protein-protein interactions were simulated using Monte Carlo techniques and the influence of different interaction energies was examined. It was found that weak interactions led to protein clusters whereas strong interactions led to ramified chains. An optimum curve for the relationship between interaction energy and the number of contact sites emerged. With increasing particle densities the effect decreased. In a mixture of interacting and noninteracting particles the distance between the noninteracting particles was increased and there seemed to be much more free space around them. In thylakoids, this could lead to a more homogeneous distribution of the noninteracting but rate-limiting cytochrome bf complexes. Due to the increased free space between cytochrome bf, obstruction of binding sites—occurring unavoidably in a random distribution—may be drastically reduced. Furthermore, protein-protein interactions in thylakoids may lead to a decrease in plastoquinone diffusion.
INTRODUCTION
There are five integral proteins and two mobile redox carriers involved in photosynthetic electron transport. The former are the light-harvesting complexes (LHC) II, photosystem (PS) II, cytochrome (cyt) bf, and PS I with LHC I, whereas the mobile carriers are plastocyanin and plastoquinone (PQ). Due to the high protein density in thylakoids (Murphy, 1986; Kirchhoff et al., 2002; Tremmel et al., 2003) plastoquinone diffusion may be severely restricted, depending on the organization of the integral proteins. However, the exact nature of the protein organization is still not understood. Lavergne and co-workers (1992) assume a random organization. Kirchhoff and co-workers (2000) suggest that the protein distribution is more ordered because of protein-protein interactions.
In an earlier work (Tremmel et al., 2003), we investigated PQ diffusion in thylakoids using a Monte Carlo simulation. Assuming a random protein distribution it was found that a considerable proportion of binding sites for electron transfer is obstructed by proteins. Furthermore, the area occupied by integral proteins is close to the percolation threshold beyond which the obstacles form closed domains within which PQ can diffuse freely but cannot leave—a situation that could be wasteful if PQ has no access to its binding sites. Slight changes in the protein arrangement lead to pronounced changes in diffusion behavior under such conditions. Therefore, factors were investigated that may influence the protein arrangement and, hence, PQ diffusion. It was found that boundary lipids and the mobility of the integral proteins may play an important role in PQ migration. However, the model did not include protein-protein interactions. Therefore, in our current work the model was extended to account for protein-protein interactions, and the impact of such interactions on the arrangement of proteins was investigated. We started our investigations with general considerations related to interacting and noninteracting spheres and extended them to the situation in thylakoids.
Protein-protein interactions and supercomplexes
During the last two decades a number of experiments have shown that multisubunit proteins (e.g., LHC II, PS I, PS II, cyt bf) can associate to produce higher-aggregation forms. These constitute homo- or heterooligomeric assemblies (often referred to as “supercomplexes”). Examples for homooligomers are the trimeric form of LHC II ((LHC II)3) (Janson, 1994; Kühlbrandt and Wang, 1991) and the cyt bf dimer (Hope, 1993; Huang et al., 1994; Cramer et al., 1996). Heterooligomers exist for the majority of PS II (PS IIα, (PS IIα-LHC II)2) (Hankammer et al., 1997) and PS I (PS I-(LHC I)8) (Janson, 1994; Boekema et al., 1994). Although many proteins tend to form oligomers, others do not: PS IIβ and the ATPase do not form higher aggregation states.
Recent evidence supports the existence of an even higher level of protein assemblage, located mainly in the grana region. First, heptameric LHC II-trimers (Dekker et al., 1999) as well as complexes formed by (LHC II)3 and (PS IIα-(LHC II)3)2 supercomplexes (Boekema et al., 1999, 2000; Yakushevska et al., 2001) have been isolated by fast solubilization of grana stacks, followed by single-particle analysis using electron microscopy. The authors conclude that these aggregates also exist in the native membrane. Second, the analysis of light-induced changes in circular dichroism of thylakoids indicates the existence of a long-range chiral order. These signals are interpreted as indicating a macrodomain structure in grana stacks (Istokovics et al., 1997; Garab and Mustárdy, 1999).
The segregation and aggregation of protein assemblies is of functional significance. Phosphorylation of the LHC II proteins results in a segregation from PS II and lateral migration of the complexes, which is regarded as an essential mechanism for the regulation of the energy distribution between the two photosystems in plants (Allen et al., 1981, 1992a,b). The modification of LHC II by the negatively charged phosphate group is likely to decrease protein-protein interactions. On the other hand, the most likely explanation for the well-established phenomenon of energy transfer between PS IIα units (cooperativity) (Krause and Weis, 1991) is that several PS IIα centers share a common antenna bed mediated by LHC II complexes. To facilitate energy transfer, close contact between several of these complexes must occur. Furthermore, using a functional analysis of electron transport reactions, a microdomain hypothesis was developed by Joliot, Lavergne, and co-workers (Joliot et al., 1992; Lavergne et al., 1992) and extended by others (Blackwell et al., 1994; Kirchhoff et al., 2000). According to the extended microdomain hypothesis, (PS IIα-(LHC II)3)2 and (LHC II)3 build up a networklike arrangement, within which plastoquinone molecules are temporarily trapped. The participation of cyt bf complexes in these networks is unclear. In contrast to supercomplexes, it is expected that microdomains are less stable structures with a finite lifetime (Kirchhoff et al., 2000; Joliot and Joliot, 1992).
In this theoretical study the role of protein-protein interactions in the organization of proteins in a membrane is investigated, starting with interacting spheres corresponding to the size of LHC II trimers. Different energies for the interactions are considered. The arrangement of the particles is then examined by a nearest-neighbor analysis and pair-correlation analysis. Investigations are carried out for different particle densities to get a basic understanding of the influence of protein-protein interactions on pattern formation. In the second part, the influence of noninteracting (“disturbing”) spheres on the organization of the particles is investigated. This part relates to the cytochrome bf complexes in the thylakoids, for which there are no reports about interactions with other proteins. Finally, proteins with shapes corresponding to photosynthetic proteins are considered. LHC II particles are assumed to interact with each other, cyt bf is considered to be noninteracting, and PS II is assumed to contain integral, tightly bound LHC II complexes that interact in the same manner as free LHC II.
SIMULATION
The Monte Carlo calculations were carried out for a square lattice. Initially, particles were distributed randomly (corresponding to E = 0 kT) on the lattice at the required concentrations as described in Tremmel et al. (2003).
Periodic boundary conditions were assumed, i.e., the actual shape of the lattice corresponded to a torus. Consequently, a particle that was positioned at one edge of the lattice was continued at the opposite side. A 1-nm lattice spacing was chosen. This corresponds to the typical size of lipids.
LHC II
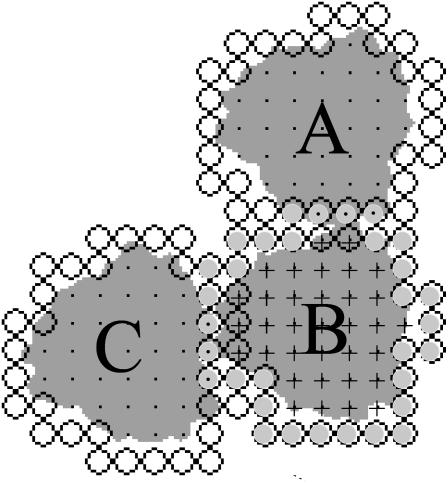
The number of attributes of the LHC II was extended beyond those discussed in the model presented in Tremmel et al. (2003) by an additional layer of grid points surrounding them. These grid points reflected the binding sites. If another LHC II came to lie on these grid points (from here on referred to as binding sites), each occupied point was counted as a bound site (see Fig. 1). The number of bound sites times the interaction energy was considered to constitute the binding energy of the particle.
FIGURE 1.
Binding sites on LHC II. Binding sites are shown as open circles. Those binding sites belonging to LHC II (B) are shaded in light gray. Lattice points occupied by LHC II labeled with A and C are shown as black dots; those occupied by the LHC II labeled with B are shown as crosses. Two of the binding sites of LHC II labeled with A (open circles) come to lie on lattice points occupied by LHC II (B) (discernible as black crosses in open circles (lattice sites)). Therefore LHC II (A) is considered to have two bound sites. LHC II (B) has three binding sites bound to LHC II (A) and three bound to LHC II (C) (light gray circles with black dots), which adds up to six bound sites. Finally, LHC II (C) has three bound sites (crosses in open circles). It should be noted that the gray shapes of the LHC II are only for visualization.
For simplicity, in the first two sections of this work, we investigated spheres of similar size instead of the asymmetric LHC II. The principles of how to count bound sites shown in Fig. 1 hold equally for spherical geometry.
PS II
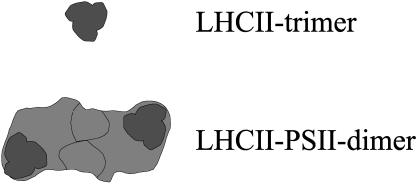
PS II usually forms oligomers consisting of two PS II monomers and two LHC II trimers (see Fig. 2). It was assumed that the LHC II trimers that are tightly bound to PS II interact with free LHC II and other LHC II tightly bound to PS II. Accordingly, those parts of the (PS II-(LHC II)3)2 (from now on referred to as PS II) where the LHC II is bound should interact with other LHC II complexes.
FIGURE 2.
Schematic diagram of an LHC II trimer and a (PS II-LHC II3) dimer. The positions of the tightly bound LHC II trimers are illustrated.
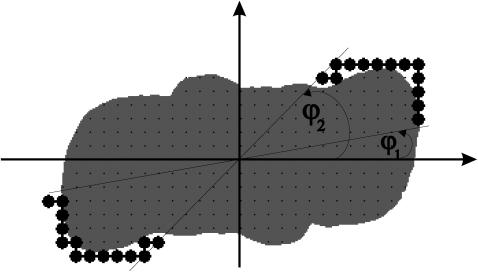
Due to the rotational symmetry of the complexes the position of the binding sites could be defined by two angles relative to the particle (φ1 and φ2, see Fig. 3). Between these angles all nearest and next nearest neighboring lattice sites of a PS II were considered as binding sites.
FIGURE 3.
Binding sites on PS II. Binding sites are shown as solid circles. The angles φ1 and φ2 (here 10° and 45°) determine the position of the binding sites.
Interaction
Short-range, nearest-neighbor attractions between the LHC II complexes were introduced. For simplictiy no long-range attractive force was assumed but rather a Lennard-Jones potential with very short range (minimal potential energy at the distance of the lattice spacing). Correspondingly, only direct contact with the binding site led to a binding event. The above assumption of the nature of protein-protein interactions is of course rather simplistic but it is able to illustrate principal effects of protein-protein interactions.
The binding energy of a particle (e.g., PS II or LHC II) was considered to be the sum of bound sites with which the particle was involved (see Fig. 1) times the assumed energy (E, in units of kT). When two particles collided they stuck together until one particle detached itself. Because of its thermal energy a particle could unbind from its neighbors with the probability e−ΔE/kT. T is the temperature and ΔE is the energy change due to the unbinding. It was assumed that ΔE = nE, where n is the number of bound sites of a particle. At each step a randomly chosen particle was tested for whether it was unbinding. To test for unbinding a random number between zero and 1 was chosen. If e−nE/kT was larger than this random number, the transition was accepted; otherwise, it was rejected. This is similar to the procedure used by Shih and co-workers (1987). Correspondingly, the higher the binding energy (E), the lower the probability for unbinding. When the procedure was repeated as often as there were particles on the grid, this corresponded to one Monte Carlo step.
Movement of a particle
A particle that underwent an unbinding transition was moved to a random nearest-neighbor site on the lattice. If the site was occupied another neighboring site was tried. Particles bound to others were considered to be stationary because of their larger mass. This corresponds to a form of the Multicenter Diffusion Limited Aggregation (standard aggregation models like Multicenter Diffusion Limited Aggregation are summarized in, e.g., Saxton (1992, 1993), with a high concentration of immobile seeds. The assumption of immobility of clusters is a simplification. However, cross-membrane interactions between proteins in adjacent grana discs are expected to restrict the mobility of clusters much more than that of single particles.
For nonspherical particles, e.g., particles with the shape of photosynthetic proteins, the exact calculation of their translation and rotation in a membrane is very difficult, and therefore some simplifications were needed. Accordingly, it was assumed that translation in all dimensions was equally probable. Furthermore, it was assumed that at each time step each particle rotated ∼±10°. That is, forces tangential to the body surface (viscosity of the matrix molecules) and forces normal to the surface (pressure forces caused by momentum transfer between the particles and the matrix molecules) were not addressed directly but were subsumed into the ratio of rotational energy/translational energy. This is somewhat arbitrary, but the exact degree of rotation should not influence the general outcome.
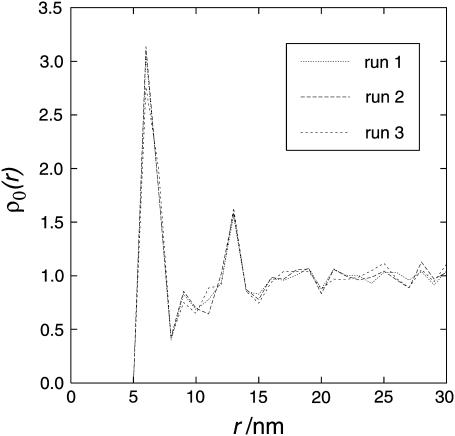
Due to the long computing time required for all conditions only 2–3 different runs were averaged for each condition. However, a large lattice (200 × 200 nm) was used with many particles (at least 303). Therefore the variability of different runs was not very pronounced. To illustrate the variability, the single results of the particle pair correlation function for the conditions showing the most variability are shown in Fig. 4. This illustrates that the variability was reasonably small compared to the effects observed.
FIGURE 4.
Single (nonaveraged) results showing the variability of different runs. The results of the three single runs are plotted. Conditions that show the most variability are shown: 0.5% area occupation, interaction energy E = 1 kT. ρ0 is the relative density of particles at distance r (for a more detailed description of the axes, see Results and Discussion).
RESULTS
Interacting spheres of the size of LHC II
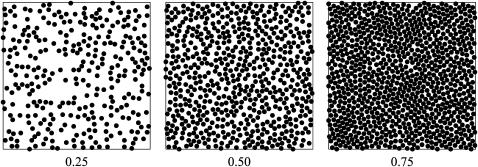
The arrangement of homogeneous interacting spheres was investigated for different particle densities. Fig. 5 shows the distribution of randomly placed spheres (corresponding to E = 0 kT) on a 200 × 200-nm2 lattice with a lattice spacing of 1 nm. The diameter of a sphere is 6.25 nm.
FIGURE 5.
Random distribution (E = 0 kT) of homogeneous spheres on a square lattice. The occupied area fraction is 0.25, 0.50, or 0.75. The diameter of the spheres is 6.25 nm and the lattice size is 200 × 200 nm.
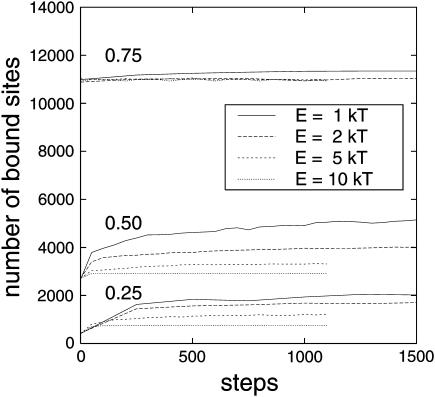
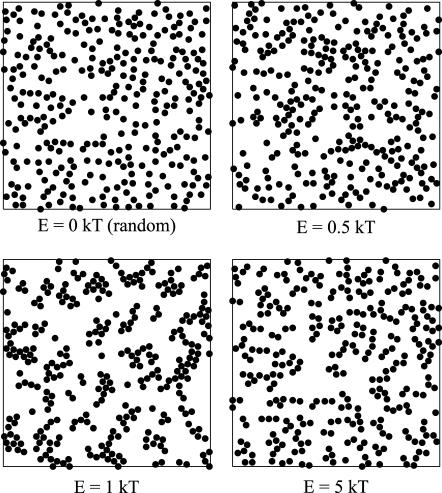
Next, the influence of different interaction energies was examined. When two particles collided, they stuck together until one particle detached. Because of its thermal energy a particle could unbind from its neighbors with the probability e−ΔE/kT. Particles initially placed randomly on a lattice thus rearranged until a steady state was reached where the frequency of binding equaled that of unbinding (i.e., after a number of steps well within the plateau in Fig. 12). This binding and unbinding led to different patterns of arrangements according to the interaction energy, E. In Fig. 6, particle arrangements are shown that result from the same initial distribution but using different interaction energies. From Fig. 6 it can be seen that higher interaction energies led to more elongated patterns whereas lower interaction energies resulted in more clustered patterns. This is in agreement with the results of Shih and co-workers (1987) (see also Saxton, 1992, and references therein).
FIGURE 12.
Kinetics of the number of bound sites. Different interaction energies, E, are considered and also different particle densities.
FIGURE 6.
Steady-state distribution of interacting spheres according to different interaction energies. The area fraction is 0.25 and the binding energies resulting in the arrangements shown are 0 kT (random), 0.5 kT, 1 kT, and 5 kT.
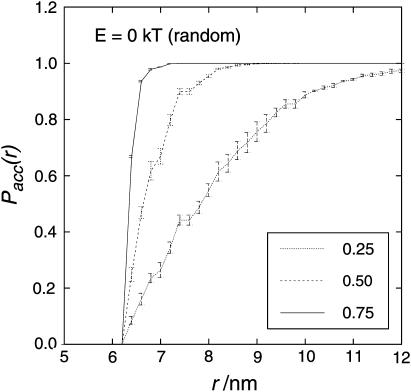
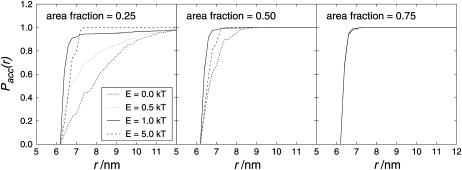
However, the human visual system tends to recognize order in any distribution. Therefore it is not a good referee for deciding whether the particles are ordered in a certain way or more randomly distributed. Objective criteria are required for the analysis of particle distributions. Typical approaches to distribution analysis are the nearest-neighbor distribution analysis (NNDA) and the pair-correlation analysis (PCA) (Kubitscheck and Peters, 1998). The NNDA was computed for a given sample by determining the distance between a particle and its nearest neighbor for each of the particles. From the list of nearest-neighbor distances the mean (accumulated) probability (Pacc(r)) of finding the nearest neighbor within the distance r was calculated and plotted versus r. Aggregated particles (attractive interaction forces) show a relative excess of small nearest-neighbor distances, whereas repelled particles with the same average particle density show a relative deficiency of small nearest-neighbor distances. The NNDA is of course dependent on the particle density. Fig. 7 shows that the higher the particle density the smaller the distance to the nearest neighbor. The diameter of a sphere is 6.25 nm, and particles cannot be closer than that.
FIGURE 7.
Nearest-neighbor distribution analysis for E = 0 kT (randomly distributed particles) with different particle densities. The y axis shows the accumulated probability Pacc(r) of finding the nearest neighbor within the distance r. The higher the occupied area fraction, the higher is the probability of finding a nearest neighbor in close vicinity. Because of the long computing time only two runs are averaged. However, due to the relatively large number of particles, runs differ little from each other. Error bars show the standard deviation.
Fig. 8 shows the influence of attractive forces between the particles. It can be seen that the probability of finding a neighbor in the close vicinity of the particle was increased for interacting particles reflecting more clustered arrangements. Interestingly, 5 kT and 10 kT (not shown) were less efficient than 1 kT in increasing the probability of finding a neighbor in a small distance. The difference between random distribution (E = 0 kT) and arrangements due to interaction became less pronounced for higher particle densities. For an occupied area fraction of 0.75 (see Fig. 8, right), no difference could be seen between a random distribution and the distribution of interacting particles.
FIGURE 8.
Similar to Fig. 7, but here the NNDA is shown for interacting particles with different interaction energies, E, and different particle densities. For clarity, error bars are not shown.
Whereas the NNDA gives information about the distance of a particle from its nearest neighbor, the PCA allows the analysis of the relative densities, ρ0, of particles in the vicinity of one particle. The PCA was computed for a given sample of particles by determining the mean number of particles (n(r)) found in a shell of radii r – dr and r + dr around an average particle. In other words, the resulting function ρ0(r) describes the deviation of the local particle density from the average density. ρ0 was calculated in the following way (similar to the function described in McQuarrie, 1976):
 |
(1) |
where ρ = particle density and dr = 0.5 nm (lattice spacing = 1.0 nm).
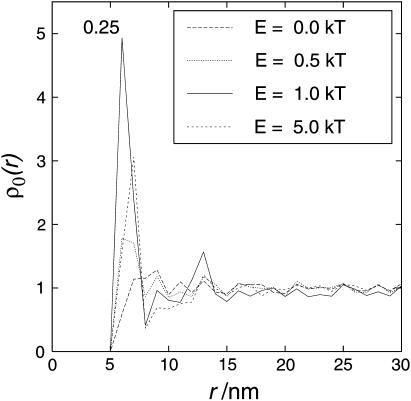
Fig. 9 (see also Fig. 11) shows the PCA for different particle densities and varied interaction energies.
FIGURE 9.
Pair-correlation analysis for 0.25 area occupation. E = 0 kT (random) compared to energies of interaction of E = 0.5 kT, E = 1 kT, and E = 5 kT. The y axis shows the relative particle density ρ0(r). For clarity, error bars are not shown. However, in the region of the main peak (5–8 nm), the error bars of the different curves do not overlap.
FIGURE 11.
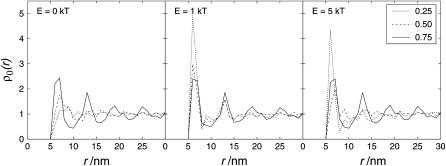
Pair-correlation analysis for different area occupations. E = 0 kT (left, random distribution), 1 kT (middle), and 5 kT (right).
In Fig. 9, it can be seen how interaction energies led to a strong increase in particle density in the close vicinity of a particle. The effect was less pronounced for 5 kT than for 1 kT. Once a particle was bound to another particle the probability of it moving was lower for higher interaction energies than for low interaction energies. Consequently, the probability of being trapped in a local minimum of the potential was higher for higher interaction energies than for lower interaction energies. Therefore, low interaction energies are expected to lead to more clustered arrangements, whereas higher energies are expected to lead to more ramified arrangements (Shih et al., 1987) (local minimum). This effect can also be seen in Fig. 6.
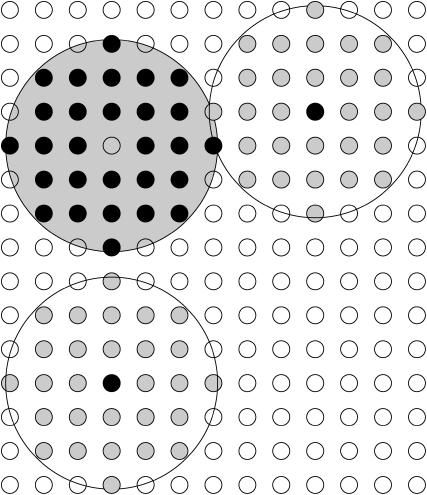
Interestingly, the pronounced maximum at 6 nm for 1 kT was shifted to 7 nm for 5 kT. In Fig. 10, three spheres are shown illustrating two possible smallest distances to the nearest neighbor. In the linear position (upper left sphere to lower sphere) the distance is 7 nm, due to the resolution of the lattice (diameter, 6.25 nm; lattice spacing, 1 nm). In the angular arrangement (upper left sphere to upper right sphere), the minimal distance is 6.08 nm. Thus the shift in the maximum indicates that for higher energies particles were arranged in rather linear chains, whereas for lower energies particles were arranged at oblique angles.
FIGURE 10.
Possible arrangement of nearest neighbors on a square lattice. Filled circles denote occupied lattice sites. The sphere under consideration is gray and lattice sites occupied by it are black. The lattice spacing is 1 nm and the diameter of the spheres is 6.25 nm. The distance in the linear arrangement (upper left sphere to lower sphere) is 7 nm, whereas in the angular arrangement (upper left sphere to upper right sphere) the distance is 6.08 nm.
It has to be noted here that the smaller distance in the case of angular orientation compared to linear orientation led not only to a denser packing but also to a higher number of bound sites. If the particles were linearly arranged, only one binding site was occupied. In contrast, for an angular arrangement the nearest neighbor occupies more than one binding site. Accordingly the algorithm used (together with the grid geometry) led to a preferential orientation of the particles at an angle oblique to the square lattice. The probability of a particle “finding” this more optimal orientation was higher for lower interaction energies than for high interaction energies. Thus, the lattice characteristics used may enhance the effect of low interaction energies compared to the effect of high interaction energies. Nevertheless, the principal behavior is expected to be the same as for continuous areas.
Next, the density dependence of the PCA of randomly distributed particles (E = 0 kT) was investigated. The results are shown in Fig. 11, left. It can be seen that a high density without interaction energy may also have the effect of cluster formation. This reflects the “organizing effect of entropy”: entropy may lead to higher levels of organization (Onsager, 1949; Dinsmore et al., 1996; Chow, 1999). For an area of occupation of 0.75, due to the high particle density, there are more possibilities to arrange the spheres in the lattice when they are ordered. For 0.75 occupied area fraction, oscillation around the mean density occurred. This reflects the tendency of the spheres to be arranged in an ordered way, due to the high particle density. The most compact packing of spheres (hexagonal closest packing) in a continuous area is expected to result in an oscillating PCA. For larger distances, r, the oscillations will become broader and less extreme. This is because more combinations of possibilities occur for a particle to occupy sites oblique to the considered particle, leading to slightly different distances. On the other hand, due to the square characteristics, at least two different positions of a nearest neighbor are possible (6.08 nm and 7 nm, see also Fig. 10). In the continuum, the closest distance to a particle is simply its diameter (here 6.25 nm). Therefore the square nature of the lattice leads to broader peaks at small r. With increasing r, the grid nature of the simulation will have less effect. However, comparing Fig. 9 with Fig. 11 shows that without interaction the peaks are relatively broad, whereas interaction energy leads to clearly distinct maxima.
To illustrate the effect of the particle density, together with the interaction energy, the PCA for different densities and 1 kT interaction energy is shown in Fig. 11, middle, whereas Fig. 11, left, shows the same for 5 kT. For both interaction energies (1 kT and 5 kT, Fig. 11, middle and right), the clustering was most pronounced for an occupied area fraction of 0.25. For 0.75 area fraction there was still clustering but it equals that for noninteracting spheres of the same density.
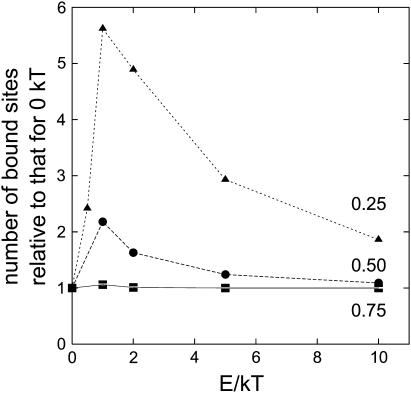
In Fig. 12, the number of bound sites (as described in Fig. 10) is plotted versus the number of Monte Carlo steps. All investigated particle densities are shown (0.25, 0.50, and 0.75). In accordance with the NNDA analysis and the PCA analysis, Fig. 12 shows that for an occupied area fraction of 0.75 the arrangement was rather similar, independent of the interaction energy. For an occupied area fraction of 0.50 and 0.25, Fig. 12 shows that for higher interaction energies (2 kT, 5 kT, and 10 kT) fewer bound sites were formed than for E = 1 kT. In Fig. 13, the number of bound sites in the equilibrium relative to that for E = 0 kT is plotted versus the interaction energy leading to the respective arrangement. In this figure, it can be seen clearly that the importance of interaction decreased with increasing particle density. Further, the introduction of particle interaction with 1 kT resulted in many more binding sites, but further increase of the interaction energy led to a decreased effect.
FIGURE 13.
Number of bound sites relative to that for E = 0 kT (random distribution). Numbers of bound sites are determined after the system has reached steady state.
Interacting and noninteracting spheres corresponding to LHC II and cyt bf
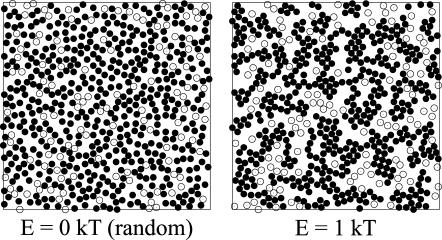
Although there is some evidence that LHC II complexes interact with each other and with (parts of) PS II complexes it is unclear whether cyt bf also interacts with other proteins. Therefore the influence of noninteracting spheres on the arrangement of interacting spheres was investigated. The investigations were carried out for an occupied area fraction of 0.50. The ratio of interacting/noninteracting spheres was chosen to be 4:1. The arrangement of the particles for the random state (E = 0 kT) and E = 1 kT interaction energy is shown in Fig. 14.
FIGURE 14.
Random (E = 0 kT) and steady-state distribution of noninteracting spheres (open circles) and spheres interacting with E = 1 kT (solid circles). The area fraction is 0.50.
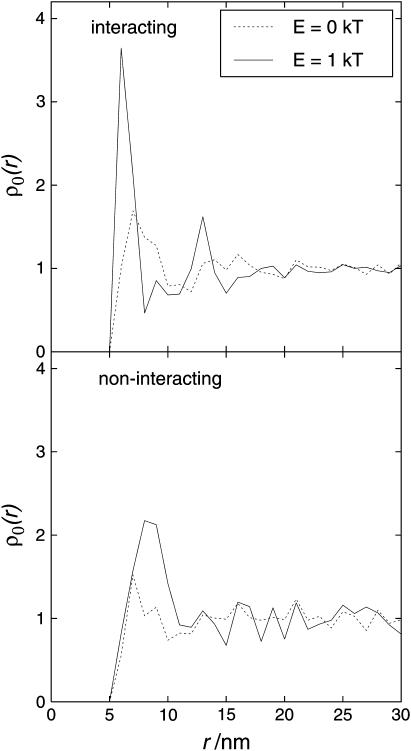
Fig. 15 illustrates the effect of interaction energy on the PCA of both interacting spheres (top) and noninteracting spheres (bottom). For the PCA, only particles of the same sort were taken into account (e.g., interacting spheres were compared with other interacting spheres). Fig. 15 shows that the behavior of interacting spheres in the presence of noninteracting spheres was very similar to that in the absence of noninteracting spheres. The introduction of interaction energies led to a higher density of interacting particles close to other interacting particles (low r). In contrast to that, the introduction of attractive forces between the interacting spheres led to a shift of the peak of the PCA of noninteracting spheres to larger r. This shows that whereas interacting spheres tended to form clusters, the noninteracting spheres tended to be kept apart by the interacting spheres.
FIGURE 15.
Influence of noninteracting spheres on the arrangement of particles in the membrane. The area occupation is 0.50 and 20% of the particles are noninteracting. The PCA for E = 0 kT and the arrangement resulting from 1 kT interaction energy is shown. (Top) Interacting spheres (LHC II). (Bottom) Noninteracting spheres (cyt bf).
The tendency to be kept apart leads to a more homogeneous distribution of the noninteracting particles, or cyt bf . This, together with the increased free space for cyt bf, may be of importance, since cyt bf, which is probably noninteracting, is considered to be the rate-limiting step in the electron transport chain. A more homogeneous distribution, in addition to increased free space around it, could facilitate access of PQ to the binding sites at cyt bf.
As discussed above, for lower interaction energies the interacting particles formed denser clusters. More compact clustering of the interacting spheres in turn led to more free space for the noninteracting spheres. This may explain why the noninteracting particles showed less tendency to be close together and the PCA was shifted toward higher r. The effects of interacting forces were less pronounced for higher interaction energies.
Influence of protein-protein interactions on plastoquinone diffusion
In this section the influence of protein-protein interactions on particles exhibiting the shape of photosynthetic proteins is examined. The outlines of the photosynthetic proteins were taken from Hankammer et al. (1997) for PS II with tightly bound LHC II trimers, Breyton (2000) for cyt bf, and Kühlbrandt and Wang (1991) for LHC II. An occupied area fraction of 0.65 was chosen. This corresponds to the area fraction in thylakoids determined by Kirchhoff and co-workers (2002) and is slightly below the value of 0.70–0.77 for grana thylakoids estimated by Tremmel and co-workers (2003). However, 0.65 was chosen because it is expected to be very close to, but below, the percolation threshold for restricted long-range PQ diffusion if immobile obstacles of the shape of photosynthetic proteins without protein-protein interactions are assumed (see also Tremmel et al., 2003).
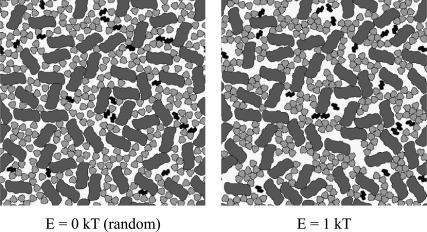
A random (E = 0 kT) arrangement of the particles is shown in Fig. 16 together with the steady-state arrangement resulting from protein-protein interactions with E = 1 kT. Despite the high protein density, significant reorganization of the particles was found. In agreement with the results reported above (see also Fig. 15) the noninteracting cyt bf seemed to have more open space surrounding it when located between interacting particles (Fig. 16, right) compared to a purely random distribution (Fig. 16, left). Particles other than cyt bf (i.e., PS II and LHC II) were lying close together due to their interaction. Consequently, diffusion of PQ was expected to be more hindered in an arrangement of interacting photosynthetic proteins than in a random distribution.
FIGURE 16.
Random (E = 0 kT) and steady-state distribution of photosynthetic proteins (E = 1 kT). Dark gray, PS II dimers; black, cytochrome bf dimers; light gray, free LHC II trimers. The stoichiometry of the complexes is PS II/cyt bf/LHC II is 2.6:1:14.1 and the occupied area fraction is 0.65.
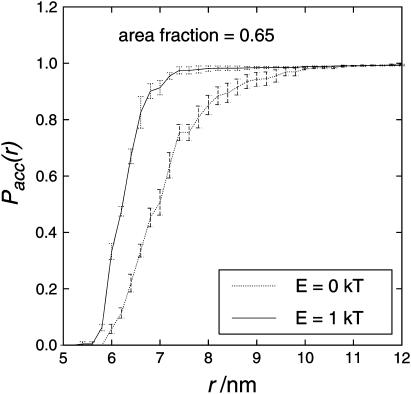
NNDA was carried out for closer examination of the arrangement of the particles. For the analysis, only particles of the same sort were taken into account, i.e., for LHC II only other LHC II complexes were considered. The same holds for cyt bf and PS II. NNDA revealed that, similar to interacting spheres, the accumulated probability (Pacc(r)) for an LHC II to have another LHC II in its vicinity was shifted toward lower distances, r, by protein-protein interactions (see Fig. 17). For cytochrome bf and PS II no difference in Pacc(r) was found (data not shown).
FIGURE 17.
Nearest-neighbor distribution analysis for LHC II in an arrangement of particles with the shape of photosynthetic proteins. E = 0 kT and E = 5 kT. The occupied area fraction is 0.65. Due to the long calculation time, only three runs were averaged but PQ mobility was decreased to a significant extent in all single runs.
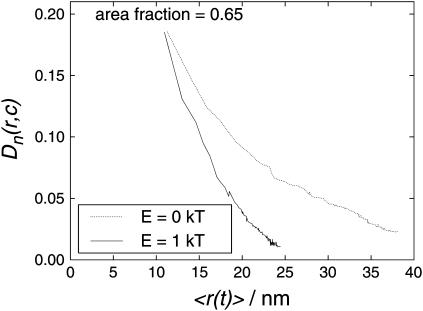
However, the area occupation chosen is close to the percolation threshold for PQ diffusion, and so PQ diffusion in the steady-state arrangement (shown in Fig. 16, right) was investigated for differences from diffusion in randomly distributed proteins (Fig. 16, left). In addition to the importance of PQ diffusion within thylakoids, the lateral diffusion of an inert tracer obstructed by the clusters is a sensitive probe of the aggregation (Saxton, 1992). The results are shown in Fig. 18. It can be seen that the distance-dependent diffusion coefficient of PQ was significantly lower when interactions were introduced. For a distance of 15 nm (the mean distance between PS II and the nearest cyt bf in a random distribution (Tremmel et al., 2003)) the normalized diffusion coefficient in a random distribution (0 kT) is 0.135, whereas the diffusion coefficient between interacting proteins (1 kT) is 0.105, i.e., ∼¼ lower. As a consequence, PQ needs a much longer time to bridge a certain distance.
FIGURE 18.
Diffusion coefficient of PQ diffusing between randomly distributed (E = 0 kT) photosynthetic proteins and between photosynthetic proteins arranged as a result of protein-protein interactions (E = 1 kT). The occupied area fraction is 0.65. The curves show averaged data from the same runs as those used in Fig. 17.
Due to their high protein density, thylakoids seem to operate close to the percolation threshold above which accessibility of proteins by PQ is severely restricted. The decrease of the PQ diffusion coefficient shown here indicates that protein-protein interactions may shift the system from close to the percolation threshold to restricted PQ diffusion and, consequently, restricted electron transport.
DISCUSSION
The effect on their organization of interaction energies between particles is of interest in the context of thylakoid architecture, which in turn may have a pronounced influence on photosynthesis. As an example, the arrangement of LHC II in the thylakoid membrane is of importance in understanding efficient energy transfer between LHC II complexes. Furthermore, Kirchhoff and co-workers (2000) suggest that protein-protein interactions may lead to the formation of diffusion domains for plastoquinone, preventing rapid redox equilibration across the membrane between PQ and cyt b.
Therefore, in our work the arrangement of interacting particles on a square lattice was studied with the help of a Monte Carlo simulation assuming a simple hypothetical interaction potential. The NNDA and the PCA were examined. First, the effects of different interaction energies and particle densities on the arrangement of interacting spheres are discussed. Second, the influence of noninteracting particles disturbing the organization of interacting particles is considered. Finally, we examined how LHC II-LHC II, (PS II-(LHC II)3)2-LHC II, and (PS II-(LHC II)3)2-(PS II-(LHC II)3)2 interactions may influence plastoquinone diffusion and thus electron transport.
The results show that the arrangement of interacting particles was dependent on the interaction energy (see Figs. 6, 8–9, 12, and 13). Lower interaction energies (1 kT and 2 kT) led to a more clustered particle distribution, whereas higher energies (5 kT and 10 kT) result in ramified chains. This is in accordance with the results of Shih and co-workers (1987).
However, the arrangement of the particles was not only dependent on the interaction energy but also on the particle density (see Figs. 5, 7, and 11). The ordering effect of high particle densities was very similar to that of interaction energies. Both led to a steeper increase in the NNDA and higher PCA at low r, i.e., generally a higher probability for one particle to be close to another. The higher the particle density, the lower was the effect of interaction.
For occupied-area fractions of 0.75 the arrangement of the spheres was independent of the interaction energy. This is interesting, because in thylakoids the area occupied by proteins is ∼0.7. Therefore, interaction energies have presumably only a minor impact on the thylakoid architecture. However, using only homogeneous interacting spheres with binding sites all around the surface is a very crude simplifying assumption for the modeling of thylakoids, and further refinement is needed. Nevertheless, interacting spheres used in the simulation resemble LHC II, which is rather cylindrical and of similar size to the spheres used in the simulation (compare Kühlbrandt and Wang, 1991). Consequently these simulations are suited to describing, e.g., LHC II reconstituted in liposomes or BBY preparations.
In thylakoids not all photosynthetic proteins may be appropriately modeled by interacting spheres of the same size. Not all photosynthetic proteins may interact with other proteins. For example, for cytochrome bf nothing is known about interactions with other proteins. Furthermore, the largest complexes, here referred to as PS II, are in fact PS II with tightly bound LHC II (((PS II)-(LHC II)3)2). Therefore, they are expected to interact with free LHC II or other LHC II tightly bound to PS II. However, ((PS II)–(LHC II)3)2 probably does not interact on its whole surface but rather where the LHC II is located. In addition, PS II (((PS II)-(LHC II)3)2) is very large compared to LHC II. Therefore, using the same area fraction, more space may be left for LHC II to take a tortuous path between noninteracting proteins until it binds to an interacting protein.
Therefore, the simulation was refined step by step. First the simulation was extended to account for noninteracting particles. The results are shown in Figs. 14 and 15. The noninteracting spheres were assumed to be of the same size as the interacting spheres. This is because the sizes of LHC II (interacting) and cyt bf (probably noninteracting) are in the same range. It should be noted that the ratio of interacting/noninteracting spheres used in the simulations (i.e., 4:1) does not reflect the stoichiometries of the photosynthetic proteins. The principal effects were investigated and the relatively large proportion of noninteracting spheres was chosen because it was expected to lead to clearer effects. The noninteracting spheres did not alter qualitatively the behavior of interacting spheres. In contrast noninteracting spheres were influenced by interacting spheres. The relative density of noninteracting particles became higher at larger distances from each other (larger r). This shows that whereas interacting spheres tended to form clusters, the noninteracting spheres tended to be kept apart by the interacting spheres. In thylakoids this could lead to a more homogeneous distribution of the noninteracting cyt bf . This may be of importance because cyt bf is involved in the rate-limiting step of photosynthesis, the PQH2 oxidation. In thylakoids densely packed with proteins, PQH2 diffusion may be severely restricted (Blackwell et al., 1994; Lavergne and Joliot, 1991; Joliot et al., 1992; Lavergne et al., 1992; Joliot and Joliot, 1992; Kirchhoff et al., 2000; Tremmel et al., 2003). Therefore, the distribution of cyt bf in the thylakoids may be of importance.
As a second step, the influence of the interaction between LHC II and parts of PS II was examined, taking into account the realistic shapes of the proteins. Despite the high density of proteins in the thylakoids the introduction of protein-protein interactions did exert a strong effect on the arrangement of the proteins. Furthermore, PQ diffusion was influenced by the interactions: compared to the diffusion in randomly arranged proteins, the diffusion coefficient of PQ was significantly decreased when protein-protein interactions were introduced. On the other hand, in the case of interacting LHC II and PS II there seemed to be much more free space around the noninteracting cyt bf complexes. Further, since cyt bf is not likely to interact with other proteins, it is expected to be much more mobile than interacting proteins. Accordingly the probability for a binding site on cyt bf to be obstructed permanently is low. PQH2 oxidation at cyt bf is considered to be the rate-limiting step in electron transport. Taking that into account, interaction energies resulting in a more homogeneous distribution of cyt bf and an increased accessibility of the binding sites may play an important role in electron flux. This holds particularly if PQ diffusion is restricted. On the other hand, protein-protein interactions may indeed increase the retarding effect of the high protein density in thylakoids.
Acknowledgments
The authors thank Dr. Thomas Strauß for countless helpful discussions about the software architecture and for his help with trouble shooting. Many thanks also to Dr. Helmut Kirchhoff for many valuable discussions and to Dr. Ulrich Kubitscheck for helpful comments on the manuscript. We also thank Dr. Michael Saxton for helpful and interesting comments on an early stage of the manuscript.
I. G. Tremmel's present address is Centre of Competence, University of Applied Sciences, Aachen, Ginsterweg 1, D-52428 Jülich, Germany.
References
- Allen, J. F. 1992a. How does protein phosphorylation regulate photosynthesis? Trends Biochem. Sci. 17:12–17. [DOI] [PubMed] [Google Scholar]
- Allen, J. F. 1992b. Protein phosphorylation in regulation of photosynthesis. Biochim. Biophys. Acta. 1098:275–335. [DOI] [PubMed] [Google Scholar]
- Allen, J. F., J. Bennett, K. E. Steinback, and C. J. Arntzen. 1981. Chloroplast protein phosphorylation couples plastoquinone redox state to distribution of excitation energy between photosystems. Nature. 291:25–29. [Google Scholar]
- Blackwell, M. F., C. Gibas, S. Gygax, D. Roman, and B. Wagner. 1994. The plastoquinone diffusion coefficient in chloroplasts and its mechanistic implications. Biochim. Biophys. Acta. 1183:533–543. [Google Scholar]
- Boekema, E. J., A. F. Boonstra, J. P. Dekker, and M. Rögner. 1994. Electron microscopic structural analysis of photosystem I, photosystem II and the cytochrome b6/f complex from green plants and cyanobacteria. J. Bioenerg. Biomembr. 26:17–29. [DOI] [PubMed] [Google Scholar]
- Boekema, E. J., J. F. L. van Breemen, H. van Roon, and J. P. Dekker. 2000. Arrangement of photosystem II supercomplexes in crystalline macrodomains within the thylakoid membrane of green plant chloroplasts. J. Mol. Biol. 301:1123–1133. [DOI] [PubMed] [Google Scholar]
- Boekema, E. J., H. van Roon, F. Calkoen, R. Bassi, and J. P. Dekker. 1999. Multiple types of association of photosystem II and its light–harvesting antenna in partially solubilized photosystem II membranes. Biochemistry. 38:2233–2239. [DOI] [PubMed] [Google Scholar]
- Breyton, C. 2000. Conformational changes in the cytochrome b6f complex induced by inhibitor binding. J. Biol. Chem. 275:13195–13201. [DOI] [PubMed] [Google Scholar]
- Chow, W. S. 1999. Grana formation: entropy-assisted local order in chloroplasts. Aust. J. Plant Physiol. 26:641–647. [Google Scholar]
- Cramer, W. A., G. M. Soriano, M. Ponomarev, D. Huang, H. Zhang, S. E. Martinez, and J. L. Smith. 1996. Some new structural aspects and old controversies concerning the cytochrome b6f complex of oxygenic photosynthesis. Annu. Rev. Plant Physiol. Plant Mol. Biol. 47:477–508. [DOI] [PubMed] [Google Scholar]
- Dekker, J. P., H. van Roon, and E. J. Boekema. 1999. Heptameric association of light-harvesting complex II trimers in partially solubilized photosystem II membranes. FEBS Lett. 449:211–214. [DOI] [PubMed] [Google Scholar]
- Dinsmore, A. D., A. G. Yodh, and D. J. Pine. 1996. Entropic control of particle motion using passive surface microstructures. Nature. 383:239–242. [Google Scholar]
- Garab, G., and L. Mustárdy. 1999. Role of LHC II containing macrodomains in the structure, function and dynamics of grana. Aust. J. Plant Physiol. 26:649–658. [Google Scholar]
- Hankammer, B., J. Barber, and E. J. Boekema. 1997. Structure and membrane organization of photosystem II in green plants. Annu. Rev. Plant Physiol. Plant Mol. Biol. 48:641–671. [DOI] [PubMed] [Google Scholar]
- Hope, A. B. 1993. The chloroplast cytochrome bf complex: a critical focus on function. Biochim. Biophys. Acta. 1143:1–22. [DOI] [PubMed] [Google Scholar]
- Huang, D., R. M. Everly, R. H. Cheng, J. B. Heymann. H. Schägger, V. Sled, T. Ohnishi, T. S. Baker, and W. A. Cramer. 1994. Characterization of the chloroplast cytochrome b6f complex as a structural and functional dimer. Biochemistry. 33:4401–4409. [DOI] [PMC free article] [PubMed] [Google Scholar]
- Istokovics, A., I. Simidjiev, F. Lajkó, and G. Garab. 1997. Characterization of the light-induced reversible changes in the chiral macro-organization of the chromophores in chloroplast thylakoid membranes. Temperature dependence and effect of inhibitors. Photosynth. Res. 54:45–53. [Google Scholar]
- Janson, S. 1994. The light-harvesting chlorophyll a/b binding proteins. Biochim. Biophys. Acta. 1184:1–19. [DOI] [PubMed] [Google Scholar]
- Joliot, P., and A. Joliot. 1992. Electron transfer between photosystem II and the cytochrome bf complex: mechanistic and structural implications. Biochim. Biophys. Acta. 1102:53–61. [Google Scholar]
- Joliot, P., J. Lavergne, and D. Béal. 1992. Plastoquinone compartmentation in chloroplasts. I. Evidence for domains with different rates of photo-reduction. Biochim. Biophys. Acta. 1101:1–12. [Google Scholar]
- Kirchhoff, H., S. Horstmann, and E. Weis. 2000. Control of the photosynthetic electron transport by PQ diffusion microdomains in thylakoids of higher plants. Biochim. Biophys. Acta. 1459:148–168. [DOI] [PubMed] [Google Scholar]
- Kirchhoff, H., U. Mukherjee, and H.-J. Galla. 2002. Molecular architecture of the thylakoid membrane: lipid diffusion space for plastoquinone. Biochemistry. 41:4872–4882. [DOI] [PubMed] [Google Scholar]
- Krause, G. H., and E. Weis. 1991. Chlorophyll fluorescence and photosynthesis: the basics. Annu. Rev. Plant Physiol. Plant Mol. Biol. 42:313–349. [Google Scholar]
- Kubitscheck, U., and R. Peters. 1998. Localization of single nuclear pore complexes by confocal laser scanning microscopy and analysis of their distribution. Methods Cell Biol. 53:79–98. [DOI] [PubMed] [Google Scholar]
- Kühlbrandt, W., and D. N. Wang. 1991. Three-dimensional structure of plant light-harvesting complex determined by electron crystallography. Nature. 350:130–134. [DOI] [PubMed] [Google Scholar]
- Lavergne, J., J.-P. Bouchaud, and P. Joliot. 1992. Plastoquinone compartmentation in chloroplasts. II. Theoretical aspects. Biochim. Biophys. Acta. 1101:13–22. [Google Scholar]
- Lavergne, J., and P. Joliot. 1991. Restricted diffusion in photosynthetic membranes. Trends Biochem. Sci. 16:129–134. [DOI] [PubMed] [Google Scholar]
- McQuarrie, D. A. 1976. Statistical Mechanics. Harper Collins, New York.
- Murphy, D. J. 1986. The molecular organisation of the photosynthetic membranes of higher plants. Biochim. Biophys. Acta. 864:33–94. [Google Scholar]
- Onsager, L. 1949. The effects of shape on the interaction of colloid particles. Ann. N. Y. Acad. Sci. 51:627–659. [Google Scholar]
- Saxton, M. J. 1992. Lateral diffusion and aggregation. Biophys. J. 61:119–128. [DOI] [PMC free article] [PubMed] [Google Scholar]
- Saxton, M. J. 1993. Lateral diffusion in an archipelago. Dependence on tracer size. Biophys. J. 64:1053–1062. [DOI] [PMC free article] [PubMed] [Google Scholar]
- Shih, W. Y., I. A. Aksay, and R. Kikuchi. 1987. Reversible-growth model: Cluster-cluster aggregation with finite binding energies. Phys. Rev. A. 36:5015–5019. [DOI] [PubMed] [Google Scholar]
- Tremmel, I. G., H. Kirchhoff, E. Weis, and G. D. Farquhar. 2003. Dependence of plastoquinol diffusion on the shape, size, and density of integral proteins. Biochim. Biophys. Acta. 1607:97–109. [DOI] [PubMed] [Google Scholar]
- Yakushevska, A. E., P. E. Jensen, W. Keegstra, H. van Roon, H. V. Scheller, E. J. Boekema, and J. P. Dekker. 2001. Supermolecular organization of photosystem II and its associated light-harvesting antenna in Arabidopsis thaliana. Eur. J. Biochem. 268:6020–6028. [DOI] [PubMed] [Google Scholar]


