

Abstract
Knowledge of the phalloidin binding position in F-actin and the relevant understanding of the mechanism of F-actin stabilization would help to define the structural characteristics of the F-actin filament. To determine the position of bound phalloidin experimentally, x-ray fiber diffraction data were obtained from well-oriented sols of F-actin and the phalloidin-F-actin complex. The differences in the layer-line intensity distributions, which were clearly observed even at low resolution (8 Å), produced well-resolved peaks corresponding to interphalloidin vectors in the cylindrically averaged difference-Patterson map, from which the radial binding position was determined to be ∼10 Å from the filament axis. Then, the azimuthal and axial positions were determined by single isomorphous replacement phasing and a cross-Patterson map in radial projection to be ∼84° and 0.5 Å relative to the actin mass center. The refined position was close to the position found by prior researchers. The position of rhodamine attached to phalloidin in the rhodamine-phalloidin-F-actin complex was also determined, in which the conjugated Leu(OH)7 residue was found to face the outside of the filament. The position and orientation of the bound phalloidin so determined explain the increase in the interactions between long-pitch strands of F-actin and would also account for the inhibition of phosphate release, which might also contribute to the F-actin stabilization. The method of analysis developed in this study is applicable for the determination of binding positions of other drugs, such as jasplakinolide and dolastatin 11.
INTRODUCTION
Actin is one of the most abundant proteins in the cell. The polymerization-depolymerization cycle of actin and the networking of actin filaments are essential for maintaining cell activities such as cell motility and cell division. In vivo, actin polymerization is controlled by numerous actin-binding proteins. To classify and to understand the control mechanisms based on the diverse interactions of binding proteins with F-actin, it is necessary first to understand the structural basis of the F-actin stabilization mechanism itself.
Phalloidin is a well-known stabilizer of F-actin; it inhibits both release of phosphate as an ATPase product (Dancker and Hess, 1990) and depolymerization of F-actin (Dancker et al., 1975; Estes et al., 1981). The aim of this study is to discuss one of the key mechanisms that stabilize F-actin by determining the position of bound phalloidin and analyzing its binding interactions to actin subunits. In the previous work, the position of phalloidin bound to F-actin was determined by modeling based only on the diffraction data from the phalloidin-F-actin complex (Lorenz et al., 1993). The method was model-dependent and therefore may not be free from bias. In the present study, we took a new approach to determining the position and orientation of phalloidin molecule in F-actin. We prepared well-orientated sols of F-actin and the phalloidin-F-actin complex and obtained x-ray fiber diffraction patterns from these sols. After extraction of layer-line amplitude data from the patterns, we determined the radial position of bound phalloidin by using a cylindrically averaged difference-Patterson map. Then, the axial and azimuthal positions relative to actin subunit were determined by single isomorphous replacement phasing and a cross-Patterson map in radial projection as described below in detail. Finally, we refined the orientation of bound phalloidin based on fiber diffraction data from the rhodamine-phalloidin-F-actin complex. Possible mechanisms for stabilization of the F-actin structure are discussed based on the binding interactions of phalloidin and actin. The new method reported here is applicable to other small molecules bound to F-actin.
MATERIALS AND METHODS
Preparation of F-actin sol specimens
F-actin was prepared with a gelsolin cap to control the filament length. Phalloidin (or rhodamine-phalloidin, which was provided by Prof. Dr. H. Faulstich, Max Planck Institute) was added to F-actin after the filament formation. Highly oriented F-actin sols were prepared according to the method we previously described (Oda et al., 1998). The sols were incubated in superconducting magnets for a couple of weeks before the diffraction data collection to improve the orientation of F-actin in the sol specimens. The distribution of F-actin orientation as measured from the diffraction data was significantly improved by using a newly installed magnet with a field strength of 18.5-Tesla compared with those prepared with a magnet of 13.5-Tesla that we previously used. Typical solvent conditions were 30 mM NaCl, 10 mM Tris-acetate (pH 8), 1 mM CaCl2, 0.5 mM ATP, 1 mM 2-mercaptoethanol, and 1 mM NaN3. We also tried using KCl or C6H5COONa as monovalent salt, but we were unable to observe any systematic differences in the diffraction patterns.
Recording of x-ray diffraction patterns from F-actin sols
Diffraction patterns from these sols were recorded by using either of the following two systems. One is a rotating anode x-ray generator with a Cu target (RU-200; Rigaku, Tokyo, Japan) and image plates scanned off-line at a raster size of 100 μm (BA100, Fuji Film, Odawara, Japan). Diffraction data were recorded at a specimen-detector distance of ∼170 mm with an exposure time of 10 h. The other is a synchrotron source and an image plate detector (R-AXIS4, Rigaku, Osaka, Japan). Diffraction data were recorded at a specimen-detector distance of ∼400 mm, a wavelength of 1.00 Å, with an exposure time of 120 or 150 s at a SPring-8 beam-line, BL40B2. The diffraction patterns were processed as described by Yamashita et al. (1995): the four quadrants were averaged, the circular symmetric backgrounds were subtracted, and the resulting patterns were mapped into the reciprocal space.
Analysis of diffraction patterns and extraction of amplitudes
A program for layer-line deconvolution based on the two-dimensional profile-fitting procedure (K. Hasegawa, I. Yamashita, and K. Namba, unpublished) was used to extract layer-line amplitude distributions. The program recovers the intensity profiles along each layer-line whose position was calculated by given parameters (the helical pitch, the helical symmetry, the disorientation angle, etc.).
These parameters were refined as follows (Oda et al., 2001a): 1), the pitch of the 1-start helix from the position of 59 Å layer-line; 2), the helical symmetry from the positions of 51 Å and of 59 Å layer-lines; and 3), the disorientation angle from the width of 59 Å layer-lines. In almost all cases, the amplitudes were extracted by using either of the following symmetries: 13/6, 132/61, 67/31, 136/63, 69/32, and 28/13. Layer-lines that are contributed only by the Bessel functions having the order higher than the seventh were removed from the profile-fitting procedure, because the interval between nearest layer-lines are small and they were not well resolved. In the following calculation, these Bessel terms were neglected. The total number of layer-lines extracted was 48. In every case, the layer-line positions were not largely different from that of the well-known symmetry of 13/6. In this study, therefore, the layer-lines are denoted based on the symmetry of 13/6. Layer-line amplitudes were finally extracted from each diffraction pattern up to a resolution of 0.14 Å−1.
The intensities that were extracted using the helical symmetry other than 67/31 were re-indexed according to the symmetry 67/31 based on the Bessel order. A helical pitch of 58.8 Å, a helical symmetry of 67/31, and layer-line amplitude data in a resolution range of 0.020–125 Å−1 were used for the determination of the bound phalloidin position and orientation.
Radial position determined from cylindrically averaged difference-Patterson map
A cylindrically averaged difference-Patterson map was calculated by using layer-line amplitude data obtained from F-actin and phalloidin-F-actin using the equation (MacGillavry and Bruins, 1948; Vainshtein, 1965) of
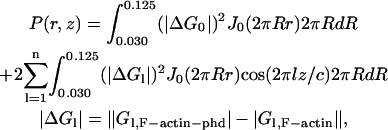 |
(1) |
where Gl,F-actin and Gl,F-actin-phd are the amplitude distribution along the lth layer-line for F-actin and phalloidin-F-actin, respectively. The value J0 is the zero-order Bessel function. The grid size used to calculate the Patterson map is 1 Å.
To determine the radial position of bound phalloidin, the correlation function between the difference-Patterson map and Patterson maps calculated from the atomic coordinates of phalloidin models was calculated in an area surrounding the peak,
 |
(2) |
where ρcalc and ρobs represent the value in a model Patterson map and the difference-Patterson map, respectively. The phalloidin molecule was placed (r) at every 1 Å and oriented (θ, φ, χ) at every 20° around an approximate radial position determined from the peak position in the difference-Patterson map, and the radial position and orientation with the maximum correlation was determined.
Azimuthal and axial position of bound phalloidin from the cross-Patterson map in radial projection
The azimuthal and axial position of bound phalloidin relative to actin subunit in F-actin was determined by using single isomorphous replacement phasing and a cross-Patterson map in radial projection by the following procedures:
The structure factor of phalloidin alone located on the x axis at the radial position and orientation obtained above was calculated. It was then treated as a set of heavy atoms bound to F-actin to deduce the phases of the F-actin structure factor by single isomorphous replacement phasing based on the two sets of observed amplitudes, one from F-actin and the other from phalloidin F-actin. In the Harker construction diagram (Harker, 1956), two structure factors, Gnl(R)1 and Gnl(R)2, were obtained for each reflection, and the best structural factor was deduced as Gnl(R)e = (G−nl(R)1 + Gnl(R)2)/2.
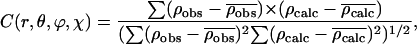
The following cross-Patterson map in radial projection was calculated (MacGillavry and Bruins, 1948; Vainshtein, 1965) at an interval of 1 Å in the z axis and 1° in the φ-axis,
 |
(3) |
The value Gnl(R)m expresses the structural factor of F-actin having the experimental amplitudes and the model phases derived with the actin model mass centered on the x axis. The value Gnl(R)e expresses the experimental structural factor of F-actin, which is the best structure factor determined above. In the map, a peak indicates the rotation (φ) and translation along the filament axis (z) to fit the two F-actin densities to each other. In other words, we can obtain the azimuthal and axial position of bound phalloidin relative to the actin subunit on the x axis in the filament.
Refinement of position and orientation of bound phalloidin
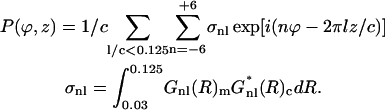
To refine the position and orientation of bound phalloidin, the following equation was used,
 |
(4) |
where w is a weighting factor (=1/Fl,F-actin-phd) and s is a scaling factor including B-factor (= A exp(−Bs2/4)). The values Gnl,F-actin and Gnl,phd(r, Φ, z, θ, φ, χ) are the Fourier-Bessel functions derived from the experimental amplitudes with F-actin model phases and those calculated from the atomic coordinates of phalloidin, respectively (Klug et al., 1958). Q was calculated for each position (r, Φ, z) and orientation (θ, φ, χ) of phalloidin at every 0.5 Å and 10°, respectively, around the position determined above, and the minimum Q was searched through. Then, using a set of parameters (r, Φ, z, θ, φ, χ) as an initial guess, the translation and orientation were refined by Powell's method (Press et al., 1994). We used the atomic scattering factors modified for bulk-solvent correction (Holmes et al., 1990).
RESULTS
Extraction of amplitude data from x-ray fiber diffraction patterns
X-ray diffraction patterns were obtained from well-oriented liquid crystalline sols of F-actin and the phalloidin F-actin complex (Fig. 1). First, the pitch of the 1-start left-handed helix (the basic helix), the helical symmetry, and the angular distribution of filament disorientation (Holmes and Barrington-Leigh, 1974) were determined to predict the positions of all the layer-lines and to reconstruct the two-dimensional intensity profile to extract the layer-line amplitudes. The pitch of the basic helix was 58.7(6) Å for F-actin and 58.7(2) Å for phalloidin F-actin, and these two pitches are identical within experimental error. On the other hand, the helical symmetry was distributed between 67 subunits/31 turns (∼2.161) and 132/61 (∼2.164) for F-actin and ∼69/32 (∼2.156) for the phalloidin F-actin complex. The symmetry change induced by phalloidin binding is consistent with the previous studies (Orlova et al., 1995). This shows that the binding of phalloidin to F-actin affects the twist of the F-actin helix. For analysis, we used only the diffraction patterns that had a disorientation angle <∼3°. This is important for obtaining the correct structural factors because the extracted layer-line amplitudes depend slightly on the angular disorientation of F-actin in the sols (Oda et al., 2001b).
FIGURE 1.

Processed diffraction patterns from F-actin sols on the central section of the reciprocal space. The left and right halves show the patterns in the presence and absence of phalloidin, respectively. The diffraction patterns were recorded on imaging plates with a size of 30 cm × 30 cm at SPring-8 BL40B2, and were read out with a raster interval of 100 μm. The exposure times were 120 s for F-actin and 150 s for the phalloidin F-actin complex. The specimen-detector distance was 396.12 mm. The edge of these patterns corresponds to 8 Å resolution.
Layer-line amplitudes were extracted from each diffraction pattern out to a resolution of 0.14 Å−1. Then, layer-line amplitudes from multiple diffraction patterns were averaged and the R-merge factor was calculated. The R-merge for four diffraction patterns with phalloidin and that for three diffraction patterns without phalloidin were 6.6 and 5.4%, respectively. The crystallographic R-factor between these two merged data sets was 11%. Thus, the difference in the two sets of diffraction data with and without phalloidin was large enough for the determination of the bound phalloidin position. Even by visual inspection of the diffraction patterns, the intensity of the second peak of the 0th (equator), 6th, and 7th layer-lines and that of the first peak of the 13th layer-line are clearly different between the two structures (Figs. 1 and 2; see also Oda et al., 2001b).
FIGURE 2.

Layer-line amplitude distributions. Solid and dotted lines represent profiles from F-actin and the phalloidin F-actin complex, respectively.
Radial position of phalloidin
A cylindrically averaged difference-Patterson map (MacGillavry and Bruins, 1948) was constructed by using the layer-line amplitude data from F-actin and phalloidin-F-actin in a resolution range of 0.030–0.125 Å−1. Peaks appeared clearly on the map, and the positions were independent of the resolution range used. The peaks were interpreted as the vectors between bound phalloidin molecules, and the vector length indicated that the distance between the nearest-neighbor phalloidin molecules is ∼33 Å (Fig. 3 a).
FIGURE 3.

Patterson maps and correlation function used to determine the position and orientation of phalloidin. (a) Difference-Patterson map between F-actin and phalloidin-F-actin; (b) calculated Patterson map from a phalloidin model located at r = 9.5 Å in the helical lattice of F-actin. These two maps were normalized and the height at the origin was set to 1000. The maps were contoured only at levels between 10 and 110 at an interval of 10. Some of the high contour levels were omitted near the meridian for clarity. (c) Correlation between the difference-Patterson map (Fig. 3 a) and the calculated Patterson map (Fig. 3 b). A series of Patterson maps was calculated as the phalloidin molecule was rotated at its mass center with intervals of 20° at a given radius. For each orientation and radial position, the correlation was calculated for three peak areas, within a radial range from 0 to 39 Å and an axial range of 21 Å, each centered at 27, 82, and 138 Å along the axial direction. (d) Cross-Patterson map in radial projection between structural factors with experimental phases and with the conventional model phases. The experimental phases were deduced from the radial position and orientation of bound phalloidin determined in c. The model phase was calculated from the model of Holmes et al. (1990). The map shows spatial correlations of F-actin with the experimental phases against the one with the model phases. The map density was normalized at the origin to be 1000.
The radial position of bound phalloidin was accurately determined by finding the maximal correlation (Eq. 2) between the difference-Patterson map and Patterson maps calculated from the atomic coordinates of phalloidin models placed at different radial positions. Due to cylindrical averaging and limited resolution, the correlation had a relatively broad maximum (Fig. 3 c), and therefore, a unique radial position and orientation could not be determined. However, the radial position was determined at least within a range between 9.5 and 10.5 Å.
Axial and azimuthal position of phalloidin in the F-actin model
The best phase angles were obtained for reflections of F-actin by using the Harker (1956) diagram on the basis of the bound phalloidin with its mass center located at the radial position described above (9.5 Å) on the x axis (hereafter termed the experimental structural factor of F-actin). At the same time, the observed amplitudes were combined with phases calculated from the Holmes et al. (1990) F-actin model coordinates, with the actin mass center put on the x axis (the model structural factor). A cross-Patterson map in radial projection was calculated from these two sets of structural factors (Fig. 3 d). The map was interpreted as the spatial correlation in φ–z projection in real space between the two F-actin filaments. The peak nearest the origin was located at φ = 84° and z = 0.5 Å, showing that F-actin with experimental phases fit that with model phases by rotation of 84° and translation of 0.5 Å. Namely, bound phalloidin was located at a position of 84° φ-rotation and 0.5 Å z-translation when an actin subunit in the filament was placed on the x axis. The deduced position of bound phalloidin was only slightly dependent on the conformational differences of the F-actin models used, even though these models have different local structures within the radial region being considered.
In conclusion, bound phalloidin was located within a radial range of 8.5–11.5 Å, an azimuthal range of 75°–100°, and an axial range of −2 Å to 2 Å relative to the actin subunit.
Refinement of the phalloidin position
Finally, the position and orientation of bound phalloidin were refined by using the Q function defined in Eq. 4. The results are shown, not as an atomic model of phalloidin, but as its electron density at 8 Å resolution in the F-actin model (Fig. 4). The calculated layer-line amplitude profiles are also compared with the observed ones (Fig. 5). By adding the phalloidin model, the crystallographic R-factor between the two profiles decreased from 12.0% to 9.5%, when the model phase of Lorenz et al. (1993) was used. Similar results were obtained by using the other F-actin models. The final position was almost identical irrespective of the F-actin model phases used. Also, it did not depend much on the phalloidin conformation. Phalloidin is located close to the loop of 198–201 of the lower actin subunit, the loop of 73–75, and the sheet including 197 of the diagonal subunit, but is rather distant from the upper subunit. This result basically supports the phalloidin position determined by Lorenz et al. (1993), although the refined position is somewhat closer to the filament axis.
FIGURE 4.

The determined phalloidin position in F-actin. The refined position and orientation of bound phalloidin are shown as electron densities in three subunits of the Lorenz F-actin model (stereo view). The electron densities of phalloidin molecule were derived from the coordinates by truncating the Fourier transform at a resolution of 8 Å, as used in the analysis. The residues 73, 177, 179, 196–200, and 285–287 are shown in ball-and-stick representation. Note that the results were almost independent of the F-actin model phases used: the model of Holmes et al. (blue), the model of Lorenz et al. (green), the model based on the tight crystal structure (magenta), and the model of Tirion et al. (cyan). The tight crystal-structure was made by placing the tight conformation G-actin (Schutt et al., 1993) on the actin helix. In this diagram, the electron densities for phalloidin are slightly asymmetric, indicating the low resolution shape of phalloidin placed in the most plausible orientations. Atomic models of phalloidin were not shown here because details of interaction between F-actin and phalloidin are beyond the resolution of the present analysis (see text for discussion on the plausible orientation of phalloidin). This figure was made with Bobscript (Esnouf, 1997).
FIGURE 5.

Comparison of observed layer-line amplitudes from phalloidin F-actin complex (solid line) with those calculated from a model (dotted line). The calculated amplitudes were obtained from the structure factors of F-actin with observed amplitudes and model phases and the structure factor of phalloidin calculated in its most plausible position and orientation.
To determine the orientation of bound phalloidin, we made use of rhodamine-conjugated phalloidin. We collected x-ray diffraction patterns from well-oriented sols of the rhodamine-conjugated phalloidin-F-actin complex and analyzed the data in the same way. The helical symmetry and the pitch were almost the same as phalloidin-F-actin, which indicated that rhodamine does not perturb the phalloidin-F-actin structure. The position of rhodamine was determined by the difference- and cross-Patterson maps (Fig. 6, a and b), and the position was refined using an atomic model of rhodamine. The resulting position is shown in Fig. 7, indicating that the rhodamine-conjugated Leu(OH)7 residue faces the outside of the filament. However, the azimuthal and axial positions, and especially the orientation of conjugated rhodamine, are all tentative because of relatively small differences in the observed intensities in the presence and absence of rhodamine. The result is consistent with the position by Heidecker et al. (1995).
FIGURE 6.

Difference- and cross-Patterson maps to determine the position and orientation of rhodamine. (a) Cylindrically averaged difference-Patterson map between phalloidin-F-actin and phalloidin-rhodamine-F-actin. Peak positions (▪) were those expected from a rhodamine model located at r = 17 Å in the helical lattice of F-actin. The map was normalized to have the height at the origin 1000. Some of the high contour levels were omitted near the meridian for clarity. (b) Cross-Patterson map in radial projection between phalloidin-F-actin structural factors with experimental phases and with the conventional model phases. The experimental phases were deduced from the position of bound rhodamine. The model phase was calculated using the F-actin model of Lorenz et al. (1993) and the model of bound phalloidin determined in this study (Fig. 4). The map was normalized at the origin to be 1000.
FIGURE 7.

Electron densities corresponding to phalloidin (blue) and rhodamine (red) determined in the rhodamine phalloidin F-actin complex. The density of rhodamine was calculated in a similar way to that described in Fig. 4, by using the Lorenz F-actin model and the model of bound phalloidin determined in this study. Similar results were obtained by using the other phase sets. The differences of amplitudes between the rhodamine phalloidin F-actin complex and the phalloidin F-actin complex were smaller than those used for the determination of phalloidin position. By adding a mass corresponding to rhodamine, the crystallographic R-factor decreased from 4.9% to 4.1%. The R-merge was 2.9% (n = 2) and 3.5% (n = 7) for the phalloidin F-actin complex and rhodamine phalloidin F-actin complex, respectively. This figure was made with Bobscript (Esnouf, 1997).
DISCUSSION
Refined position and orientation of phalloidin in F-actin
We determined the position of phalloidin bound to F-actin by x-ray fiber-diffraction data analysis. The refined position of phalloidin is similar to that found by Lorenz et al. (1993) and was not sensitive to small conformational differences of the F-actin models used for phasing. The binding site is close to residues that are known to be required for F-actin-binding of phalloidin. It is close to the loop of 198–201 of the lower actin subunit, the loop of 73–75, and the sheet including 179 of the diagonal subunit, but is rather distant from the upper subunit. It is reasonable that phalloidin cannot bind to Tetrahymena actin because it has relatively low similarity in the amino acid sequence to skeletal muscle actin. Overall identity is 74.6%, but one large difference between the two exists in the region of residues 190–200, which is hydrophilic in skeletal muscle actin but hydrophobic in Tetrahymera actin (Hirono et al., 1987). Phalloidin cannot bind to a double-site mutant yeast F-actin, R177A/D179A (Drubin et al., 1993). The side chains of Arg177 and Asp179 reside at ∼6 Å from the mass-center of phalloidin both in the Lorenz model and in the Holmes model. Since the size of the phalloidin molecule is ∼6 Å, it may be placed in contact with Arg177 and Asp179. However, the Arg177 side chain may not be extended toward phalloidin, but rather the side chains of Arg177 and Asp179 form tangential contacts with the phalloidin molecule. This is because phalloidin can bind to actin with a single mutation R177D and stabilizing F-actin (Schüler et al., 2000), and because the Arg177 may interact with Ser199 of the adjacent subunit, On the other hand, Met119, Gln117, and Met355 of F-actin react with bound affinity-labeling derivatives of phalloidin (Vandekerckhove et al., 1985). The side chains of Met119 and Gln117 are located ∼20 Å from the mass-center of phalloidin, and thus the cross-linking results are accounted for by the arm-length of the derivatives. However, Met355 is too far to be cross-linked with a derivative that binds specifically to the phalloidin-binding site. The apparent positive result might be due to cross-linking with a phalloidin molecule that binds to a weak subsidiary binding site on F-actin. This might have happened because the experiment was carried out at fivefold molar excess of the phalloidin derivative.
Phalloidin position and orientation in F-actin using some local information
Phalloidin is composed of two rings. One ring is Cys3-Pro(OH)4-Ala5-Trp6. This part is essential for the toxicity of phalloidin. For example, phalloidin loses its toxicity by the replacement of Ala5 with Gly, replacement of cis-Pro(OH)4 with trans-Pro(OH), or alkylation of indole NH in Trp6 (Wieland, 1986). Recent structural analysis showed that these residues form either a β-turn type-I structure in DMSO (Kessler and Wein, 1991) as well as in the crystal of Leu7 Ala-phalloidin (Zanotti et al., 2001), or a β-turn type-II structure in water at pH 3 (Kobayashi et al., 1995). The transition between the two conformations does not occur in a short timescale accessible by molecular dynamics simulations. This suggests that this ring has a unique and rigid conformation under each condition, which is required for the toxicity (Kobayashi et al., 1995; Zanotti et al., 2001).
The other ring is Ala1-Thr2-Cys3-Trp6-Leu(OH)7. From several studies on syntheses and modification of phallotoxins, Ala1, Thr2, and Leu(OH)7 are not considered to be important for toxicity. Cross-linking studies (Vandekerckhove et al., 1985; Faulstich et al., 1993) suggest that Leu(OH) faces out as does the electron microscopic study of phalloidin conjugated with a gold cluster at Leu7, PHD-Leu7(OH)-NHCO(CH4)CONH-CH2-Au11 (Steinmetz et al., 1998). Our result provides more direct support for these observations.
We searched for positions and orientations of bound phalloidin consistent with the restrictions derived from the atomic models and diffraction data as discussed above. First, we found several candidates for the position and orientation of phalloidin in F-actin with a low binding energy using AutoDock version 3.0 (Goodsell and Olson, 1990; Morris et al., 1996, 1998). Then, we chose the final candidates for the position of bound phalloidin by applying the following criteria and assumptions:
The rigid ring Cys3-Pro(OH)4-Ala5-Trp6 should dominate the contact with F-actin.
The center of mass of phalloidin should be within the range determined from the diffraction data.
The side chain of Leu(OH) should be readily accessible from the outside of the F-actin structure.
For the F-actin models by Holmes et al. (1990), we did not find any good candidate for the phalloidin position and orientation within the possible region determined by diffraction data (see below), irrespective of the phalloidin conformation, probably because of a wider separation between the two long-pitch strands in the model. For the F-actin model by Tirion et al. (1995), we also could not find any stable candidate with the major population and the low binding energy, because the extended side chain of His73 interferes with phalloidin binding to the binding site. For the F-actin model by Lorenz et al. (1993), we found three good candidates. (The positions and orientations of phalloidin molecule in these candidates, as well as the binding site in F-actin, have not been optimized for the lowest binding energy, because this requires too many assumptions.) One of these plausible models of phalloidin with a type-II β-turn conformation is shown in Fig. 8, which might be similar to the model by Steinmetz et al. (1998). It is worth noting, however, that the present results did not decrease the R-factor as initially expected. This might be due to the fact that a substantial conformational change of actin that may be induced by the phalloidin binding is not at all taken into account in this analysis. In fact, Lorenz et al. (1993) modified the actin conformation around the phalloidin binding site to improve the fitting of the calculated diffraction data to the observed data. Without introducing such conformational modification, there is no binding pocket in the models by Holmes et al. (1990) and by Tirion et al. (1995) suitable for accommodating phalloidin.
FIGURE 8.

The best candidate for the position and orientation of bound phalloidin. This solution satisfies the three restricting conditions: stereochemical interactions; diffraction data; and stereochemical knowledge about F-actin and phalloidin interactions. See the main text for details.
Mechanism of F-actin stabilization by phalloidin
The bound phalloidin is located at the contact region of three actin subunits. The physical contact would be the important factor for F-actin stabilization. This is consistent with the fact that phalloidin accelerates the nucleation, namely the formation of trimer or tetramer, for actin polymerization (Wendel and Dancker, 1987). According to the atomic model of F-actin, the interactions between actin subunits in the two long-pitch strands are relatively weak. However, subdomain 4 in one strand and subdomain 1 in the opposite strand appear to change their conformations together under different conditions (Belmont et al., 1999; Orlova and Egelman, 1992, 1995), suggesting that these inter-subdomain interactions may play an important role in the stabilization of F-actin. The binding of phalloidin between the two strands would account for its role in stabilizing the F-actin structure. This idea is supported by a report that phalloidin rescues the polymerization activity lost by mutation of the hydrophobic plug (Kuang and Rubenstein, 1996).
Wriggers and Schulten (1999) have proposed based on their steered molecular dynamics study that the charges of methylated-His73 and Arg177 are essential for phosphate release from actin, and the phosphate release pathway involves these residues. Bound phalloidin would plug the exit of the pathway and thereby inhibit the phosphate release, as was observed by Dancker and Hess (1990). However, a recent biochemical study does not provide support for the hypothesis of Pi exit (Nyman et al., 2002), and a different explanation would be necessary for the inhibition of phosphate release. Although the mechanism is not clear, F-actin polymerized by phalloidin would contain actin-ADP-Pi as the main species. Since ADP-Pi F-actin is more stable than the normal ADP F-actin (Carlier and Pantalone, 1988), this might be an additional mechanism for the stabilization of F-actin by phalloidin binding.
Some groups have presented an idea that the stabilization of F-actin arises from conformational changes of F-actin induced by phalloidin binding (Sampath and Pollard, 1991; Orlova et al., 1995). Unfortunately, we cannot discuss this issue, since conformational changes of actin that may induced by the phalloidin binding are not taken into consideration in our analysis.
A new method to determine the position of bound phalloidin in F-actin filament
In the previous work, the position of the phalloidin molecule bound to actin was determined by modeling based only on the diffraction data from the phalloidin F-actin complex (Lorenz et al., 1993). The method was model-dependent and therefore may not be free from bias. In the present approach, we employed the cylindrical Patterson map to determine the radial position of phalloidin directly from experimental fiber-diffraction data, without any modeling. This new method is widely applicable to any small drug-molecule-bound filament structures. The map may be interpreted even when the map is noisy, if the stoichiometry of a bound molecule is known. Once the radial position is determined, the axial and azimuthal position of the bound molecule relative to the subunit can be determined with high confidence. The method has been successfully applied to determine the bound dolastatin 11, another stabilizer of the F-actin structure (Oda et al., 2003), demonstrating its high potential in other applications to accurately determine the binding position and conformation of drugs in the macromolecular fiber structures.
Acknowledgments
We thank Prof. Dr. K.C. Holmes (Max Planck Institute for Medical Research) for critical reading of the manuscript. We also thank Dr. K. Hasegawa (JASRI) and Mr. K. Makino for recording of the diffraction patterns and development of software. The atomic coordinates of Leu7Ala-phalloidin and phalloidin with type II β-turn were kindly provided by Prof. Paolillo (Uni. di Napoli) and Dr. Kobayashi (RIKEN), respectively.
The work was partially supported by the Special Coordination Funds from the Ministry of Education, Culture, Sports, Science and Technology, Japan.
References
- Belmont, L. D., A. Orlova, D. G. Drubin, and E. H. Egelman. 1999. A change in actin conformation associated with filament instability after Pi release. Proc. Natl. Acad. Sci. USA. 96:29–34. [DOI] [PMC free article] [PubMed] [Google Scholar]
- Carlier, M. F., and D. Pantalone. 1988. Binding of phosphate to F-ADP-actin and role of ADP-Pi-actin in ATP actin polymerization. J. Biol. Chem. 263:817–825. [PubMed] [Google Scholar]
- Dancker, P., I. Low, W. Hasselbach, and T. Wieland. 1975. Interaction of actin with phalloidin: polymerization and stabilization of F-actin. Biochim. Biophys. Acta. 400:407–414. [DOI] [PubMed] [Google Scholar]
- Dancker, P., and L. Hess. 1990. Phalloidin reduces the release of inorganic phosphate during actin polymerization. Biochim. Biophys. Acta. 1035:197–200. [DOI] [PubMed] [Google Scholar]
- Drubin, D. G., H. D. Jones, and K. F. Wertman. 1993. Actin structure and function: roles in mitochondrial organization and morphogenesis in budding yeast and identification of the phalloidin-binding site. Mol. Biol. Cell. 4:1277–1294. [DOI] [PMC free article] [PubMed] [Google Scholar]
- Esnouf, R. M. 1997. An extensively modified version of MolScript that includes greatly enhanced coloring capabilities. J. Mol. Graph. Model. 15:112–113,132–134. [DOI] [PubMed] [Google Scholar]
- Estes, J. E., L. A. Selden, and L. C. Gershman. 1981. Mechanism of action of phalloidin on the polymerization of muscle actin. Biochemistry. 20:708–712. [DOI] [PubMed] [Google Scholar]
- Faulstich, H., S. Zobeley, D. Heintz, and G. Drewes. 1993. Probing the phalloidin binding site of actin. FEBS Lett. 318:218–222. [DOI] [PubMed] [Google Scholar]
- Goodsell, D. S., and A. J. Olson. 1990. Automated docking of substrates to proteins by simulated annealing. Proteins. 8:195–202. [DOI] [PubMed] [Google Scholar]
- Heidecker, M., Y. Yan-Marriott, and G. Marriott. 1995. Proximity relationships and structural dynamics of the phalloidin binding site of actin filaments in solution and on single actin filaments on heavy meromyosin. Biochemistry. 34:11017–11025. [DOI] [PubMed] [Google Scholar]
- Harker, D. 1956. The determination of the phases of the structure factors of non-centrosymmetric crystals by the method of double isomorphous replacement. Acta Crystallogr. 9:1–9. [Google Scholar]
- Hirono, M., H. Endoh, N. Okada, O. Numata, and Y. Watanabe. 1987. Tetrahymena actin. Cloning and sequencing of the Tetrahymena actin gene and identification of its gene product. J. Mol. Biol. 194:181–192. [DOI] [PubMed] [Google Scholar]
- Holmes, K. C., and J. Barrington-Leigh. 1974. The effect of disorientation on the intensity distribution of non-crystalline fibres. I. Theory. Acta Crystallogr. A30:635–638. [Google Scholar]
- Holmes, K. C., D. Popp, W. Gebhard, and W. Kabsch. 1990. Atomic model of the actin filament. Nature. 347:44–49. [DOI] [PubMed] [Google Scholar]
- Kessler, H., and T. Wein. 1991. Solution structure of phalloidin obtained by NMR spectroscopy in [D6]DMSO and molecular dynamics calculation in vacuo and in water. Liebigs Ann. Chem. 179–184.
- Klug, A., F. H. Crick, and H. W. Wyckoff. 1958. Diffraction by helical structures. Acta Crystallogr. 11:199–213. [Google Scholar]
- Kobayashi, N., S. Endo, H. Kobayashi, H. Faulstich, T. Wieland, and E. Munekata. 1995. Comparative study on the conformation of phalloidin, viroisin, and related derivatives in aqueous solution. Eur. J. Biochem. 232:726–736. [PubMed] [Google Scholar]
- Kuang, B., and P. A. Rubenstein. 1996. Beryllium fluoride and phalloidin restore polymerizability of a mutant yeast actin (V266G,L267G) with severely decreased hydrophobicity in a subdomain 3/4 loop. J. Biol. Chem. 272:1237–1247. [DOI] [PubMed] [Google Scholar]
- Lorenz, M., D. Popp, and K. C. Holmes. 1993. Refinement of the F-actin model against x-ray fiber diffraction data by the use of a directed mutation algorithm. J. Mol. Biol. 234:826–836. [DOI] [PubMed] [Google Scholar]
- MacGillavry, C. H., and E. M. Bruins. 1948. On the Patterson transforms of fibre diagrams. Acta Crystallogr. 1:156–158. [Google Scholar]
- Morris, G. M., D. S. Goodsell, R. Huey, and A. J. Olson. 1996. Distributed automated docking of flexible ligands to proteins: parallel applications of AutoDock 2.4. J. Comp. Aided Mol. Des. 10:293–304. [DOI] [PubMed] [Google Scholar]
- Morris, G. M., D. S. Goodsell, R. S. Halliday, R. Huey, W. E. Hart, R. K. Belew, and A. J. Olson. 1998. Automated docking using a Lamarckian genetic algorithm and empirical binding free energy function. J. Comput. Chem. 19:1639–1662. [Google Scholar]
- Nyman, T., H. Schüler, E. Korenbaum, C. E. Schutt, R. Karlsson, and U. Lindberg. 2002. The role of MeH73 in actin polymerization and ATP hydrolysis. J. Mol. Biol. 317:577–589. [DOI] [PubMed] [Google Scholar]
- Oda, T., K. Makino, I. Yamashita, K. Namba, and Y. Maéda. 1998. Effect of the length and effective diameter of F-actin on the filament orientation in liquid crystalline sols measured by x-ray fiber diffraction. Biophys. J. 75:2672–2681. [DOI] [PMC free article] [PubMed] [Google Scholar]
- Oda, T., K. Makino, I. Yamashita, K. Namba, and Y. Maéda. 2001a. Distinct structural changes detected by x-ray fiber diffraction in stabilization of F-actin by lowering pH and increasing ionic strength. Biophys. J. 80:841–851. [DOI] [PMC free article] [PubMed] [Google Scholar]
- Oda, T., K. Makino, I. Yamashita, K. Namba, and Y. Maéda. 2001b. The helical parameters of F-actin precisely determined from x-ray fiber diffraction of well-oriented sols. Results Probl. Cell Differ. 32:43–58. [DOI] [PubMed] [Google Scholar]
- Oda, T., Z. D. Crane, C. W. Dicus, B. A. Sufi, and R. B. Bates. 2003. Dolastatin 11 connects two long-pitch strands in F-actin to stabilize microfilaments. J. Mol. Biol. 328:319–324. [DOI] [PubMed] [Google Scholar]
- Orlova, A., E. Prochniewicz, and E. H. Egelman. 1995. Structural dynamics of F-actin. II. Cooperativity in structural transitions. J. Mol. Biol. 245:598–607. [DOI] [PubMed] [Google Scholar]
- Orlova, A., and E. H. Egelman. 1992. Structural basis for the destabilization of F-actin by phosphate release following ATP hydrolysis. J. Mol. Biol. 227:1043–1053. [DOI] [PubMed] [Google Scholar]
- Orlova, A., and E. H. Egelman. 1995. Structural dynamics of F-actin. I. Changes in the C-terminus. J. Mol. Biol. 245:582–597. [DOI] [PubMed] [Google Scholar]
- Press, W. H., S. A. Teukolsky, W. T. Vetterling, and B. P. Flannery. 1994. Numerical Recipes in C. The Art of Scientific Computing. Cambridge University Press, Cambridge. UK.
- Sampath, P., and T. D. Pollard. 1991. Effect of cytochalasin, phalloidin, and pH on the elongation of actin filaments. Biochemistry. 30:1973–1980. [DOI] [PubMed] [Google Scholar]
- Schutt, C. E., J. C. Myslik, M. D. Rozycki, N. C. W. Goonesekere, and U. Lindberg. 1993. The structure of crystalline profilin-β-actin. Nature. 365:810–816. [DOI] [PubMed] [Google Scholar]
- Schüler, H., M. Nyåkern, C. E. Schutt, U. Lindberg, and R. Karlsson. 2000. Mutational analysis of arginine 177 in the nucleotide binding site of β-actin. Eur. J. Biochem. 267:4054–4062. [PubMed] [Google Scholar]
- Steinmetz, M. O., D. Stoffler, S. A. Muller, W. Jahn, B. Wolpensinger, K. N. Goldie, A. Engel, H. Faulstich, and U. Aebi. 1998. Evaluating atomic models of F-actin with an undecagold-tagged phalloidin derivative. J. Mol. Biol. 276:1–6. [DOI] [PubMed] [Google Scholar]
- Tirion, M. M., D. ben-Avraham, M. Lorenz, and K. C. Holmes. 1995. Normal modes as refinement parameters for the F-actin model. Biophys. J. 68:5–12. [DOI] [PMC free article] [PubMed] [Google Scholar]
- Vainshtein, B. K. 1965. Diffraction of X-Rays by Chain Molecules. Elsevier Publishing, Amsterdam, The Netherlands.
- Vandekerckhove, J., A. Deboben, M. Nassal, and T. Wieland. 1985. The phalloidin binding site of F-actin. EMBO J. 4:2815–2818. [DOI] [PMC free article] [PubMed] [Google Scholar]
- Wieland, T. 1986. Peptides of Poisonous Amanita Mushrooms. Springer-Verlag, Heidelberg, Germany.
- Wendel, H., and P. Dancker. 1987. Influence of phalloidin on both the nucleation and the elongation phase of actin polymerization. Biochim. Biophys. Acta. 915:199–204. [DOI] [PubMed] [Google Scholar]
- Wriggers, W., and K. Schulten. 1999. Investigating a back door mechanism of actin phosphate release by steered molecular dynamics. Proteins. 35:262–273. [PubMed] [Google Scholar]
- Yamashita, I., F. Vonderviszt, Y. Mimori, H. Suzuki, K. Oosawa, and K. Namba. 1995. Radial mass analysis of the flagellar filament of Salmonella: implications for the subunit folding. J. Mol. Biol. 253:547–558. [DOI] [PubMed] [Google Scholar]
- Zanotti, G., L. Falcigno, M. Saviano, G. D'Auria, B. M. Bruno, T. Campanile, and L. Paolillo. 2001. Solid state and solution conformation of [Ala7]-phalloidin: a synthetic phallotoxin analogue. Chem. Eur. J. 7:1479–1485. [DOI] [PubMed] [Google Scholar]