Abstract
Hydrogen bonding is a fundamental element in protein structure and function. Breaking a single hydrogen bond may impair the stability of a protein. We report an infrared vibrational spectral marker for probing the hydrogen-bond number for buried, protonated Asp or Glu residues in proteins. Ab initio computational studies were performed on hydrogen-bonding interactions of a COOH group with a variety of side-chain model compounds of polar and charged amino acids in vacuum using density function theory. For hydrogen-bonding interactions with polar side-chain groups, our results show a strong correlation between the C=O stretching frequency and the hydrogen bond number of a COOH group: ∼1759–1776 cm−1 for zero, ∼1733–1749 cm−1 for one, and 1703–1710 cm−1 for two hydrogen bonds. Experimental evidence for this correlation will be discussed. In addition, we show an approximate linear correlation between the C=O stretching frequency and the hydrogen-bond strength. We propose that a two-dimensional infrared spectroscopy, C=O stretching versus O-H stretching, may be employed to identify the specific type of hydrogen-bonding interaction. This vibrational spectral marker for hydrogen-bonding interaction is expected to enhance the power of time-resolved Fourier transform infrared spectroscopy for structural characterization of functionally important intermediates of proteins.
INTRODUCTION
Buried carboxylic groups from the side chains of aspartic (Asp) and glutamic (Glu) acids are often found in the active sites of proteins. Despite the low pKa values (typically ∼4) of exposed carboxylic groups, many buried carboxylic groups exhibit anomalously shifted-pKa values (Creighton, 1997), some as high as 11 (Meyer et al., 2003; Szaraz et al., 1994). Due to large increases in pKa values, these ionizable groups are protonated at neutral pH conditions. The pKa values of these groups may change dramatically during the functional processes of proteins, resulting in deprotonation and proton transfer (Song et al., 2003; Xie et al., 2001). Hydrogen-bonding interactions play key roles in regulating the pKa values of ionizable groups and in driving proton transfers.
There are many examples of Asp and Glu residues that are buried in the active sites of proteins. These residues play important roles in protein functions. For photoactive yellow protein (PYP), a blue-light bacterial photoreceptor, only one out of 19 Asp and Glu residues is buried (Borgstahl et al., 1995; Xie et al., 1996). This buried residue, Glu-46, is located at the active site of PYP, and exhibits an abnormal pKa of 11 or above in the initial, receptor state (Meyer et al., 2003). Therefore, Glu-46 is protonated at neutral pH in the receptor state (pG), however, becomes deprotonated and ionized during the formation of the putative signaling state (pB) upon light activation (Brudler et al., 2001; Imamoto et al., 1997; Xie et al., 1996, 2001). Experimental evidence (Xie et al., 1996, 2001) strongly suggests that Glu-46 is essential for driving large protein conformational changes, so-called “protein quake”, during PYP receptor activation. For bacteriorhodopsin, a well-studied light-driven proton pump for solar energy transduction, four out of its 18 Asp and Glu residues are buried (Engelhard et al., 1985; Krebs and Khorana, 1993; Lanyi and Schobert, 2002; Pebay-Peyroula et al., 1997; Subramaniam and Henderson, 2000). They are Asp-85, Asp-96, Asp-115, and Asp-212 residues that are found in either the chromophore binding pocket or the proton transfer pathway. Asp-85 and Asp-212 are essential for charge stabilization of the protonated Schiff base of the retinal chromophore (Marti et al., 1992; Otto et al., 1990). Asp-85 is the proton acceptor for Schiff base deprotonation during the proton pumping photocycle (Subramaniam et al., 1992), whereas the deprotonation of Asp-96 is directly coupled to the reprotonation of the Schiff base. Mutation of Asp-96 to Asn residue results in 100-fold slowdown of the Schiff-based reprotonation process (the M2 to N transition) (Brown et al., 1998). For rhodopsin, an animal visual photoreceptor protein, Glu-134 is highly conserved and plays a central role in modulating proton uptake and receptor activation of rhodopsin (Arnis et al., 1994). Mutation of Glu-134 results in constitutive activation of rhodopsin (Acharya and Karnik, 1996), exemplifying its vital role in the structures and functions of rhodopsins. For heme-copper oxidases, redox-driven proton pumps, the conserved Glu-242 residue from mitochondrial or bacterial membrane of cytochrome bo3 plays a key role in the proton translocation mechanism (Lubben et al., 1999; Riistama et al., 1997). These examples show that there are three types of buried carboxylic groups, some remain ionized, some stay neutral, and some change their protonation states during the functional processes of proteins. In this article, we focus on developing a vibrational spectral marker for probing the hydrogen-bonding status of buried, protonated COOH groups, including those that change their protonation states during the functional processes.
Hydrogen bonding is a fundamental element in protein structure and function. The hydrogen-bond dissociation energy in proteins is in the order of 10–40 kJ/mol (2–10 kcal/mol) (Creighton, 1997; Hoppe et al., 1983; Perrin and Nielson, 1997). (Much stronger hydrogen bonds with up to 160 kJ/mol have been found in some chemical systems, particularly those with small, charged groups (Hibbert and Emsley, 1990; Perrin and Nielson, 1997; Steiner, 2002). In comparison, a typical value for protein folding energy is ∼40 kJ/mol (Honig and Yang, 1995), only about one to four times of the hydrogen-bond dissociation energy. Therefore, breaking one or more hydrogen bonds may impair the stability of a protein.
A protonated carboxylic group may form up to four hydrogen bonds with neighboring hydrogen bond donors and acceptors; the carbonyl oxygen atom of a COOH group may form a maximum of two hydrogen bonds, the hydroxyl oxygen and the hydroxyl hydrogen can each form one hydrogen bond. It is, therefore, energetically preferable for buried carboxylic groups to form as many hydrogen bonds as possible. It is challenging to monitor the hydrogen-bond number of buried, protonated Asp and/or Glu residues for functional intermediate states of proteins and for proteins for which x-ray crystal structures are not available.
Time-resolved infrared difference spectroscopy is a powerful method to probe and characterize the structural dynamics of proteins, particularly involving proton transfer (Brudler et al., 2001; Friedrich et al., 2002; Gerwert, 1999; Heberle, 2000; Xie et al., 2001). Most infrared studies on amino acid residues in proteins are carried out on Asp and Glu residues due to not only their functional importance, but also the presence of an excellent vibrational spectral marker. The C=O stretching frequency of a protonated carboxylic group is typically in the region of 1700–1775 cm−1 (see the online Supplementary Material), whereas the asymmetric and symmetric stretching frequencies of a COO− group are characteristically ∼1555 and 1410 cm−1, respectively (Barth, 2000). This large difference in the vibrational frequencies of protonated and ionized carboxylic groups allow conclusive identification of their protonation states. This method has been successfully applied to study the protonation states of functionally important carboxylic groups in both transient and steady states of proteins (Bousche et al., 1992; Braiman et al., 1988; Brown et al., 1995; Fahmy et al., 2000; Jager et al., 1994; Rothschild, 1992; Xie et al., 2001; Zscherp et al., 1999) or reaction products (Nabedryk et al., 2001).
The distribution of the C=O stretching frequency is thought to be related to the dielectric medium or hydrogen-bonding interactions of the concerned carboxylic groups in proteins (Maeda et al., 1992; Puustinen et al., 1997; Sasaki et al., 1994; Xie et al., 1996). However, it lacks quantitative studies to establish a strong and clear correlation between the C=O stretching frequency and the nature of hydrogen-bonding interactions of protonated carboxylic groups. In this article, we report that the C=O stretching frequency is a sensitive infrared structural sensor (vibrational spectral marker) for detecting and monitoring the number of hydrogen bonds of buried COOH groups. This vibrational spectral marker is established based on ab initio computational studies and is supported by experimental data. When the C=O stretching frequency is combined with the use of the O−H stretching frequency, our computational studies further demonstrate that it is possible to distinguish one type of hydrogen bond from another, such as one hydrogen bond with carboxyl oxygen from that with hydroxyl hydrogen. The applications of vibrational spectral markers are expected to enhance the power of time-resolved infrared difference spectroscopy for structural characterization of functionally important intermediate states of proteins, and consequently for understanding the functional mechanism of proteins.
METHODS
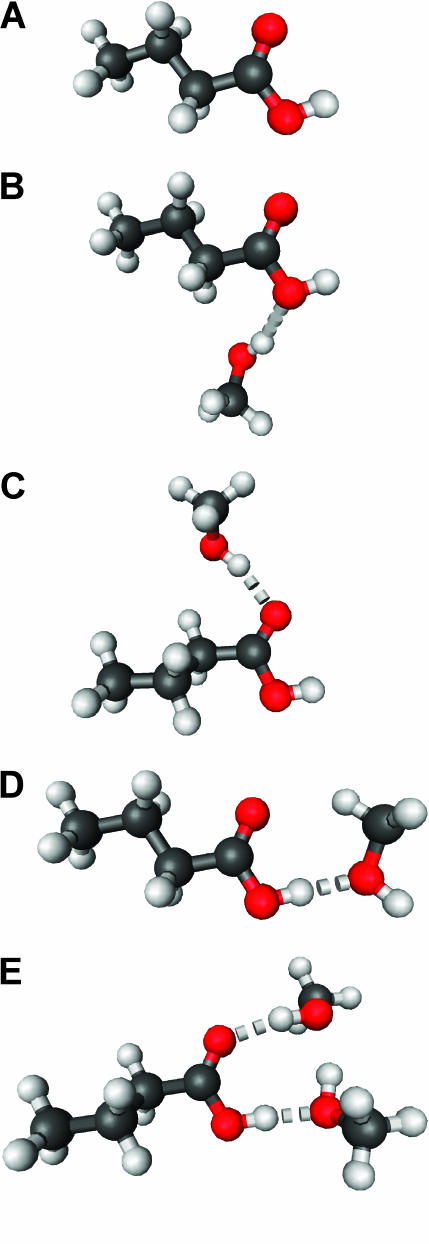
A butyric acid molecule, shown in Fig. 1 A, was employed to model the side chains of Asp and Glu residues in proteins. Methanol molecules were selected to serve as the hydrogen-bond partner for the butyric acid, based on its structural simplicity and the fact that its hydroxyl group (OH) can serve as both hydrogen-bond donor and acceptor.
FIGURE 1.
The structure of a butyric acid molecule (A) and its hydrogen-bonding interactions with 0, 1, and 2 methanol molecules. The notation, HO–C=O (B), represents that the hydroxyl oxygen atom (in bold and underlined) forms one hydrogen bond with a methanol molecule. Similarly, HO–C=O (C) and HO–C=O (D) indicate that the carbonyl oxygen atom and the hydroxyl hydrogen atom form a hydrogen bond with a methanol molecule, respectively. The notation, HO–C=O (E), denotes that both the hydroxyl hydrogen and the carbonyl oxygen atoms form a hydrogen bond with a methanol molecule.
Both energy and vibrational frequency calculations were performed using ab initio methods based on density function theory (Gaussian03; Frisch et al., 2003). Each input structure of butyric acid, with or without hydrogen bonds (Fig. 1), for Gaussian03 calculations was first generated using ChemDraw, then preliminarily optimized using Chem3D based on the semiempirical PM3 method (CambridgeSoft, Cambridge, MA). In the molecular structure specification section of Gaussian calculation (Frisch et al., 2003), the hydrogen bond between hydrogen atom (hydrogen-bond donor) and oxygen atom (hydrogen-bond acceptor) in the butyric acid-methanol complex was defined for geometry optimization involving hydrogen-bond interactions.
Calculations of energy
To calculate the hydrogen-bond dissociation energy of butyric acid with methanol, we calculated the energies of an isolated butyric acid, an isolated methanol, and a butyric acid-methanol hydrogen-bonding complex. The hydrogen-bond dissociation energy is defined as:
 |
(1) |
where BAC stands for butyric acid, and ME for methanol.
To calculate the energy, the input structure was first optimized using B3LYP/6-31G(d), and then the energy was calculated using B3LYP/6-311+G(2d,p). This method is shown to be one of the most accurate methods for energy calculation (Foresman and Frisch, 1996). The resulting output energy is in the atomic unit (au), which was converted into kJ/mol with 1 au = 2619.6 kJ/mol.
To calculate the energy profile as a function of hydrogen-bond length between butyric acid and its hydrogen-bond partner, methanol, the hydrogen-bond length was fixed at a number of values from 2.4–4.0 Å during geometry optimization. In most cases when the hydrogen-bond length was fixed, the direct geometry optimization using B3LYP/6-31G(d) did not converge. Such failure is often due to inaccurate initial force constants that are estimated at the first step, and then refined at each subsequent optimization step. By first calculating the initial force constants using HF/3-21G or HF/6-31G, we were able to optimize the butyric acid-methanol structure using B3LYP/6-31G(d) (see Supplementary Material online). Once the geometry was optimized for each fixed hydrogen-bond length, the energy was then calculated using B3LYP/6-311+G(2d,p).
Energy calculation in dielectric medium
Self-consistent reaction field methods were employed in Gaussian03 for structural optimization and energy calculations in the presence of a dielectric medium. Using self-consistent reaction fields, the solvent is modeled as a continuum of uniform dielectric constant ɛ, while the solute is placed into a cavity within the solvent. We select polarized continuum model, which defines the cavity as the union of a series of interlocking atomic spheres to calculate energies of an isolated butyric acid, an isolated methanol, or a model compound of amino acid, and a butyric acid and hydrogen-bond partner complex in various solvents (Cammi et al., 2000; Cappelli et al., 2000; Foresman and Frisch, 1996). The values of the dielectric constants for various solvents (at 293.2 K or 20°C and atmospheric pressure) were quoted from the CRC Handbook of Chemistry and Physics (78th edition) (Lide, 1997).
Calculations of vibrational frequencies
Vibrational frequency calculations were carried out in three steps. First, each structure was optimized using B3LYP/6-31G(d) method. Then all the force constants for vibrational motions were calculated, also using B3LYP/6-31G(d) method. Finally the frequencies for all the vibrational modes were computed based on normal mode analysis. Calculated vibrational frequencies are systematically higher than the experimental values. A scaling factor is recommended for each type of computational method to compensate the over-estimated force constants (Foresman and Frisch, 1996). However, as long as we use the same computational method, this scaling factor is the same for all the calculations of different molecules. For the B3LYP/6-31G(d) computational method, the recommend scaling factor is 0.9613 (Foresman and Frisch, 1996), representing ∼3.9% reduction from the calculated vibrational frequencies.
Except for those studies in specified dielectric media (Table 2), all the calculations were made in vacuum. This is due to the fact that the computational theories and methods for treating dielectric media are complicated and have not been well developed. In contrast, the computational methods for use in vacuum are far more accurate than those in dielectric media. Therefore, all the frequency calculations in this article were made in vacuum. This issue is further addressed in the discussion.
TABLE 2.
Calculated hydrogen-bond dissociation energy of a COOH group in dielectric media
| Hydrogen bond
|
Hydrogen-bond dissociation energy (kJ/mol)
|
|||||
|---|---|---|---|---|---|---|
| No. | Type | Vacuum ɛ = 1.0 | Benzene ɛ = 2.3 | Ether ɛ = 4.3 | Chlorobenzene ɛ = 5.6 | Water ɛ = 80.1 |
| 0 | HO–C=O | 0 | 0 | 0 | 0 | 0 |
| 1 | HO–C=O | 11.1 | 4.3 | −1.2 | 0.1 | −5.6 |
| 1 | HO–C=O | 18.3 | 10.2 | 3.1 | 4.6 | 1.5 |
| 1 | HO–C=O | 31.3 | 20.7 | 14.6 | 12.8 | 6.7 |
| 2 | HO–C=O | 63.7 | 38.8 | 20.4 | 24.6 | 4.7 |
Identify the number and the type of hydrogen-bond interactions from protein crystal structures
The Protein Data Bank (PDB) files for high-resolution crystal structures of proteins were obtained from the protein data bank. To determine the number and the type of hydrogen-bonding interactions for each buried carboxylic group, we first distinguished carbonyl oxygen from hydroxyl oxygen by measuring and comparing the two C–O bond lengths. The shorter bond is regarded as the carbonyl group, whereas the longer one as the hydroxyl group. Then we examined and identified all the plausible hydrogen-bond donors and/or acceptors within the hydrogen-bonding distance of a carboxylic group. Next, we checked the distance, bond angle, and dihedral angles between the potential hydrogen-bonding partners. A hydrogen bond is expected to meet all three criteria: <3.2 Å for the hydrogen-bond length, 109 ± 15° for the C–O…X angle, and 160–180° or 0–20° for the C–C–O…X dihedral angle. X stands for a heavy atom that is hydrogen bonded to a COOH group. Finally we examined the compatibility of hydrogen-bonding interaction. For example, it is impossible for a hydrogen-bond acceptor to form a hydrogen bond with another hydrogen-bond acceptor.
RESULTS AND DISCUSSION
Fig. 1 A depicts the structure of a butyric acid molecule (C3H7COOH), a model compound for the side chains of protonated Asp and Glu residues in proteins. Fig. 1, B−D, illustrate three different types of single hydrogen-bonding interaction between a butyric acid and its partner, the hydroxyl group of a methanol. Fig. 1 E displays a complex of a butyric acid and two methanol molecules. The hydrogen-bonding properties of protonated carboxylic groups were studied regarding their hydrogen-bond dissociation energy and hydrogen-bond length using density function theory based ab initio computational methods (Gaussian03). This study provides insights into the roles of Asp and Glu residues in protein structure and function. We propose a vibrational spectral marker for probing the hydrogen-bond numbers of buried COOH groups. Such a vibrational spectral marker is particularly valuable to characterize the structures and dynamics of short-lived intermediate states of proteins while in action using time-resolved infrared difference spectroscopic techniques. Our computational results are presented and discussed below.
Hydrogen-bond strength of protonated carboxylic (COOH) groups
The strength of a hydrogen bond is characterized by its hydrogen-bond dissociation energy (defined in Eq. 1). This is the energy required to completely separate a pair of hydrogen-bond donor and acceptor. The stronger a hydrogen bond is, the more energy is required to break the hydrogen bond. We first calculated and examined the hydrogen-bond dissociation energies of a protonated carboxylic group (butyric acid) for four different types of hydrogen-bonding interactions (Fig. 1, B–E). These results are summarized in Table 1. The notation, HO–C=O, represents that the hydroxyl oxygen atom is hydrogen bonded to a methanol molecule (see Fig. 1 B). Similarly, HO–C=O (Fig. 1 C) and HO–C=O (Fig. 1 D) indicate that the carbonyl oxygen atom and the hydroxyl hydrogen atom are hydrogen bonded to a methanol molecule, respectively. The notation, HO–C=O (Fig. 1 E), denotes that both the hydroxyl hydrogen and the carbonyl oxygen atoms are hydrogen bonded. It is interesting to note that the calculated hydrogen-bond strength strongly depends on the specific type of hydrogen-bonding interactions: 11.4 kJ/mol for HO–C=O, 18.5 kJ/mol for HO–C=O, and 31.3 kJ/mol for HO–C=O.
TABLE 1.
Calculated hydrogen-bonding properties of a COOH group
| No. of H-bonds | Type of H-bond | H-bond dissociation energy (kJ/mol) | H-bond length* (Å) | C=O bond length (Å) | C–O bond length (Å) | Difference in bond length† (Å) |
|---|---|---|---|---|---|---|
| 0 | HO–C=O | 0.0 | N/A | 1.211 | 1.359 | 0.148 |
| 1 | HO–C=O | 11.1 | 2.94 | 1.208 | 1.374 | 0.166 |
| 1 | HO–C=O | 18.3 | 2.87 | 1.220 | 1.351 | 0.131 |
| 1 | HO–C=O | 31.3 | 2.75 | 1.218 | 1.341 | 0.123 |
| 2 | HO–C=O | 63.7 | 2.65/2.75 | 1.228 | 1.325 | 0.097 |
The hydrogen-bond length is defined here as the distance between two heavy atoms (oxygen) from a pair of hydrogen-bond donor and acceptor. This is due to the fact that the positions of hydrogen atoms are often not resolved in protein crystal structures.
The difference in the bond length is defined as  where
where  and
and  are the bond lengths of C–O and C=O, respectively.
This result sheds light on the preferred hydrogen-bonding interaction of a protonated carboxylic group in the vicinity of a hydrogen-bond donor in proteins. Due to the small size of a hydrogen atom, the hydrogen-bonding interactions of HO–C=O and HO–C=O are sterically similar. However, they differ in hydrogen-bond strength. The HO–C=O hydrogen-bonding interaction is more stable than that of HO–C=O by 7.1 kJ/mol. This energy difference is significant compared with the thermal energy at room temperature (2.5 kJ/mol). Therefore, it is more likely for a buried COOH group to form a hydrogen bond in form of HO–C=O instead of HO–C=O. In the case that the hydrogen-bond partner of a buried, protonated carboxylic group has a hydroxyl group that can serve as either a hydrogen-bond donor or an acceptor, the HO–C=O interaction is energetically more favorable than both HO–C=O and HO–C=O interactions.
Table 1 also shows the optimized hydrogen-bond length for each type of hydrogen-bonding interactions. The hydrogen-bond length between heavy atoms increases progressively from 2.75 Å for the strongest hydrogen bond of HO–C=O, to 2.87 Å for the medium hydrogen bond of HO–C=O, to 2.94 Å for the weakest hydrogen bond of HO–C=O. In the presence of two hydrogen-bonding interactions, HO–C=O (Fig. 1 E), the hydrogen-bond length involving the carbonyl oxygen is reduced from 2.87 Å (for HO–C=O) to 2.75 Å, whereas the hydrogen-bond length involving the hydroxyl hydrogen is reduced from 2.75 Å (for HO–C=O) to 2.65 Å. These results reveal that for a given pair of hydrogen-bond partners, the stronger a hydrogen bond is, the shorter the hydrogen-bond length. Such correlation between the hydrogen-bond length and hydrogen-bond dissociation energy is consistent with previous reports (Hoppe et al., 1983; Steiner, 2002).
As shown in Table 1, the covalent bond length of C=O is slightly shorter than the C–O bond length by 0.10–0.17 Å. Such differences are often observable in high-resolution protein crystal structures (e.g., 1.50 Å or better). Note that the precision in bond length from protein x-ray crystallography is generally much better than the spatial resolution. Because the positions of hydrogen atoms are not resolved in most protein crystal structures, this small, but detectable difference between the two CO covalent bond lengths provides a practical and valuable guide to distinguish the carbonyl oxygen from the hydroxyl oxygen of a protonated carboxylic group in proteins. This approach was employed in identifying hydrogen-bonding interactions in protein crystals presented later in the article.
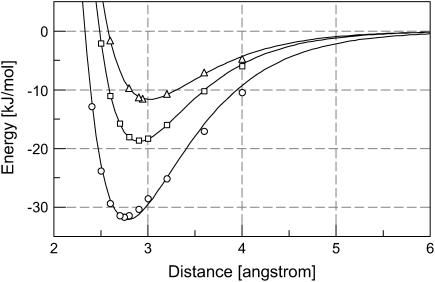
Fig. 2 shows the profiles of the calculated hydrogen-bond dissociation energy versus hydrogen-bond length. Such curves are not characterized by parabolic functions, indicating that hydrogen-bonding interactions are strongly anharmonic. Instead, the data fit well to Morse potentials,  where re is the optimal hydrogen-bond length and Ee is the hydrogen-bond dissociation energy. Due to thermal motions that allow energy fluctuation by 2.5 kJ/mol, the hydrogen-bond length is allowed to vary from 2.78 to 3.41 Å by 0.63 Å for HO–C=O, from 2.72 to 3.18 Å by 0.46 Å for HO–C=O, and from 2.63 to 3.00 Å by 0.37 Å for HO–C=O around their optimal hydrogen-bond lengths. That is, the stronger the hydrogen-bonding interaction, the smaller the structural fluctuations regarding the hydrogen-bond length.
FIGURE 2.
Hydrogen-bond dissociation energy of a protonated carboxylic group (butyric acid) interacting with a methanol molecule. The hydrogen-bond dissociation energies were calculated at selected bond lengths using B3LYP/6-311+G(2d,p) (see Methods for details) for HO–C=O (▵), HO–C=O (□), and HO–C=O (○). The curves are the results of nonlinear least-square fitting of the computational data to Morse potentials. The strongest hydrogen-bonding interaction occurs at 2.94 Å with −11.6 kJ/mol for HO–C=O, 2.87 Å with −18.8 kJ/mol for HO–C=O, and 2.75 Å with −32.1 kJ/mol for HO–C=O.
Influence of local dielectric medium on hydrogen-bond strength
The hydrogen-bond strength of a buried COOH group in proteins is sensitive to the local dielectric environment. To examine the influence of a local dielectric medium on the hydrogen-bond strength, we calculated the hydrogen-bond dissociation energy in a variety of dielectric media. The results are shown in Table 2. In benzene (C6H6), a nonpolar solvent with a dielectric constant of 2.3, the hydrogen-bond dissociation energy is 4.3 kJ/mol for HO–C=O, 10 kJ/mol for HO–C=O, and 21 kJ/mol for HO–C=O. Therefore, in benzene-like dielectric environment, the hydrogen-bonding interactions of HO–C=O are highly stable, whereas those of HO–C=O are much stronger than HO–C=O. Note that the hydrogen-bond dissociation energies of three single hydrogen-bonding interactions are reduced by different extents from vacuum to benzene: 34% for HO–C=O, 44% for HO–C=O, and 61% for HO–C=O. If the electrostatic interactions were dominant, each hydrogen-bond dissociation energy would be reduced by a factor of (ɛ − 1)/ɛ (55% for benzene), where ɛ is the dielectric constant of the solvent. The smaller reductions in the calculated hydrogen-bond dissociation energy than 55% for HO–C=O and HO–C=O in benzene indicate that the other contributions are significant, such as chemical interactions between hydrogen-bonding partners and with solvent.
In ether (C2H5–O–C2H5), a weakly polar solvent with a dielectric constant of 4.3, the hydrogen-bond dissociation energies for both HO–C=O and HO–C=O are rather small and no longer provide effective stabilization to the protein structure. However, the hydrogen bond for HO–C=O remains strong, with 14.6 kJ/mol, much larger than the thermal energy, 2.5 kJ/mol. Therefore, only the hydrogen-bonding interaction of HO–C=O is significant in ether-like dielectric medium. Similar conclusions can be made for chlorobenzene (Cl-C6H5), a polar solvent with a dielectric constant of 5.7. In water, a highly polar solvent with a dielectric constant of 80.1, all three types of hydrogen-bonding interactions are weak. In fact, the carboxylic group of Asp or Glu residue prefers to be ionized in water above pH 4. The fact that the same carboxylic group favors to be protonated below pH 4 is due to the entropic contribution prevailing over enthalpic contribution. In conclusion, our computational results show that a low dielectric interior of a protein makes the hydrogen-bonding interactions between buried groups significantly stronger than those in a high dielectric interior. Therefore, a low dielectric medium of a protein interior is favorable for the structural stability of a protein.
There is no simple answer to what is the effective, average dielectric constant inside a protein. Proteins have a nonuniform dielectric medium. The presence of external and internal water molecules makes it difficult to perform direct experimental studies. Dielectric constants of dry protein powders have been directly measured to be 2–4 (Dwyer et al., 2000). Indirect studies of hydrated proteins suggest that dielectric constants of protein interiors may be as high as 12 (Garcia-Moreno et al., 1997). Examination of protein structures and flexibility may provide reasonable insight into the effective dielectric constants of proteins. Dielectric constants are determined by two major factors: reorientation of permanent dipoles of polar groups and induced dipoles of nonpolar and polar groups (Griffiths, 1999). Dielectric constants of nonpolar solvents arise from induced dipoles. They are typically small (with 1.9 for heptane, 2.0 for cyclohexane, 2.2 for carbon tetrachloride, 2.3 for benzene, and 2.4 for toluene). Dielectric constants of polar solvents are dominated by reorientation of their permanent dipoles. They are generally much larger than those of nonpolar solvents (with 33.0 for methanol, 47.2 for dimethylsulfoxide, and 80.1 for water). Inside proteins, most buried polar groups are carbonyl and amide groups in the protein backbone. They are exceptionally difficult to be reorientated due to their limited degrees of freedom. There are a small number of buried polar groups from the side chains of polar and charged amino acid residues in proteins. These polar groups have some degrees of freedom for reorientation, but are generally much more constrained than the corresponding free molecules in solvents due to covalent linkages and steric hindrance. Therefore, buried polar groups, except for internal water molecules, have limited contributions from reorientations of their permanent dipoles to the dielectric constants of protein interiors. Based on these considerations, the dielectric constant for a protein interior on average is expected to be slightly larger than those of nonpolar solvents (e.g., ∼2.5–3.5). In the active sites of proteins where many polar groups and/or internal water molecules are found, the localized effective dielectric constant may be higher than the average dielectric constant of protein interior. However, contributions of these polar and charged groups can be treated explicitly in terms of hydrogen-bonding interactions. The effective dielectric constant of the remaining part of a protein is small.
A vibrational spectral marker for probing the hydrogen-bond number of a protonated carboxylic group
Certain vibrational modes carry specific structural information. Therefore, they can be employed to probe the structures of proteins. The vibrational band of such a mode is regarded as a vibrational spectral marker, or infrared structural sensor. For example, the C=O stretching frequency of a carboxylic group is an excellent vibrational spectral marker for detecting the protonation state of this group. When a carboxylic group is protonated, its C=O stretching frequency is typically in the spectral region of 1700–1770 cm−1 (Barth, 2000). Once it is ionized upon deprotonation, this frequency is shifted to ∼1555 and 1400 cm−1 for its asymmetric and symmetric O–C–O stretching modes, respectively (Barth, 2000). This vibrational spectral marker has been extensively used to probe the protonation status of the side chains of Asp and/or Glu residues in bacteriorhodopsin (Dioumaev, 2001; Rothschild, 1992), rhodopsin (Fahmy et al., 2000; Jager et al., 1994), photoactive yellow protein (Brudler et al., 2001; Imamoto et al., 1997; Xie et al., 1996, 2001), and other proteins (Bergo et al., 2003; Friedrich et al., 2002; Lubben et al., 1999; Nabedryk et al., 2000, 2001). Another good example is the amide I band of the protein backbone C=O stretching. The Amide I frequency is in the range of 1610–1690 cm−1, and has been extensively employed to determine the secondary structures of proteins (Barber-Armstrong et al., 2004; Hering et al., 2002; Susi et al., 1967), namely α-helices, β-sheets, turns, and random coils. Here we present a vibrational spectral marker, the C=O stretching frequency of a protonated carboxylic group (COOH), that detects the number of hydrogen-bonding interactions.
Table 3 shows the calculated frequencies of the C=O and O–H stretching modes of a protonated carboxylic group with different hydrogen-bonding interactions. With no hydrogen bond, the C=O bond is strong. Consequently the C=O stretching frequency is high, at 1776 cm−1. When one hydrogen bond is formed with either the carbonyl oxygen (HO–C=O) or the hydroxyl hydrogen (HO–C=O), the C=O stretching frequency is downshifted by ∼30–35 cm−1, to 1746 and 1741 cm−1, respectively. Because the hydrogen-bonding interaction with the hydroxyl oxygen (HO–C=O) is energetically not stable in the dielectric environment of proteins (see the discussion above), it is not expected to observe the characteristic upshift of the C=O frequency for this type of hydrogen-bonding interaction. Therefore, our calculations reveal that the characteristic vibrational frequency of a protonated carboxylic group with one hydrogen-bond interaction with methanol molecule in vacuum is in the region of 1741–1746 cm−1. When two hydrogen bonds are formed with a COOH group, with both its carbonyl oxygen and hydroxyl hydrogen (HO–C=O), the C=O stretching frequency is further downshifted by 35–40 cm−1 to 1705 cm−1. This frequency is well separated from the C=O stretching frequency for one hydrogen-bonding interaction. Therefore, the C=O stretching frequency of a protonated carboxylic group may serve as a sensitive vibrational spectral marker for probing the nature of its hydrogen-bonding interactions.
TABLE 3.
Calculated C=O and O–H stretching frequencies of a protonated carboxylic group
| No. of H-bonds | Type of H-bond | C=O frequency (cm−1) | ΔFrequency of C=O (cm−1)* | O–H Freq (cm−1) | ΔFrequency of O–H (cm−1)* |
|---|---|---|---|---|---|
| 0 | HO–C=O | 1776.4 | 0 | 3542.6 | 0 |
| 1 | HO–C=O | 1787.8 | +11.4 | 3538.2 | −4.4 |
| 1 | HO–C=O | 1740.6 | −35.8 | 3537.7 | −4.9 |
| 1 | HO–C=O | 1744.1 | −32.3 | 3213.9 | −328.7 |
| 2 | HO–C=O | 1705.5 | −70.9 | 2860.2 | −682.4 |
The shifts in the C=O and the O–H stretching frequencies are due to hydrogen-bonding interactions. A methanol molecule is employed as the hydrogen-bond partner to the COOH group.
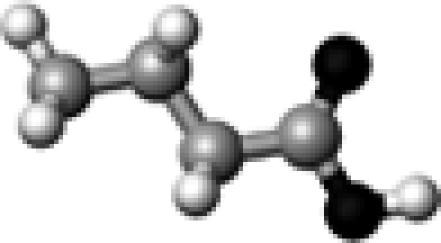
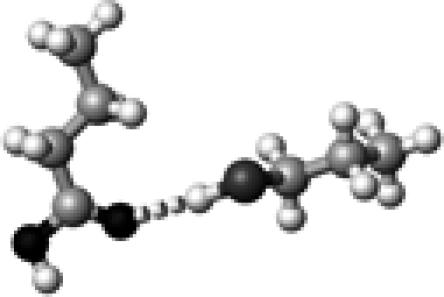
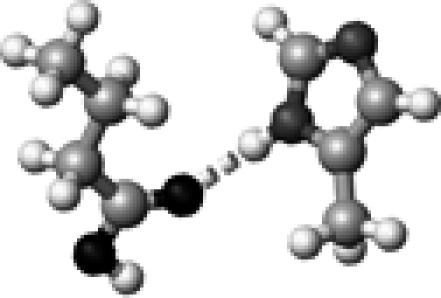
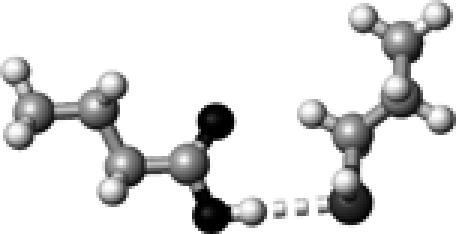
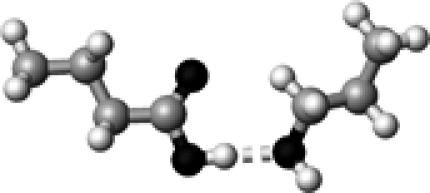
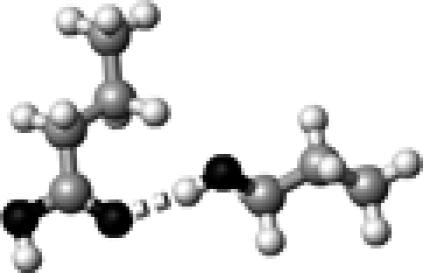
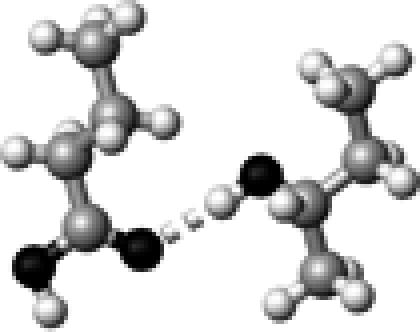
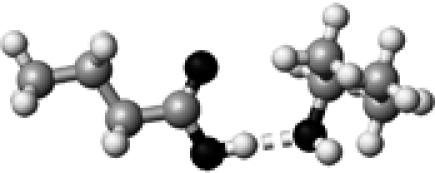
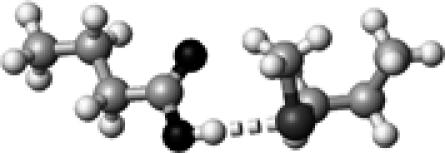
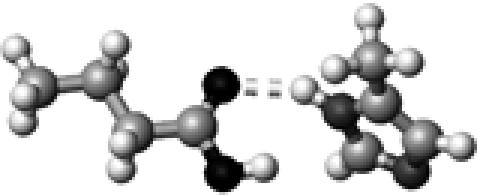
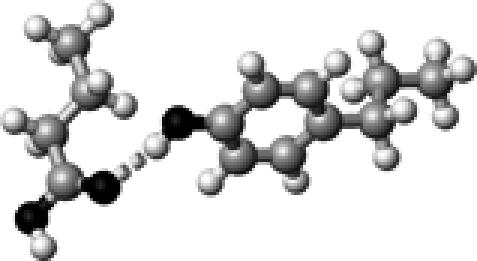
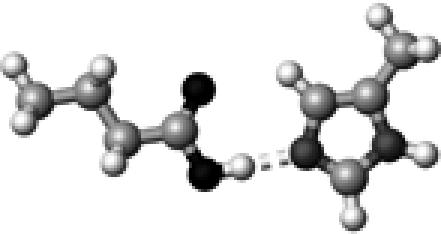
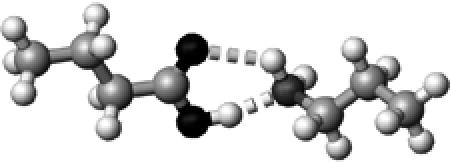
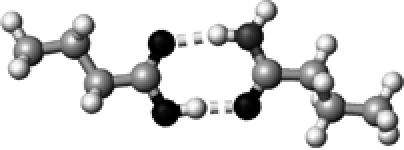
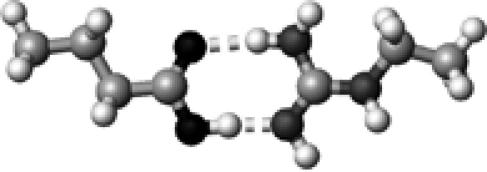
To further explore, evaluate, and determine the qualification of the C=O stretching frequency as a vibrational spectral marker, we performed a range of calculations of a protonated carboxylic group interacting with different polar and charged side-chain groups of amino acids via hydrogen bonding interactions. These side-chain groups include 10 polar side-chain groups (Ser, Thr, Cys, Met, Asn/Gln, Tyr, Asp/Glu, His, Lys, and Arg), two negatively charged side-chain groups (Tyr and Asp/Glu), and three positively charged side-chain groups (Arg, His, and Lys). Tables 4 and 5 show the computational results as well as the structures of molecules that are employed to model the different side-chain groups of polar and charged amino acids. For the convenience of discussion, we will refer to these model compounds as their corresponding amino acids.
TABLE 4.
Calculated hydrogen-bonding properties of a COOH group interacting with polar amino acid side chains
| Structure* | Amino acid* | No. of H-bond† | H-bond length† (Å) | H-bond angle† (°) | H-bond energy‡ (kJ/mol) | C=O frequency‡ (cm−1) |
|---|---|---|---|---|---|---|
 |
N/A | 0 | N/A | N/A | N/A | 1776.4 |
 |
Cys–1 | ∼0 | 3.60 | 175.8 | 5.9 | 1759.1 |
 |
His–1a | 1 | 2.99 | 174.7 | 20.3 | 1748.8 |
 |
Cys–2 | 1 | 3.37 | 175.7 | 24.8 | 1746.9 |
 |
Ser–2 | 1 | 2.75 | 177.7 | 31.9 | 1744.2 |
 |
Ser–1 | 1 | 2.89 | 171.3 | 17.6 | 1743.7 |
 |
Thr–1 | 1 | 2.90 | 172.8 | 17.4 | 1742.6 |
 |
Thr–2 | 1 | 2.75 | 176.4 | 32.2 | 1739.4 |
 |
Met | 1 | 3.30 | 174.7 | 21.2 | 1738.2 |
 |
His–1b | 1 | 2.93 | 151.8 | 21.2 | 1736.3 |
 |
Tyr–1 | 1 | 2.84 | 173.6 | 24.0 | 1736.2 |
 |
His–2 | 1 | 2.77 | 178.5 | 45.3 | 1733.4 |
 |
Lys | ∼1.5 | 2.73,2.99 | 166.3,126.5 | 44.8 | 1726.2 |
 |
Tyr | ∼1.5 | 2.77,2.72 | 154.0,145.0 | 37.5 | 1717.8 |
 |
Asn/Gln | 2 | 2.68,2.88 | 173.4,168.0 | 61.2 | 1709.9§ |
 |
Arg | 2 | 2.65,2.90 | 175.3,173.2 | 70.4 | 1704.8 |
 |
Asp/Glu | 2 | 2.69,2.69 | 178.9,179.4 | 63.7 | 1702.9§ |
The structures presented here are optimized using the B3LYP/6-31G(d) method. There are four shades of color code for atoms: the darkest for oxygen atoms, the dark gray for nitrogen and sulfur atoms, the light gray for carbon atoms, and white for hydrogen atoms. The dashed lines represent hydrogen bonds. His–1 indicates that the carbonyl oxygen of a COOH group forms a hydrogen bond, whereas His–2 designates that the hydroxyl hydrogen of a COOH group forms a hydrogen bond. The same notation is used for other amino acids.
The hydrogen-bond length is measured between the heavy atoms of a pair of hydrogen-bond donor and acceptor. When two hydrogen bonds are formed, the first value is for hydroxyl oxygen and the second value is for carbonyl oxygen.
The vibrational frequencies were calculated using the B3LYP/6-31G(d) method on optimized structures. The energy was computed using the B3LYP/6-311+G(2d,p) method.
The C=O stretching frequency was initially coupled to that of its hydrogen-bond partner in forms of asymmetric and symmetric C=O stretching of two carbonyl groups. To remove this vibrational coupling, we isotopically labeled the hydrogen-bond partner (18O=C–15N2H2 for Asn/Gln, and 18O=C–18O2H for Asp/Glu), then calculate the C=O stretching frequency of the COOH group (butyric acid).
TABLE 5.
Calculated hydrogen-bonding properties of a COOH group with positively charged amino acid side chains
| Structure* | Amino acid* | No. of H-bond† | H-bond length† (Å) | H-bond angle† (°) | H-bond energy‡ (kJ/mol) | C=O frequency‡ (cm−1) |
|---|---|---|---|---|---|---|
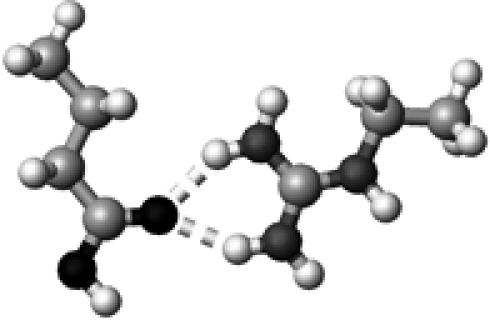 |
Arg+ | ∼1.5 | 2.86 2.89 | 148.2 146.8 | 74.2 | 1707.4 |
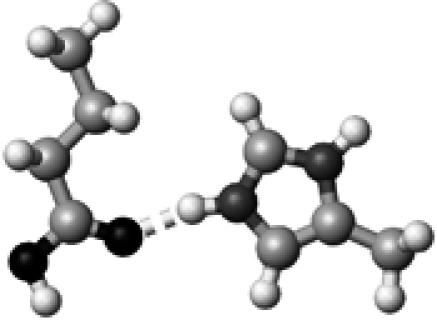 |
His+ | 1 | 2.72 | 165.5 | 70.5 | 1707.1 |
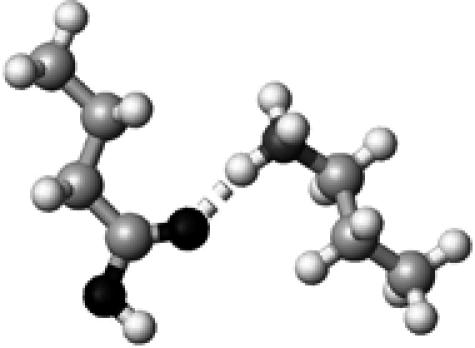 |
Lys+ | 1 | 2.72 | 166.6 | 84.8 | 1689.2 |
The color codes, the methods for frequency and energy calculations, and the definition of hydrogen-bond lengths are the same as those in Table 4.
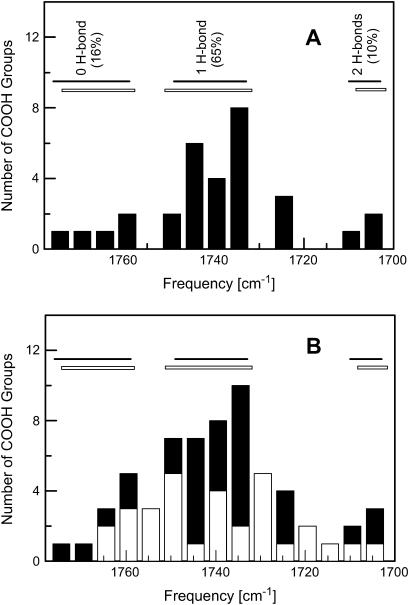
Table 4 shows the calculated hydrogen-bonding properties of a COOH group interacting with neutral, polar amino acids. A buried COOH group often forms hydrogen bond(s) with neutral polar group(s), because it is energetically unfavorable to bury charged groups in proteins. For a buried, isolated COOH group without any hydrogen-bonding interactions, the calculated C=O stretching frequency is high, at 1776 cm−1. When a COOH group forms one normal hydrogen bond with a polar side-chain group, all nine computational results consistently show that the C=O stretching frequency is largely red-shifted from 1776 to 1733–1749 cm−1. The strength of these hydrogen bonds is in the range between 17 and 45 kJ/mol. A significant part of this hydrogen-bond energy distribution is due to the fact that O=C–OH is stronger than O=C–OH by 14–24 kJ/mol. When a COOH group forms two hydrogen bonds with polar side-chain groups (Asp/Gln, Arg, or Asp/Glu; see Table 4), the C=O stretching frequency is even further red-shifted to 1703–1710 cm−1. The average hydrogen-bond strength is ∼30–35 kJ/mol per hydrogen bond. These results support the notion that the C=O stretching frequency of a COOH group is a sensitive vibrational spectral marker for probing the number of hydrogen bonds of this COOH group. Fig. 3 shows the distribution of calculated C=O stretching frequencies of COOH groups with zero, one, and two hydrogen-bonding interactions. The data show that these distributions are well separated from one another, indicating that it is possible to identify the number of hydrogen bonds of a COOH group based on its C=O stretching frequency.
FIGURE 3.
The distributions of calculated and experimental C=O stretching frequencies of a protonated carboxylic group (COOH). (A) The horizontal solid bars show the distributions of calculated C=O stretching frequencies (see Table 4) with no hydrogen-bond interaction (1759–1776 cm−1), one-hydrogen-bond interaction (1733–1749 cm−1), and two-hydrogen-bond interactions (1703–1710 cm−1). The histogram illustrates the distribution of experimental C=O stretching frequencies of 31 buried COOH groups in the steady-state structures of proteins. The horizontal open bars depict the clustered distributions of experimental C=O stretching frequencies that correlate well with computational data. (B) The histograms for experimental C=O stretching frequencies of 31 buried COOH groups in intermediate states (open columns), 31 buried COOH group in the steady states of proteins (solid columns), and the total distributions of both steady states and intermediate states (open and solid columns). The solid and open horizontal bars are the same as those in panel A. The percentage of buried hydrogen bonds were calculated based on experimental data in the frequency regions that mirror the distribution of calculated C=O stretching frequencies with known hydrogen-bond information.
The results discussed above are based on well-formed hydrogen bond(s) with neutral, polar side-chain groups. That is, the hydrogen-bond angles are optimal (170–180°, not deformed), and the hydrogen-bond strength is normal (17–45 kJ/mol, not extreme). Before we discuss experimental data on C=O stretching frequencies, we will first address three special cases. The first special case is the hydrogen-bonding interaction, Cys–1, shown in Table 4. The hydrogen-bond strength for this interaction is exceptionally weak, only 5.9 kJ/mol. This hydrogen-bond dissociation energy is less than one-fourth of the average calculated hydrogen-bond dissociation energy for single hydrogen-bonding interactions (∼26 kJ/mol) (Table 4). This is due to the fact that the sulfur atom is large so that the hydrogen bond is long and weak, and that the hydrogen bonding in the form of HO–C=O is a weaker interaction than that of HO–C=O. Therefore, this hydrogen-bonding interaction is closer to no hydrogen bond than to one hydrogen bond. Therefore, we count this interaction as no hydrogen bond. The C=O stretching frequency for Cys–1 is 1759 cm−1. We thus classify the C=O frequency distribution of a COOH group with no hydrogen bond as from 1759 to 1776 cm−1.
The second special case is dealing with two deformed hydrogen bonds. When a COOH group forms two hydrogen bonds with either a neutral Lys or a neutral Tyr group as illustrated in Table 4, these two hydrogen bonds are deformed due to geometrical constraints. Their hydrogen-bond angles are 126°/166° for Lys and 145°/155° for Tyr, largely deviated from the optimal hydrogen-bond angle of 170–180°. Such deformations lead to significantly reduced hydrogen-bond dissociation energy, ∼49 kJ/mol. In comparison, the hydrogen-bond dissociation energy is on average 65 kJ/mol for two well-formed hydrogen-bond interactions (Table 4), equivalent to 32.5 kJ/mol per hydrogen bond. The hydrogen-bond dissociation energy for two deformed hydrogen bonds, 49 kJ/mol, is 1.5 × 32.5 kJ/mol. Therefore, for the calibration of this vibrational spectral marker, we classify two such deformed hydrogen bonds (Lys and Tyr) as forming 1.5 hydrogen bonds. The C=O stretching frequency for these deformed hydrogen-bonding interactions is 1718 cm−1 for Lys and 1726 cm−1 for Tyr, lying between those C=O stretching frequencies for one and two hydrogen-bonding interactions.
The third special case is that a COOH group forms hydrogen bond(s) with a charged side-chain group. Most charged groups in proteins are solvent exposed. However, buried charged groups have been found in the active sites of proteins. Therefore, we examined the hydrogen-bonding interactions of a buried COOH group with positively charged side chains (Arg+, Lys+, and His+) and with negatively charged side chains (COO− of Asp/Glu or a negatively charged phenolic oxygen of Tyr−).
In the case that a COOH group forms a hydrogen bond with a positively charged side chain of His or Lys (His+ or Lys+ in Table 5), the strength of such a hydrogen bond is very strong, 71–85 kJ/mol. This is approximately three times as strong as the average hydrogen-bond strength of a COOH group interacting with one polar hydrogen-bonding partner, ∼26 kJ/mol per hydrogen bond. When a COOH group is hydrogen bonded to a positively charged side chain of Arg, two deformed hydrogen bonds are formed with the carbonyl oxygen. The hydrogen-bond dissociation energy for these two deformed bonds is 74.2 kJ/mol (Table 5), similar to that of single hydrogen-bonding interactions. Because positively charged side chains do not have hydrogen-bond acceptors, no hydrogen bond is formed with the hydroxyl hydrogen of a COOH group. The C=O stretching frequency is 1707 cm−1 for hydrogen-bonding interactions with Arg+ and His+, and further red-shifted to 1689 cm−1 for the hydrogen-bonding interaction with Lys+. Therefore, a low C=O stretching frequency (1703–1710 cm−1) is an indication of either two hydrogen bonds with neutral, polar side-chain groups or hydrogen-bonding interaction with a positively charged group. Alternatively speaking, a low C=O stretching frequency (1703–1710 cm−1) indicates strong hydrogen-bond interactions with 61–74 kJ/mol with either neutral or positively charged side-chain groups.
In the case that the hydrogen-bond partner is negatively charged (Asp/Glu− or Tyr−), all our calculations lead to proton movements. Starting from an initial structure for a hydrogen-bonding interaction between a COOH and a COO− group, we found that the labile proton is moved and equally shared by two carboxylic groups after structural optimization. Similarly, starting from an initial structure for a hydrogen-bonding interaction between a COOH group and a negative charged phenolic group of Tyr−, the labile proton moves from the COOH group to the phenolic group after structural optimization. These results suggest that an isolated hydrogen-bonding interaction between a COOH group and a negatively charged side-chain group is energetically unstable; additional interactions must be present to stabilize any hydrogen-bonding interaction between a COOH group and a negatively charged side-chain group in proteins.
Experimental evidence for a vibrational spectral marker
To establish the C=O stretching frequency as a vibrational spectral marker for probing the numbers of hydrogen bonds of buried COOH groups, it is imperative to examine the related experimental evidence. We have carefully searched for proteins for which steady-state structures have been studied using both high-resolution x-ray crystallography and infrared spectroscopy. The results from literature studies and crystal structure analysis are summarized in Table 6. Most of the buried COOH groups form one hydrogen bond. The corresponding C=O stretching frequency is in the range of 1734–1748 cm−1. This frequency distribution agrees extremely well with our computational results, 1733–1749 cm−1, as shown in Table 4. Only one case is found for a buried COOH group to form no hydrogen bond, one case with two hydrogen bonds. Their C=O stretching frequencies are 1767 and 1708 cm−1, respectively. These data agree well with our computational results of 1759–1776 cm−1 for forming no hydrogen bond and 1703–1710 cm−1 for forming two hydrogen bonds (Table 4).
TABLE 6.
Correlations between the C=O stretching frequency and the hydrogen-bond number of buried COOH groups in proteins
| No. of H-bonds | IR frequency λ (cm−1) | Protein* | COOH group of | Type of H-bonds | H-bond length (Å) | PDB code | Resolution |
|---|---|---|---|---|---|---|---|
| 0 | 1767[1] | Rhodopsin | D83 | – | N/A | 1L9H[2] | 2.60 Å |
| 1748[3] | CcO (B. H., oxidized) | E242 | HO–C=O | 3.14/3.22† | 1V54[4] | 1.80 Å | |
| 1746[3] | CcO (R. S., oxidized) | E286 | HO–C=O | 2.44/2.63† | 1M56[5] | 2.30 Å | |
| 1743[3] | CcO (B. H., reduced) | E242 | HO–C=O | 3.25 | 1V55[4] | 1.90 Å | |
| 1 | 1743[6] | Halorhodopsin | D141 | HO–C=O | 2.55 | 1E12[7] | 1.80 Å |
| 1742[8] | Bacteriorhodopsin | D96 | HO–C=O | 2.79 | 1MOM[9] | 1.43 Å | |
| 1737[10] | PYP | E46 | HO–C=O | 2.58 | 1NWZ[11] | 0.82 Å | |
| 1735[12] | Rhodopsin | E134 | HO–C=O | 2.53/2.51† | 1L9H[2] | 2.60 Å | |
| 1735[13] | Reaction center | E104 | HO–C=O | 2.78 | 1M3X[14] | 2.55 Å | |
| 1734[8] | Bacteriorhodopsin | D115 | HO–C=O | 2.88 | 1MOM[9] | 1.43 Å | |
| 1734[1] | Rhodopsin | E122 | HO–C=O | 2.94/2.68† | 1L9H[2] | 2.60 Å | |
| 2 | 1708[15] | CcO (T. T., oxidized) | Heme a3 propionate | HO–C=O | 2.51 | 1EHK[16] | 2.4 Å |
| HO–C=O | 2.67 |
Abbreviations for proteins are: CcO for cytochrome c oxidase in bovine heart (B. H.), Rhodobacter sphaeroides (R. S.), and Thermus thermophilus (T. T.); and PYP for photoactive yellow protein. References are quoted in numbers: [1] (Fahmy et al., 1993); [2] (Okada et al., 2002); [3] (Schmidt et al., 2004); [4] (Tsukihara et al., 2003); [5] (Svensson-Ek et al., 2002); [6] (Hutson et al., 2001); [7] (Kolbe et al., 2000); [8] (Sasaki et al., 1994); [9] (Lanyi and Schobert, 2002); [10] (Xie et al., 1996); [11] (Getzoff et al., 2003); [12] (DeLange et al., 1999); [13] (Breton et al., 1997); [14] (Camara-Artigas et al., 2002); [15] (Koutsoupakis et al., 2004); [16] (Soulimane et al., 2000).
These are the two hydrogen-bond lengths corresponding to two structures of the same protein in the same state from one PDB data.
Comparisons of experimental studies using x-ray crystallography and infrared spectroscopy on intermediate states are not included in Table 6 due to the following reasons. First, there are only a few proteins that have been studied using both time-resolved or cold-trapped x-ray crystallography and time-resolved infrared spectroscopy techniques. Second, the experimental conditions for x-ray crystallography and infrared spectroscopy are often very different in temperature, with x-ray crystallography performed at much lower temperatures. If internal water molecules are involved in hydrogen-bonding interaction, the internal water molecules may relocate in proteins as temperature changes. Therefore, it is difficult to make direct, reliable comparison. Third, the structural dynamics of proteins in crystals can be very different from those in solution state. Time-resolved infrared studies of PYP in crystalline and solution states made in our lab show that the crystallization of PYP altered the proton transfer pathway and suppressed large protein conformational changes (Xie et al., 2001). The active site Glu-46 is ionized in the solution upon chromophore protonation, but remains protonated in the crystalline state.
More time-resolved or cold-trapped infrared spectroscopic studies on the intermediate states of proteins have been made than those using x-ray crystallographic studies. Fig. 3 A shows the histogram of the C=O stretching frequencies of all 31 buried COOH groups in the steady states of 25 different proteins that we found from the literature (see Supplementary Material for detailed information). The distributions of these C=O stretching frequencies form four clusters, three of them shown as horizontal open bars, overlap remarkably well with the distributions of calculated C=O stretching frequencies with zero, one, and two hydrogen bonds (horizontal solid bars). Experimental C=O stretching frequencies ∼1725 cm−1 overlap well with the C=O frequency distribution (1718–1726 cm−1) of two deformed hydrogen-bonding interactions from our computational data (Table 4). Such good general agreements as well as the data in Table 6 support the assignment of the C=O frequency as the vibrational spectral marker for probing the hydrogen-bond numbers of buried COOH groups.
Fig. 3 B shows the histogram of the C=O stretching frequency of 31 buried COOH groups in the intermediate states of proteins (open columns) from our extensive literature search. It is striking that the C=O stretching frequencies of these intermediate states are continuously distributed from 1706 to 1765 cm−1. There are no clear gaps in the C=O stretching frequency distribution as observed from steady states of proteins. One plausible interpretation for this observation is that in the transient states more deformed hydrogen bonds (in forms of hydrogen-bond angle and/or hydrogen-bond length) are formed so that the C=O stretching frequencies are higher than those of corresponding normal hydrogen-bonding interactions.
All vibrational frequency calculations presented in this article were made in vacuum. This is due to the fact that the theories and methods for treating dielectric media are complex and have not been well developed. We have calculated the C=O stretching frequencies of COOH groups in 19 different dielectric media using Gaussian98 (Nie, 2002) and Gaussian03 (B. Nie, J. Stutzman, and A. Xie, unpublished data). We found that the C=O stretching frequencies calculated using Gaussian98 and Gaussian 03 are very different, neither of them agree with experimental data. However, we found that if we treat the solvent explicitly in the form of hydrogen-bonding interactions between a COOH group and a solvent molecule, the C=O stretching frequency calculated in vacuum shows an excellent agreement with experimental data. For instance, the calculated C=O stretching frequency of a COOH group (of a butyric acid) that is hydrogen bonded to a chloride atom of a dichloromethane molecule (between the CCl of dichloromethane and the OH of butyric acid) is 1748.9 cm−1. In comparison, the experimentally measured C=O stretching frequency in dichloromethane (ɛ = 8.93) is 1750 cm−1 (Dioumaev and Braiman, 1995). Similarly our calculated C=O stretching frequency of a COOH group hydrogen bonded to the nitrogen atom of an acetonitrile molecule (between the CN of an acetonitrile and the OH of butyric acid) in vacuum is 1743.5 cm−1. This value agrees extremely well with the experimentally measured C=O stretching frequency, 1743 cm−1, of COOH model compounds in the acetonitrile solvent (ɛ = 36.6) (Lascombe et al., 1962). These comparisons and good agreements between calculated and measured C=O stretching frequencies show that the C=O stretching frequency calculations in vacuum are accurate and reliable when solute-solvent interactions are treated explicitly in the form of hydrogen-bonding interactions. Furthermore, these agreements support the notion that the calculated C=O stretching frequencies of COOH groups in vacuum when hydrogen-bonding interactions are treated explicitly can be applied directly to buried COOH groups in proteins, because the average, effective dielectric constant of protein interior is smaller than that of dichloromethane and acetonitrile.
It should be stressed that the vibrational spectral marker that is proposed in this article is for use to probe buried COOH groups in proteins. It is not proper to generalize this spectral marker for a COOH group interacting with any nonbiological molecules. Due to extreme chemical properties of some nonbiological molecules, the C=O stretching frequency of a COOH group may be shifted out of our specified regions.
A linear correlation between the C=O stretching frequency and the hydrogen-bonding strength
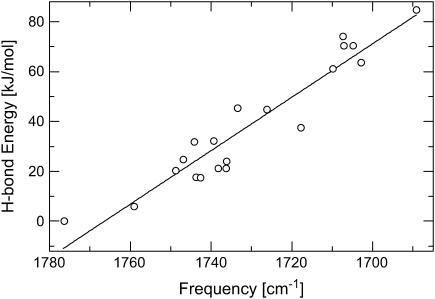
The data in Tables 4 and 5 show a general trend that the stronger the hydrogen-bonding interactions, the larger the red shift in the C=O stretching frequency. These data are shown in Fig. 4. A nonlinear least-square fit of the data yields the following linear relation between the hydrogen-bond dissociation energy,  and the C=O stretching frequency,
  :
:
 |
(2) |
where the unit of vibrational frequency is cm−1, and the unit of energy is kJ/mol. The root mean square deviation of the fitting is 7.5 kJ/mol. This deviation is much smaller than the distribution of the hydrogen-bond dissociation energies that is in the range between 0 and 85 kJ/mol (see Tables 4 and 5). Therefore, our computational data demonstrate that the C=O stretching frequency is a vibrational spectral marker for probing the approximate hydrogen-bond strength of a protonated carboxylic group in proteins.
FIGURE 4.
A correlation between the calculated hydrogen-bond dissociation energies and the calculated C=O stretching frequencies of a COOH group with neutral and positively charged side-chain groups of amino acids (data shown in Tables 4 and 5). The calculated data are shown in open circles, whereas a linear straight line is the result of nonlinear least-square fitting. The root mean square deviation of the fitting is 7.49 kJ/mol, resulting in  with energy in unit of kJ/mol.
It should be pointed out that a large part of the root mean square deviation from above fitting is due to the differences in the hydrogen-bond strength between the HO–C=O and HO–C=O forms of hydrogen-bonding interaction. The calculated data shown in Tables 3 and 4 demonstrate that the hydrogen-bond dissociation energy for HO–C=O is consistently lower than that for HO–C=O by 15–24 kJ/mol between the same pair of hydrogen-bond partners, such as Thr–1 versus Thr–2, or His–1 versus His–2. Therefore, if we distinguish HO–C=O from HO–C=O, the root mean square deviation from the nonlinear least-square fitting is expected to be much smaller than 7.5 kJ/mol.
Vibrational spectral markers for two-dimensional infrared spectroscopy
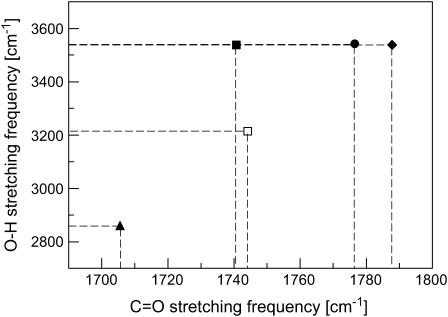
As shown in Table 3, the O—H stretching frequency is also sensitive to hydrogen-bonding interactions of a protonated carboxylic group. However, this correlation between the O—H stretching frequency and specific hydrogen-bonding interactions is different from that of the C=O stretching frequency. When both O—H and C=O stretching frequencies are used in a two-dimensional (2D) plot (see Fig. 5), each data point represents one type of hydrogen-bonding interaction. All five data points are separated by either C=O stretching or O—H stretching or both in this 2D plot. That means, with such a 2D plot, it is possible to detect not only the number of hydrogen-bonding interactions, but also the specific type of hydrogen-bonding interactions.
FIGURE 5.
A 2D frequency distribution of the O–H and C=O stretching modes for probing the specific type of hydrogen-bonding interactions in proteins: HO–C=O (•), HO–C=O (♦), HO–C=O (▪), HO–C=O (□), and HO–C=O (▴). The data are shown in Table 3.
The O—H stretching frequency is understudied. Partly this is due to the fact that strong O—H absorption from solvent absorption overlaps with the O—H stretching modes from the COOH side-chain groups. Some good experiments have been made and reported in this frequency region, in particular the studies on the structural dynamics of buried structural water molecules (Maeda, 2001; Maeda et al., 2003). In principle, this frequency range can provide valuable structural information for amino acid side chains as well. The use of hydrated protein films as samples greatly reduces solvent contribution to the infrared absorption in this region. Isotopic labeling helps to identify specific molecular groups under study.
The power of a vibrational spectral marker for structure-function studies of photoactive yellow protein
The ultimate goal of establishing vibrational spectral markers is to apply them to probe and characterize protein structures, in particular those of transient states during protein functions. Fourier transform difference infrared spectroscopy is a powerful method for monitoring structural developments of proteins while in action for studies of protein structure-function relationships. Vibrational spectral markers are essential to translate infrared spectral information into protein structural characterization.
For instance, the first infrared spectroscopic study of photoactive yellow protein (Xie et al., 1996) shows that the C=O stretching frequency of Glu-46 at the active site is shifted from 1740 to 1732 cm−1 upon chromophore photoisomerization at 100 K. The crystal structure of PYP in the receptor state (pG) reveals that Glu-46 forms one hydrogen bond with the negatively charged phenolic oxygen of the chromophore before photoisomerization. However, there was no x-ray structure for the cold-trapped photoproduct of PYP at that time. The infrared data (Xie et al., 1996) unambiguously show that the Glu-46 remains hydrogen bonded after photoisomerization. This structural information was crucial to propose, test, and confirm a new chromophore structure for the photoisomerization product of PYP. This significantly different photoisomerization mechanism has direct implications to the subsequent structural dynamics of PYP during receptor activation. This example demonstrates the power of infrared spectroscopic techniques when they are combined with vibrational spectral markers for the study of protein structure-function relationships.
Furthermore, the use of this vibrational spectral marker, the C=O stretching frequency of Glu-46 allow us to make two predictions: i), the existence of a presignaling state (pB'), and ii), the ionized Glu-46 in pB' as an electrostatic epicenter for protein quake as a mechanism for PYP receptor activation. Later, by using four vibrational spectral markers (Xie et al., 2001), including the C=O stretching band of Glu-46 combined with time-resolved step-scan Fourier transform infrared spectroscopy, we unambiguously proved that indeed there exists a presignaling state pB' with predicted structural characteristics. At the same time, the study provided strong supporting evidence that the COO− group of Glu-46 in the pB' state serves as an electrostatic epicenter for protein quake and receptor activation. In conclusion, vibrational spectral markers paved the way for the infrared difference spectroscopy to reach its utmost power in extracting and revealing structural information of not only the steady state of proteins, but more importantly of the short-lived functional intermediates of proteins.
CONCLUSIONS
Our computational studies on the hydrogen-bonding properties of a buried COOH group show that the hydrogen-bonding interaction with the hydroxyl hydrogen atom as the hydrogen-bond donor, HO–C=O, is the strongest among three different types of one-hydrogen-bond interactions (Table 1). This hydrogen-bonding interaction remains strong in a range of dielectric media (Table 2) with dielectric constants of from 1 (vacuum) to 5.6 (chlorobenzene). The hydrogen-bonding interaction with the carbonyl oxygen atom as the hydrogen-bond donor, HO–C=O, is significantly stronger than that of HO–C=O. Therefore, this interaction, HO–C=O, dominates the hydrogen-bonding interaction in presence of a hydrogen-bond donor in the vicinity. This hydrogen-bond dissociation energy is large in the dielectric medium of benzene with a dielectric constant of 2.2, but is small in the dielectric medium of ether with a dielectric constant of 4.3 or higher. We conclude that low dielectric protein interiors make the hydrogen-bonding interactions stronger and more stable than high dielectric interiors.
Our density function theory based ab initio computational studies reveal a strong correlation between the C=O stretching frequency and the hydrogen-bond number of COOH groups that are hydrogen bonded to polar groups of amino acid side chains (Table 4). This correlation is further supported by available experimental evidence from 12 buried COOH groups in the steady states of eight different proteins (Table 6), infrared vibrational frequencies of buried Asp and Glu residues in proteins and their hydrogen-bonding interactions based on the protein crystal structures. We provided both computational and experimental evidence that support the establishment of the C=O stretching frequency of buried COOH groups as a vibrational spectral marker for probing the hydrogen-bond number (Fig. 3): ∼1759–1776 cm−1 for zero, 1733–1749 cm−1 for one, and 1703–1710 cm−1 for two hydrogen-bonding interactions. This correlation is valid when the hydrogen-bond partners are polar side-chain groups of amino acids, but not valid when the hydrogen-bond partners are positively charged (Table 5). In this case, it is better to apply an approximate linear correlation between the C=O stretching frequency and the net hydrogen-bond strength (Fig. 4):  This correlation applies to both polar and positively charged side chains as hydrogen-bond partners over a broad distribution of the C=O stretching frequency (1689–1776 cm−1). Furthermore, we proposed that a two-dimensional infrared spectroscopy, C=O stretching versus O–H stretching, may identify the specific type of hydrogen-bonding interaction (Fig. 5). This vibrational spectral marker for hydrogen-bonding interaction is expected to enhance the power of time-resolved Fourier transform infrared spectroscopy in characterizing the structures of functionally important intermediate states of proteins and in elucidating the functional mechanism of proteins.
SUPPLEMENTARY MATERIAL
An online supplement to this article can be found by visiting BJ Online at http://www.biophysj.org.
Supplementary Material
Acknowledgments
This work was supported by grants from Oklahoma Center for the Advancement of Science and Technology and Office of Naval Research. J.S. is partly supported by a Research Experience for Undergraduates grant from National Science Foundation.
References
- Acharya, S., and S. S. Karnik. 1996. Modulation of GDP release from transducin by the conserved Glu134-Arg135 sequence in rhodopsin. J. Biol. Chem. 271:25406–25411. [DOI] [PubMed] [Google Scholar]
- Arnis, S., K. Fahmy, K. P. Hofmann, and T. P. Sakmar. 1994. A conserved carboxylic acid group mediates light-dependent proton uptake and signaling by rhodopsin. J. Biol. Chem. 269:23879–23881. [PubMed] [Google Scholar]
- Barber-Armstrong, W., T. Donaldson, H. Wijesooriya, R. A. Silva, and S. M. Decatur. 2004. Empirical relationships between isotope-edited IR spectra and helix geometry in model peptides. J. Am. Chem. Soc. 126:2339–2345. [DOI] [PubMed] [Google Scholar]
- Barth, A. 2000. The infrared absorption of amino acid side chains. Prog. Biophys. Mol. Bio. 74:141–173. [DOI] [PubMed] [Google Scholar]
- Bergo, V., E. N. Spudich, J. Spudich, and K. J. Rothschild. 2003. Conformational changes detected in a sensory rhodopsin II-transducer complex. J. Biol. Chem. 278:36556–36562. [DOI] [PubMed] [Google Scholar]
- Borgstahl, G. E., D. R. Williams, and E. D. Getzoff. 1995. 1.4 A structure of photoactive yellow protein, a cytosolic photoreceptor: unusual fold, active site, and chromophore. Biochemistry. 34:6278–6287. [DOI] [PubMed] [Google Scholar]
- Bousche, O., S. Sonar, M. P. Krebs, H. G. Khorana, and K. J. Rothschild. 1992. Time-resolved Fourier transform infrared spectroscopy of the bacteriorhodopsin mutant Tyr-185→Phe: Asp-96 reprotonates during O formation; Asp-85 and Asp-212 deprotonate during O decay. Photochem. Photobiol. 56:1085–1095. [DOI] [PubMed] [Google Scholar]
- Braiman, M. S., T. Mogi, T. Marti, L. J. Stern, H. G. Khorana, and K. J. Rothschild. 1988. Vibrational spectroscopy of bacteriorhodopsin mutants: light-driven proton transport involves protonation charges of aspartic acid residues 85, 96, and 212. Biochemistry. 27:8516–8520. [DOI] [PubMed] [Google Scholar]
- Breton, J., E. Nabedryk, J. P. Allen, and J. C. Williams. 1997. Electrostatic influence of QA reduction on the IR vibrational mode of the 10a-ester C==O of HA demonstrated by mutations at residues Glu L104 and Trp L100 in reaction centers from Rhodobacter sphaeroides. Biochemistry. 36:4515–4525. [DOI] [PubMed] [Google Scholar]
- Brown, L. S., A. K. Dioumaev, R. Needleman, and J. K. Lanyi. 1998. Local-access model for proton transfer in bacteriorhodopsin. Biochemistry. 37:3982–3993. [DOI] [PubMed] [Google Scholar]
- Brown, L. S., J. Sasaki, H. Kandori, A. Maeda, R. Needleman, and J. K. Lanyi. 1995. Glutamic acid 204 is the terminal proton release group at the extracellular surface of bacteriorhodopsin. J. Biol. Chem. 270:27122–27126. [DOI] [PubMed] [Google Scholar]
- Brudler, R., R. Rammelsberg, T. T. Woo, E. D. Getzoff, and K. Gerwert. 2001. Structure of the I1 early intermediate of photoactive yellow protein by FTIR spectroscopy. Nat. Struct. Biol. 8:265–270. [DOI] [PubMed] [Google Scholar]
- Camara-Artigas, A., D. Brune, and J. P. Allen. 2002. Interactions between lipids and bacterial reaction centers determined by protein crystallography. Proc. Natl. Acad. Sci. USA. 99:11055–11060. [DOI] [PMC free article] [PubMed] [Google Scholar]
- Cammi, R., C. Cappelli, S. Corni, and J. Tomasi. 2000. On the calculation of infrared intensities in solution within the polarizable continuum model. J. Phys. Chem. 104:9874–9879. [Google Scholar]
- Cappelli, C., S. Corni, R. Cammi, B. Mennucci, and J. Tomasi. 2000. Nonequilibrium formulation of infrared frequencies and intensities in solution: analytical evaluation within the polarizable continuum model. J. Chem. Phys. 113:11270–11279. [Google Scholar]
- Creighton, T. E. 1997. Protein Structures and Molecular Properties. W. H. Freeman and Company, New York.
- DeLange, F., P. H. M. Bovee-Geurts, A. M. A. Pistorius, K. J. Rothschild, and W. J. DeGrip. 1999. Probing intramolecular orientations in rhodopsin and metarhodopsin II by polarized infrared difference spectroscopy. Biochemistry. 38:13200–13209. [DOI] [PubMed] [Google Scholar]
- Dioumaev, A. K. 2001. Infrared methods for monitoring the protonation state of carboxylic amino acids in the photocycle of bacteriorhodopsin. Biochemistry (Mosc.). 66:1269–1276. [DOI] [PubMed] [Google Scholar]
- Dioumaev, A. K., and M. S. Braiman. 1995. Modeling vibrational spectra of amino acid side chains in proteins: the carbonyl stretch frequency of buried carboxylic residues. J. Am. Chem. Soc. 117:10572–10574. [Google Scholar]
- Dwyer, J., A. G. Gittis, D. Karp, E. Lattman, D. S. Spencer, W. Stites, and B. Garcia-Moreno. 2000. High apparent dielectric constants in the interior of a protein reflect water penetration. Biophys. J. 79:1610–1620. [DOI] [PMC free article] [PubMed] [Google Scholar]
- Engelhard, M., K. Gerwert, B. Hess, W. Kreutz, and F. Siebert. 1985. Light-driven protonation changes of internal aspartic acids of bacteriorhodopsin: an investigation by static and time-resolved infrared difference spectroscopy using [4–13C] aspartic acid labeled purple membrane. Biochemistry. 24:400–407. [DOI] [PubMed] [Google Scholar]
- Fahmy, K., F. Jager, M. Beck, T. A. Zvyaga, T. P. Sakmar, and F. Siebert. 1993. Protonation states of membrane-embedded carboxylic acid groups in rhodopsin and metarhodopsin II: a Fourier-transform infrared spectroscopy study of site-directed mutants. Proc. Natl. Acad. Sci. USA. 90:10206–10210. [DOI] [PMC free article] [PubMed] [Google Scholar]
- Fahmy, K., T. P. Sakmar, and F. Siebert. 2000. Transducin-dependent protonation of glutamic acid 134 in rhodopsin. Biochemistry. 39:10607–10612. [DOI] [PubMed] [Google Scholar]
- Foresman, J. B., and Æ. Frisch. 1996. Exploring Chemistry with Electronic Structure Methods. Gaussian, Pittsburgh, PA.
- Friedrich, T., S. Geibel, R. Kalmbach, I. Chizhov, K. Ataka, J. Heberle, M. Engelhard, and E. Bamberg. 2002. Proteorhodopsin is a light-driven proton pump with variable vectoriality. J. Mol. Biol. 321:821–838. [DOI] [PubMed] [Google Scholar]
- Frisch, M. J., G. W. Trucks, H. B. Schlegel, G. E. Scuseria, M. A. Robb, J. R. Cheeseman, J. A. Montgomery, J. Vreven, K. N. Kudin, J. C. Burant, J. M. Milliam, S. S. Iyengar, et al. 2003. Gaussian03, Revision A.1. Gaussian, Pittsburgh, PA.
- Garcia-Moreno, B. E., J. J. Dwyer, A. G. Gittis, E. E. Lattman, D. S. Spencer, and W. E. Stites. 1997. Experimental measurement of the effective dielectric in the hydrophobic core of a protein. Biophys. Chem. 64:211–224. [DOI] [PubMed] [Google Scholar]
- Gerwert, K. 1999. Molecular reaction mechanisms of proteins monitored by time-resolved FTIR-spectroscopy. Biol. Chem. 380:931–935. [DOI] [PubMed] [Google Scholar]
- Getzoff, E. D., K. N. Gutwin, and U. K. Genick. 2003. Anticipatory active-site motions and chromophore distortion prime photoreceptor PYP for light activation. Nat. Struct. Biol. 10:663–668. [DOI] [PubMed] [Google Scholar]
- Griffiths, D. J. 1999. Introduction to Electrodynamics. Prentice-Hall, Saddle River, NJ.
- Heberle, J. 2000. Proton transfer reactions across bacteriorhodopsin and along the membrane. Biochim. Biophys. Acta. 1458:135–147. [DOI] [PubMed] [Google Scholar]
- Hering, J. A., P. R. Innocent, and P. I. Haris. 2002. Automatic amide I frequency selection for rapid quantification of protein secondary structure from Fourier transform infrared spectra of proteins. Proteomics. 2:839–849. [DOI] [PubMed] [Google Scholar]
- Hibbert, F., and J. Emsley. 1990. Hydrogen bonding and chemical reactivity. Adv. Phys. Org. Chem. 26:255–379. [Google Scholar]
- Honig, B., and A. S. Yang. 1995. Free energy balance in protein folding. Adv. Protein Chem. 46:27–58. [DOI] [PubMed] [Google Scholar]
- Hoppe, W., W. Lohmann, H. Markl, and H. Ziegler. 1983. Biophysics. Springer-Verlag, New York.
- Hutson, M. S., S. V. Shilov, R. Krebs, and M. S. Braiman. 2001. Halide dependence of the halorhodopsin photocycle as measured by time-resolved infrared spectra. Biophys. J. 80:1452–1465. [DOI] [PMC free article] [PubMed] [Google Scholar]
- Imamoto, Y., K. Mihara, O. Hisatomi, M. Kataoka, F. Tokunaga, N. Bojkova, and K. Yoshihara. 1997. Evidence for proton transfer from Glu-46 to the chromophore during the photocycle of photoactive yellow protein. J. Biol. Chem. 272:12905–12908. [DOI] [PubMed] [Google Scholar]
- Jager, F., K. Fahmy, T. P. Sakmar, and F. Siebert. 1994. Identification of glutamic acid 113 as the Schiff base proton acceptor in the metarhodopsin II photointermediate of rhodopsin. Biochemistry. 33:10878–10882. [DOI] [PubMed] [Google Scholar]
- Kolbe, M., H. Besir, L. O. Essen, and D. Oesterhelt. 2000. Structure of the light-driven chloride pump halorhodopsin at 1.8 A resolution. Science. 288:1390–1396. [DOI] [PubMed] [Google Scholar]
- Koutsoupakis, C., T. Soulimane, and C. Varotsis. 2004. Probing the Q-proton pathway of ba3-cytochrome c oxidase by time-resolved Fourier transform infrared spectroscopy. Biophys. J. 86:2438–2444. [DOI] [PMC free article] [PubMed] [Google Scholar]
- Krebs, M. P., and H. G. Khorana. 1993. Mechanism of light-dependent proton translocation by bacteriorhodopsin. J. Bacteriol. 175:1555–1560. [DOI] [PMC free article] [PubMed] [Google Scholar]
- Lanyi, J. K., and B. Schobert. 2002. Crystallographic structure of the retinal and the protein after deprotonation of the Schiff base: the switch in the bacteriorhodopsin photocycle. J. Mol. Biol. 321:727–737. [DOI] [PubMed] [Google Scholar]
- Lascombe, J., M. Haurie, and M. L. Josien. 1962. Influence des solvants sur la vibration de valence vC=O de quelques acides monocarboxyliques: etude par spectroscopie infrarouge. [in French]. J. Chim. Phys. 59:1233–1246. [Google Scholar]
- Lide, D. R. 1997. CRC Handbook of Chemistry and Physics. CRC Press, New York.
- Lubben, M., A. Prutsch, B. Mamat, and K. Gerwert. 1999. Electron transfer induces side-chain conformational changes of glutamate-286 from cytochrome bo3. Biochemistry. 38:2048–2056. [DOI] [PubMed] [Google Scholar]
- Maeda, A. 2001. Internal water molecules as mobile polar groups for light-induced proton translocation in bacteriorhodopsin and rhodopsin as studied by difference FTIR spectroscopy. Biochemistry (Mosc.). 66:1256–1268. [DOI] [PubMed] [Google Scholar]
- Maeda, A., J. Sasaki, Y. Shichida, T. Yoshizawa, M. Chang, B. Ni, R. Needleman, and J. K. Lanyi. 1992. Structures of aspartic acid-96 in the L and N intermediates of bacteriorhodopsin: analysis by Fourier transform infrared spectroscopy. Biochemistry. 31:4684–4690. [DOI] [PubMed] [Google Scholar]
- Maeda, A., F. L. Tomson, R. B. Gennis, S. P. Balashov, and T. G. Ebrey. 2003. Water molecule rearrangements around Leu93 and Trp182 in the formation of the L intermediate in bacteriorhodopsin's photocycle. Biochemistry. 42:2535–2541. [DOI] [PubMed] [Google Scholar]
- Marti, T., H. Otto, S. J. Rosselet, M. P. Heyn, and H. G. Khorana. 1992. Anion binding to the Schiff base of the bacteriorhodopsin mutants Asp-85—Asn/Asp-212—Asn and Arg-82—Gln/Asp-85—Asn/Asp-212—Asn. J. Biol. Chem. 267:16922–16927. [PubMed] [Google Scholar]
- Meyer, T. E., S. Devanathan, T. T. Woo, E. D. Getzoff, G. Tollin, and M. A. Cusanovich. 2003. Site-specific mutations provide new insights into the origin of pH effects and alternative spectral forms in the photoactive yellow protein from Halorhodospira halophilia. Biochemistry. 42:3319–3325. [DOI] [PubMed] [Google Scholar]
- Nabedryk, E., J. Breton, H. M. Joshi, and D. K. Hanson. 2000. Fourier transform infrared evidence of proton uptake by glutamate L212 upon reduction of the secondary quinone QB in the photosynthetic reaction center from Rhodobacter capsulatus. Biochemistry. 39:14654–14663. [DOI] [PubMed] [Google Scholar]
- Nabedryk, E., J. Breton, M. Y. Okamura, and M. L. Paddock. 2001. Simultaneous replacement of Asp-L210 and Asp-M17 with Asn increases proton uptake by Glu-L212 upon first electron transfer to QB in reaction centers from Rhodobacter sphaeroides. Biochemistry. 40:13826–13832. [DOI] [PubMed] [Google Scholar]
- Nie, B. 2002. Vibrational band assignment and electrostatic properties of biomolecules based on ab initio computational studies. Master thesis. Oklahoma State University, Stillwater, OK
- Okada, T., Y. Fujiyoshi, M. Silow, J. Navarro, E. M. Landau, and Y. Shichida. 2002. Functional role of internal water molecules in rhodopsin revealed by X-ray crystallography. Proc. Natl. Acad. Sci. USA. 99:5982–5987. [DOI] [PMC free article] [PubMed] [Google Scholar]
- Otto, H., T. Marti, M. Holz, T. Mogi, L. J. Stern, F. Engel, H. G. Khorana, and M. P. Heyn. 1990. Substitution of amino acids Asp-85, Asp-212, and Arg-82 in bacteriorhodopsin affects the proton release phase of the pump and the pK of the Schiff base. Proc. Natl. Acad. Sci. USA. 87:1018–1022. [DOI] [PMC free article] [PubMed] [Google Scholar]
- Pebay-Peyroula, E., G. Rummel, J. P. Rosenbusch, and E. M. Landau. 1997. X-ray structure of bacteriorhodopsin at 2.5 angstroms from microcrystals grown in lipidic cubic phases. Science. 277:1676–1681. [DOI] [PubMed] [Google Scholar]
- Perrin, C. L., and J. B. Nielson. 1997. “Strong” hydrogen bonds in chemistry and biology. Annu. Rev. Phys. Chem. 48:511–544. [DOI] [PubMed] [Google Scholar]
- Puustinen, A., J. A. Bailey, R. B. Dyer, S. L. Mecklenburg, M. Wikstrom, and W. H. Woodruff. 1997. Fourier transform infrared evidence for connectivity between CuB and glutamic acid 286 in cytochrome bo3 from Escherichia coli. Biochemistry. 36:13195–13200. [DOI] [PubMed] [Google Scholar]
- Riistama, S., G. Hummer, A. Puustinen, R. B. Dyer, W. H. Woodruff, and M. Wikström. 1997. Bound water in the proton translocation mechanism of the haem-copper oxidases. FEBS Lett. 414:275–280. [DOI] [PubMed] [Google Scholar]
- Rothschild, K. J. 1992. FTIR difference spectroscopy of bacteriorhodopsin: toward a molecular model. J. Bioenerg. Biomembr. 24:147–167. [DOI] [PubMed] [Google Scholar]
- Sasaki, J., J. K. Lanyi, R. Needleman, T. Yoshizawa, and A. Maeda. 1994. Complete identification of C=O stretching vibrational bands of protonated aspartic acid residues in the difference infrared spectra of M and N intermediates versus bacteriorhodopsin. Biochemistry. 33:3178–3184. [DOI] [PubMed] [Google Scholar]
- Schmidt, B., W. Hillier, J. McCracken, and S. Ferguson-Miller. 2004. The use of stable isotopes and spectroscopy to investigate the energy transducing function of cytochrome c oxidase. Biochim. Biophys. Acta. 1655:248–255. [DOI] [PubMed] [Google Scholar]
- Song, Y., J. Mao, and M. R. Gunner. 2003. Calculation of proton transfers in bacteriorhodopsin bR and M intermediates. Biochemistry. 42:9875–9888. [DOI] [PubMed] [Google Scholar]
- Soulimane, T., G. Buse, G. P. Bourenkov, H. D. Bartunik, R. Huber, and M. E. Than. 2000. Structure and mechanism of the aberrant ba(3)-cytochrome c oxidase from Thermus thermophilus. EMBO J. 19:1766–1776. [DOI] [PMC free article] [PubMed] [Google Scholar]
- Steiner, T. 2002. The hydrogen bond in the solid state. Angew. Chem. Int. Ed. Engl. 41:49–76. [DOI] [PubMed] [Google Scholar]
- Subramaniam, S., D. A. Greenhalgh, and H. G. Khorana. 1992. Aspartic acid 85 in bacteriorhodopsin functions both as proton acceptor and negative counterion to the Schiff base. J. Biol. Chem. 267:25730–25733. [PubMed] [Google Scholar]
- Subramaniam, S., and R. Henderson. 2000. Molecular mechanism of vectorial proton translocation by bacteriorhodopsin. Nature. 406:653–657. [DOI] [PubMed] [Google Scholar]
- Susi, H., S. N. Timasheff, and L. Stevens. 1967. Infrared spectra and protein conformations in aqueous solutions. I. The amide I band in H2O and D2O solutions. J. Biol. Chem. 242:5460–5466. [PubMed] [Google Scholar]
- Svensson-Ek, M., J. Abramson, G. Larsson, S. Tornroth, P. Brezezinski, and S. Iwata. 2002. The X-ray crystal structures of wild-type and EQ(I-286) mutant cytochrome c oxidases from Rhodobacter sphaeroides. J. Mol. Biol. 321:329–339. [DOI] [PubMed] [Google Scholar]
- Szaraz, S., D. Oesterhelt, and P. Ormos. 1994. pH-induced structural changes in bacteriorhodopsin studied by Fourier transform infrared spectroscopy. Biophys. J. 67:1706–1712. [DOI] [PMC free article] [PubMed] [Google Scholar]
- Tsukihara, T., K. Shimokata, Y. Katayama, H. Shimada, K. Muramoto, H. Aoyama, M. Mochizuki, K. Shinzawa-Itoh, E. Yamashita, M. Yao, Y. Ishimura, and S. Yoshikawa. 2003. . The low-spin heme of cytochrome c oxidase as the driving element of the proton-pumping process. Proc. Natl. Acad. Sci. USA. 100:15304–15309. [DOI] [PMC free article] [PubMed] [Google Scholar]
- Xie, A., W. D. Hoff, A. R. Kroon, and K. J. Hellingwerf. 1996. Glu46 donates a proton to the 4-hydroxycinnamate anion chromophore during the photocycle of photoactive yellow protein. Biochemistry. 35:14671–14678. [DOI] [PubMed] [Google Scholar]
- Xie, A., L. Kelemen, J. Hendriks, B. J. White, K. J. Hellingwerf, and W. D. Hoff. 2001. Formation of a new buried charge drives a large-amplitude protein quake in photoreceptor activation. Biochemistry. 40:1510–1517. [DOI] [PubMed] [Google Scholar]
- Zscherp, C., R. Schlesinger, J. Tittor, D. Oesterhelt, and J. Heberle. 1999. In situ determination of transient pK changes of internal amino acids of bacteriorhodopsin by using time-resolved attenuated total reflection Fourier-transform infrared spectroscopy. Proc. Natl. Acad. Sci. USA. 96:5498–5503. [DOI] [PMC free article] [PubMed] [Google Scholar]
Associated Data
This section collects any data citations, data availability statements, or supplementary materials included in this article.


