Abstract
Angularly resolved light scattering measurements were performed on suspensions of EMT6 cells and on mitochondria isolated from rabbit liver. Mie theory analysis of the scattering from intact cells indicated that mitochondrial-sized organelles dominated scattering in the range 5–90°. This interpretation was supported by the analysis of scattering from isolated mitochondria. Intact cells were subjected to oxidative stress by photodynamic insult. After 3 h of incubation in the heme precursor aminolevulinic acid hexylester, EMT6 cells accumulated abundant protoporphyrin IX, an endogenous photosensitizer formed in mitochondria. Irradiation of aminolevulinic acid/protoporphyrin IX-sensitized cells with 10 J cm−2 of 514 nm light led to pronounced changes in angularly resolved light scattering consistent with mitochondrial swelling. Electron microscopy of similarly treated EMT6 cell monolayers showed significant changes in mitochondrial morphology, which included distension of the outer unit membrane and bloating of the internal mitochondrial compartment. Informed by these electron microscopy results, we implemented a coated sphere model to interpret the scattering from intact cells subjected to oxidative stress. The coated sphere interpretation was compatible with the scattering measurements from these cells, whereas simpler Mie theory models based on homogenous swelling were dramatically unsuccessful. Thus, in this system, angularly resolved light scattering reports oxidative-stress-induced changes in mitochondrial morphology.
INTRODUCTION
For decades, changes in mitochondrial morphology such as swelling and condensation have been associated with a wide range of important biological functions and pathologies (Hackenbrock, 1966). In addition, relatively recent work has established that mitochondrial volume dysregulation may result from the opening of the permeability transition pore in response to a variety of insults, including oxidants. The opening of channels or swelling sufficient to rupture the outer mitochondrial membrane may cause the release of cytochrome c, which in turn leads to necrotic or apoptotic cell death (Green and Reed, 1998).
There has been significant renewed interest in the use of rigorous light scattering techniques to interrogate intracellular structure in cell systems and in tissue. With the exception of the extreme forward scattering direction where cell volume effects are important, Mourant et al. (1998) showed that scattering of visible light from cells is governed predominantly by the size and composition of intracellular organelles rather than by the volume of the cell as a whole. A study by Perelman et al. (1998) demonstrated that oscillations in the wavelength-dependent backscattering from cells and from tissue could be interpreted on the basis of nuclear size distributions. Backman et al. (1999) and Sokolov et al. (1999) extended the backscattering measurement to include polarization, which enabled the discrimination between singly and multiply scattered light in thick samples such as tissue. These reports and a related investigation using angle-resolved low coherence interferometry (Wax et al., 2002) shared with Perelman et al. (1998) an emphasis on the estimation of nuclear size in normal and malignant cell populations.
Mitochondria are also important scatterers of light in cells and tissue at visible wavelengths (Beauvoit et al., 1995). Optical property measurements of intact cells by Mourant et al. (1998) revealed a distribution of intracellular scatterers with volumes equivalent to spheres with diameters in the range 0.2–1.0 μm. Subsequent investigations by this group (Mourant et al., 2001, 2002) supported the idea that the dominant populations of scatterers in cells are smaller than nuclei. The 1.0–2.0-μm diameters at the high end of the range reported in their more recent articles are certainly compatible with mitochondria. Simple optical transmission measurements are sensitive to changes in mitochondrial morphology in preparations of isolated mitochondria, and such measurements have been used and reported for many years (for example, Packer, 1960). There are, however, very few reports of mitochondrial shape changes and swelling from optical measurements performed on intact cells. One such recent example is that of Boustany et al. (2002), who used an optical scatter imaging microscope to identify mitochondrial rounding in endothelial cell monolayers subjected to increased intracellular calcium.
In this article we describe the results of angle-resolved light scattering measurements performed on suspensions of intact murine mammary carcinoma cells, on these cells subjected to photodynamically induced oxidative stress, and on suspensions of mitochondria isolated from rabbit liver. The particular photosensitization strategy that we chose induces oxidative stress directly within the mitochondria, and this stress is known to lead to the demise of the cell through rapid apoptosis and/or necrosis, depending on the specific cell line and the details of the treatment (Kessel and Luo, 1999; Oleinick et al., 2002). Our analysis reveals that the changes to the scattering induced by photodynamic stress are consistent with an inhomogeneous mitochondrial swelling in which cytosol pools in the center of the organelle, displacing mitochondrial material to the periphery. Transmission electron microscopy images of the control and treated cells confirm these particular changes in mitochondrial morphology.
METHODS
Cell culture and photodynamic treatment
EMT6 mouse mammary carcinoma cells were maintained in a monolayer culture in Eagle's basal medium with 10% fetal bovine serum (complete media). Approximately 107 cells were lifted from monolayer with 0.25% trypsin and suspended in at least 1 part complete media per 1 part trypsin. They were then centrifuged and washed in serum free media. The cells were again centrifuged, suspended in serum free media, and incubated with 50 μM aminolevulinic acid-hexylester (h-ALA) for 3 h to allow for the accumulation of the mitochondrial-localizing photosensitizer protoporphyrin IX (Peng et al., 1997).
After h-ALA incubation, the cells were again centrifuged and washed with serum free media and then centrifuged and washed in Hanks' balanced salt solution (HBSS). After a final centrifugation, the pellet was suspended in HBSS at a final volume of 2 ml. All handling of cells after incubation was done at very low light levels.
The cell suspension was then split into two groups. The control group was protected from any exposure to light. The treatment group was irradiated with 514 nm light at a fluence rate of 50 mW/cm2 for 200 s, conditions that were established by preliminary electron microscopy experiments. Greater than 90% of EMT6 cells subjected to this fluence stained with trypan blue immediately after treatment, indicating the onset of rapid necrosis (Lam et al., 2001). Less than 1 h elapsed between the time that the cells were taken out of incubation and the end of the light scattering experiments, and the time between irradiation and the end of the scattering measurements did not exceed 20 min.
Isolation of mitochondria
Mitochondria were isolated from fresh rabbit liver following the method of Senior et al. (1975). Immediately after the animal was sacrificed, the liver was harvested and kept on ice in a 10% saline solution. It was then sliced and washed in a buffer of 0.3 M sucrose, 1 mM EDTA, and 1 mM Tris HCl (hereafter Tris buffer) at a pH of 7.4. The tissue was homogenized in Tris buffer with 1 mg/ml bovine serum albumin (BSA) in a potter, and the slurry was centrifuged at 900 g for 5 min. The supernate was kept and centrifuged at 11,500 g for 5 min. The pellet was resuspended in buffer and BSA and centrifuged again. The fat layer was removed, and the pellet was suspended in Tris buffer and BSA.
The viability of the mitochondria was evaluated by measurements of oxygen consumption. A 3-ml covered cuvette was filled with 2 ml of a reaction buffer (24 mM glycylglycine, 10 mM MgCl2, 60 mM KH2PO4, and 87 mM sucrose) and 15 μl rotanone. The tip of an oxygen-sensitive electrode (model OM-4, Microelectrodes, Bedford, NH) was placed through a small hole in the top of the cuvette. Sufficient mitochondria were added to the cuvette to establish easily detectable oxygen consumption. Succinate (100 μl) was added to establish state 4 respiration, and then 20 μl ADP was added to establish state 3 respiration. After state 4 and state 3 respiration were verified with the oxygen electrode, the mitochondria were considered viable. The mitochondria were kept on ice, and all subsequent handling was done in the Tris buffer.
Angularly resolved light scattering
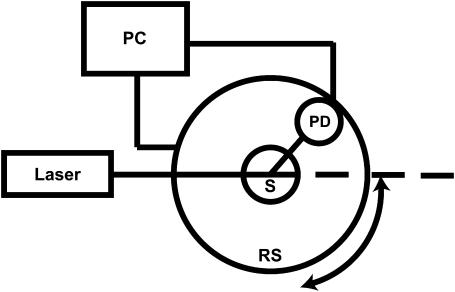
We constructed a goniometer to measure angularly resolved light scattering. A block diagram of the experimental setup is shown in Fig. 1. A scattering sample in aqueous suspension is placed in a cylindrical cuvette (model 540.115, Helma, Plainview, NY), which is positioned above the center of a 30.5-cm-diameter rotary stage (RT-12, Arrick Robotics, Tyler, TX). Red light (632.8 nm) from a 20-mW helium-neon laser is directed through the cuvette. In all of our measurements, the laser is linearly polarized perpendicular to the surface of the rotary stage. Light scattered from the sample is passed through a pinhole mounted midway to the edge of the rotary stage and colleted by an optical fiber (400-μm core diameter, 0.22 N.A.) that is mounted at the edge. Light exiting the fiber is measured by a photodiode (S2386-18L, Hamamatsu, Bridgewater, NJ) and digitized at 16 bits. A constant offset is introduced by light from a light-emitting-diode incident on the photodiode. A PC-controlled stepper motor rotates the stage continuously from ∼3 to 110° with respect to the forward direction of the laser at an angular resolution of 0.2°. The angular position is read out from an optical encoder, and the stage position and photodiode voltage are simultaneously recorded. The data acquisition is automated and controlled by a homebuilt program written in LabView (National Instruments, Austin, TX). Each scan of the full angular range takes ∼2 min.
FIGURE 1.
Block diagram of the goniometer setup for measuring angularly resolved light scattering. A laser beam is directed through a sample (S) suspended above the center of a computer (PC)-controlled rotary stage (RS). Scattered light is measured by a photodiode (PD) mounted on the stage.
For each measurement, a background is taken with the suspending solution in the absence of the scattering sample. The sample is then added and mixed well. Each data set represents the measurement of the sample with the background subtracted. There is also a multiplicative factor of Sin(θ) to account for the number of particles being sampled at a given angle (Bohren and Huffman, 1998).
Electron microscopy methods
For electron microscopy, cells were grown on glass chamber slides and fixed in 0.1 M phosphate-buffered 2.0% glutaraldehyde at room temperature for 2 h. After repeated rinsing in 0.1 M phosphate buffer, the cells were postfixed in 1.0% osmium tetroxide for 20 min. The slides were passed through a graded series of ethanol, infiltrated with Spurr epoxy resin, and fitted to inverted capsular molds containing fresh Spurr resin. After polymerization at 70°C, the hardened capsules containing the cells of interest were then “popped off” the surface of the glass slides by dipping the slides into liquid nitrogen (de Mesy Jensen and di Sant' Agnese, 1992). These blocks were trimmed and sectioned at 60–70-nm intervals with a diamond knife onto mesh copper grids. The grids were contrast enhanced with uranyl acetate for 15 min and lead citrate for 10 min and examined and photographed for quantitative analysis with a Hitachi 7100 transmission electron microscope at magnifications ranging from 3000× to 30,000×.
Mie theory fits
A Mie theory model was fit to the angularly resolved scattering data. In these fits, the indices of refraction for both the scattering center and the surrounding medium were held fixed at 1.40 and 1.38, respectively, to represent organelles in cytoplasm (Beuthan et al., 1996). We calculated Mie theory scattering spectra,  for linearly polarized light scattered from particles with radius r ranging from 0.005 to 8.0 μm. The low and high ends of this range define rmin and rmax in Eq. 5. These values were chosen to span the radii of the scattering centers anticipated in the data; the diameter of a whole cell, for example, is ∼15 μm. Test functions,
  were built from Mie theory by integrating the scattering spectra against a particle size distribution,
  such that
 |
(1) |
Here,  is assumed to be a sum of log-normal distributions,
 |
(2) |
and  and
and  are related to the mean, μ, and standard deviation, σ, of the log-normal distribution as
 |
(3) |
and
 |
(4) |
We further constrained each distribution to be representative of physical scattering centers in cells by defining a parameter,
 |
(5) |
which is simply the ratio of the sum of the probability distribution at the two imposed endpoints to the peak probability. This constraint insured that the means and standard deviations that resulted from the fitting process were physically reasonable values.
Let  be the measured angularly resolved scattering data. Because amplitudes of the scattered light intensity encountered in our experiments differ by four orders of magnitude, it was important to fit both
  and
and  Mie-type scattering is highly forward directed, and as such many of the details of angularly resolved scattering at all but the smallest angles are best observed in Log (I(θ)). Thus, fitting only I(θ) strongly favors the most forward scattering angles at the expense of higher angle scattering. However, in the case of scattering from whole cells, we found that only fitting to Log I(θ)) underestimated the extreme forward scattered data point, and we therefore included an I(θ) term in the fit.
The fit itself was carried out by minimizing the function
 |
(6) |
where  were chosen to weight each term approximately equally. Specifically, λ1 was set arbitrarily to 1.0, λ2 to 7.0, and λ3 to 1010. These relative amplitudes of λ1 and λ2 rendered the two integrals in Eq. 6 approximately equal near a minimum in χ2. This greatly improved the quality of the fits. With respect to the parameter Rj and its coefficient λ3, we were guided by previous work of Mourant et al. (2002) in constraining the log-normal distributions so that their amplitudes were diminished at the tails relative to their peak value by a factor of 108. As an extension to that work, we increased this restriction to account for the relative cross sections for r = 8 μm versus ∼1-μm structures (
 ). Thus, λ3 was chosen to be 1010. We note that relaxation of this parameter does not affect the mean of the distribution and more specifically does not affect the location of the strong peak of the distribution shown in Fig. 5. In particular, the choice of these parameters does not skew the results to discriminate against nuclear or whole-cell contributions. Fitting was done iteratively with the free parameters being the mean, μj, standard deviation, σj, and the overall amplitude, aj, for each log-normal distribution
  The minimization was carried out using the simple downhill simplex of Nedler and Mead (Press et al., 1992).
FIGURE 5.
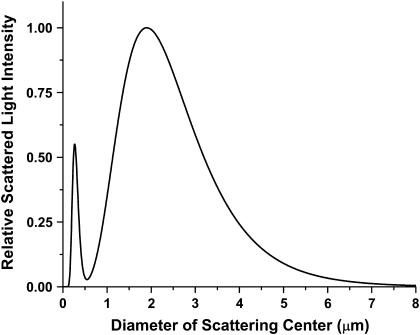
Normalized scattered light intensity as a function of particle diameter obtained from the Mie theory fits to the control cell scattering data shown in Fig. 4. Plotted here are the particle size distributions weighted by the scattering cross sections. As noted in the text, 65% of the light scattering can be attributed to mitochondria-sized objects with diameters in the range 1–3 μm.
Coated sphere modeling and fitting
On the basis of our initial electron microscopy results, we fit a coated sphere model to the scattering from photodynamically treated cells. In the coated sphere case, we let the larger of the two log-normal distributions obtained from fits to the control cell data swell as  where r is the initial radius of the scattering sphere. This is equivalent to allowing the mean, μj, and standard deviation, σj, of the distribution,
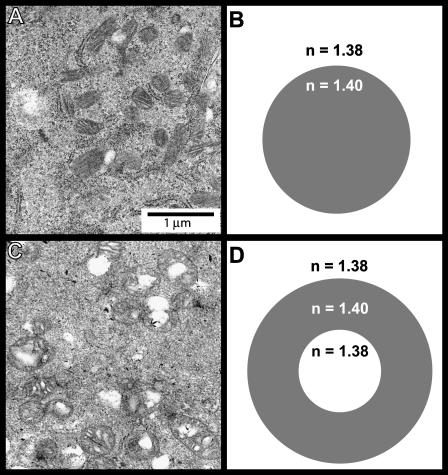
  to scale by the same constant α. Mitochondria swelled by means of cytosol penetrating and forming a core in the center of the organelle, as shown in Fig. 9 C. The diameters of the core (
 ) and of the coating (
 ) were fixed for a particular α by conservation of mitochondrial mass and are related by,
 |
(7) |
FIGURE 9.
Electron microscopy images and dielectric models for control and photodynamically treated mitochondria in EMT6 cells. Panels A and B correspond to the control cells, whereas panels C and D correspond to mitochondria subjected to photodynamic insult. In the coated sphere model, the oxidative stress allows cytosol to penetrate the mitochondrion forming a swollen organelle with a cytosolic core in the center with refractive index 1.38.
The index of refraction for the core and the surrounding medium was fixed at 1.38, and the index of the coating layer was fixed at 1.40 (see Fig. 9 D). With these assumptions based on the electron microscopy appearance of the treated mitochondria, the analysis of the angularly resolved scattering from the treated cells was then a one-parameter fit in α. As in the initial Mie theory fits, we constructed test functions, T, from particle size distributions. The difference was that for one log-normal distribution, we used a coated sphere instead of a homogenous sphere model. The fit was again done with the simple downhill simplex by minimizing the function,
 |
(8) |
Uncertainties in α were estimated by determining the values on either side of the χ2 minimum that increased χ2 by 1 (Bevington, 1969).
RESULTS
Verification of goniometer measurements and analysis in a model system
An aqueous suspension of monodisperse polystyrene microspheres (Duke Scientific, Palo Alto, CA) was used to verify the goniometer experiment. These beads have a well-defined spherical shape and index of refraction (1.59) and a narrow size distribution (2-μm diameter, coefficient of variance (CV) < 8%). Scattering parameters from very dilute suspensions of these microspheres can be calculated exactly with Mie theory. Thus, we wanted to create conditions in which we were measuring photons that had only undergone a single scattering event. To accomplish this in these experiments, the concentration of the 2-μm-diameter beads was adjusted to106 beads/ml, which yielded a scattering mean free path of 10 cm. The angularly resolved scattering data from such a sample are shown in Fig. 2 along with the best fit of Eq. 6 to the data. From the fit a mean particle size of 2 μm with a coefficient of variance of 6% was obtained, which is within the precision reported by the manufacturer.
FIGURE 2.
Angularly resolved light scattering from 2-μm-diameter (CV = 8%) polystyrene microspheres (○) and a Mie theory best fit (solid line) to these data. The fit returned a diameter of 2 μm and a CV of 6%.
Scattering measurements from suspensions of intact cells
In experiments with beads, multiple scattering effects are first noticed in small angle scattering. In Mie-type scattering, the vast majority of light is scattered into small angles, and within this angular range multiple scattering is most likely to confound the data. Because cells are not an ideal system like the polystyrene spheres and contain many scattering sites, it is not possible to use the bead experiments to determine the concentration of cells that establish a single scattering regime. We therefore looked empirically at the scattering data for various concentrations of cells and picked a concentration such that a further dilution of the sample did not change the angular distribution. We arrived at a number of ∼105 cells/ml in HBSS, which is in good agreement with Mourant et al. (2002).
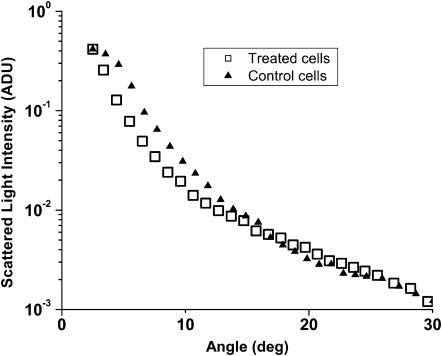
The plots in Fig. 3 show the angularly resolved light scattering from intact control EMT6 cells and from cells subjected to ALA-sensitized photodynamic insult. The scattering from these two groups of cells is noticeably different for angles <∼30°. For larger angles, scattering from the two groups is virtually identical. It is apparent that the photodynamically treated cells scatter less total light than the control cells over this angular range and that the scattering distribution from the treated cells is more forward directed.
FIGURE 3.
Angularly resolved light scattering from untreated, intact EMT6 cells (▴) and from EMT6 cells subjected to photodynamically induced oxidative stress (□). The treated cells scatter less light at small angles and the distribution is more forward peaked. Error bars are omitted for clarity.
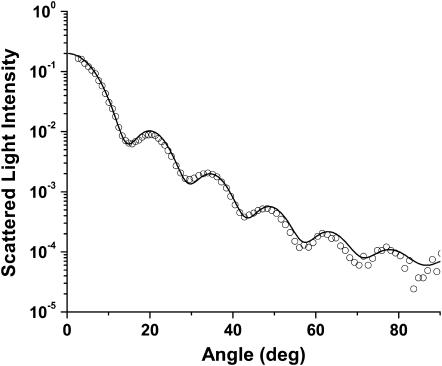
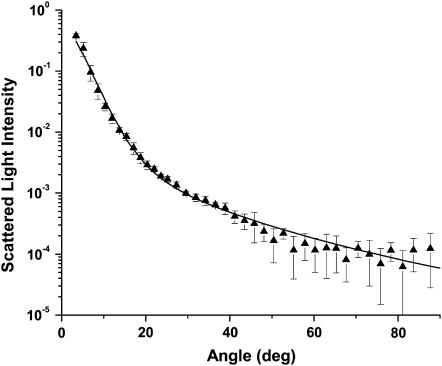
Angularly resolved scattering data from intact cells was fit as described above in the Methods section. Initially, the fits to the control cell data were performed with one, two, or three log-normal particle size distributions. We found the best results with a fitting function that included two log-normal scatterer size distributions. Fits using one distribution rather than two yielded a fourfold degradation in χ2. Attempts to fit the data using three independent populations resulted in the fitting algorithm returning either zero amplitude for one of the populations or returning two identical populations. A typical fit using two log-normal distributions is shown in Fig. 4. The first population of scatterers had a mean diameter of 0.22 μm ± SD of 0.057 μm; the second had a mean diameter of 1.15 μm ± SD of 0.54 μm. The amplitudes of the two distributions extracted from the fits showed that there were 134 “small” particles for every “large” particle in an intact cell. Fig. 5 shows the relative contributions of these two populations to the observed light scattering. In this plot the normalized “relative scattered light intensity” is computed from the product of the particle size distribution obtained by the Mie theory fits and the scattering cross section. It is evident that most of the light is scattered by particles with diameters between ∼1 and 4 μm. More precisely, computing the area under the total light scattered curve in Fig. 5 for different particle sizes shows that 65% of the light scattered over this angular range is done by particles with diameters spanning 1–3 μm. Particles with diameters 0.5–4.0 μm scatter 85% of the light.
FIGURE 4.
Angularly resolved light scattering from control cells (▴) and a Mie theory-based fit of Eq. 6 to the data (solid line). The best fit incorporated two log-normal distributions of scatterers, with mean diameters of 0.22 and 1.15 μm.
Scattering results from isolated mitochondria
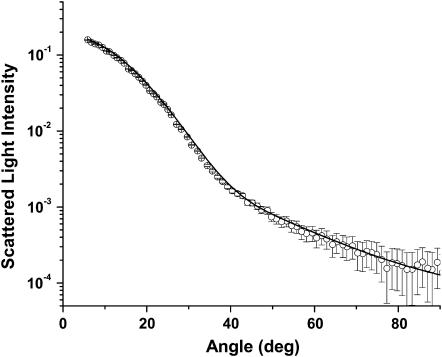
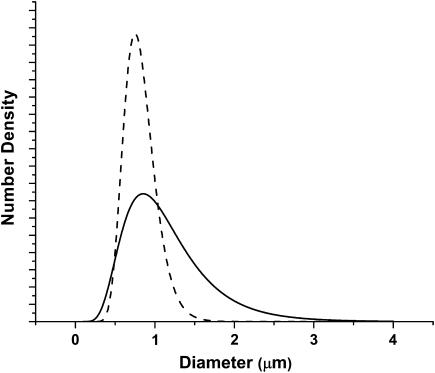
Scattering measurements from mitochondria isolated from rabbit liver were done in much the same manner as were the measurements from whole cells. Instead of HBSS, we used Tris buffer to suspend the mitochondria. We fit a log-normal Mie theory model with a single particle size distribution to the angularly resolved data from the mitochondria and found a mean diameter of 0.89 μm and mean ± SD of 0.2 μm. Fig. 6 displays representative scattering data with the Mie theory fit. The particle size distribution for the isolated mitochondria and the larger of the two distributions from the whole cells are compared in Fig. 7. The means of the distributions obtained from fits to the scattering data from isolated mitochondria and whole cells are very close (0.89 vs.1.15 μm, respectively), and the peaks of the distributions are almost identical (0.85 vs. 0.89 μm). This supports the assignment of the larger distribution in the cells to a predominantly mitochondrial origin.
FIGURE 6.
Scattering data from mitochondria isolated from rabbit liver (○) and a Mie theory fit (solid line) based on Eq. 6.
FIGURE 7.
Particle size distributions obtained from the fits to the scattering data from whole cells (solid line) and isolated mitochondria (dashed line). The peaks of these two distributions are 0.89 and 0.85 μm, respectively, and the corresponding means are 1.15 and 0.89 μm. Number densities are in units of particles per unit volume.
Electron microscopy results
We analyzed transmission electron microscopy images to obtain information about changes in mitochondrial morphology induced by ALA-sensitized oxidative stress. Because the absolute mitochondrial size may not be preserved in the fixation process, we did not attempt to use these data for rigorous size estimates. Rather, the electron microscopy images enabled us to determine gross morphologic features as well as relative changes between the two groups of cells.
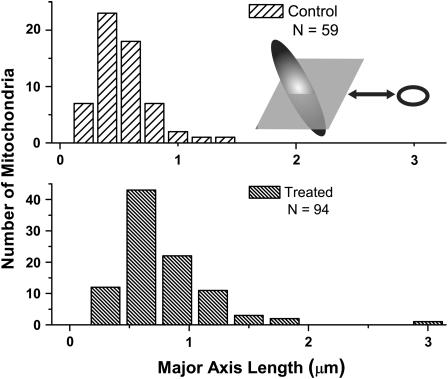
We examined 70-nm-thick sections through the mitochondria, organelles with dimensions between 0.5 and 1.0 μm and 1.0–4.0 μm along the minor and major axes, respectively (Palade, 1953). These cross sections are ellipsoidal in nature. Our basis for comparison of the control versus treated cells was a measure of the major axis of this elliptical section for many mitochondria from both groups. Using the image processing package Image Pro (Media Cybernetics, San Diego, CA) we obtained 94 measurements of the major axes from EM sections of mitochondria that had been exposed to oxidative stress and 59 similar measurements from mitochondrial sections taken from the control group. A schematic of the sampling method is displayed as an inset of Fig. 8.
FIGURE 8.
Histograms of the major axis dimensions of 70-nm-thick mitochondrial sections measured on electron micrographs obtained from cells pre- and postoxidative stress. The major axis of each slice through an individual mitochondrion is depicted schematically in the inset. When an ellipsoidal object such as a mitochondrion is sectioned in this way, the peak of the distribution of major axis lengths corresponds to the width of the object, and the length is reflected in the tail of the distribution. Comparison of the peaks of these two distributions indicates a 20% increase in the width of the mitochondria postphotodynamic insult.
Fig. 8 shows histograms of the major axes of the 70-nm-thick sections through mitochondria measured in the electron micrographs. Because of the elongated nature of a mitochondrion, the minor axis of the organelle is much more likely to be sampled than is the major axis. General features of these distributions of measurements are that the width of the mitochondrion is reported in the peak, and the length is reported in the tail. The mitochondria in the cells exposed to photodynamic damage are swollen by 20% peak to peak relative to the control.
Important features of the mitochondrial structure and the response to photodynamic insult are shown in the electron micrographs of Fig. 9, A and C. The distribution of the mitochondrial material becomes less homogeneous posttreatment, and the mitochondria take on the appearance of a coated sphere, as depicted schematically in Fig. 9, B and D. The original mitochondrial material appears to be concentrated in the outer region of the organelle, and a core of non-electron-dense material is present in most of the organelles.
Scattering results for photodynamically treated cells
The model for interpreting the light scattering from the ALA-sensitized, irradiated cells was created to be consistent with both the electron microscopy data as well as the Mie theory fits to the control cells as described above. The Mie theory fits to control cells and isolated mitochondria provide strong evidence that mitochondria dominate the forward angle scattering in intact cells. Electron microscopy shows that the mitochondria undergo swelling as a result of the photodynamically induced oxidative stress.
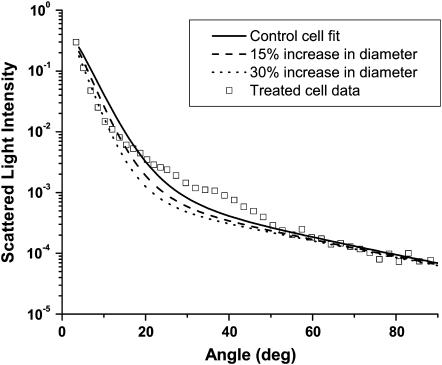
We considered several possible models based on various physical interpretations. A Mie theory model in which the mitochondria swelled in response to photodynamic insult and retained their original index of refraction could not represent the data, as this would cause the total scattering cross section to increase, and the data presented in Fig. 3 shows that the cross section in fact decreases. The possibility that, as a mitochondrion swelled, it took on a lower, homogeneous, volume-averaged index of refraction,  was also examined. Fig. 10 shows how such a homogeneous swelling would affect the angularly resolved scattering from whole cells. It is clear that such a swelling effect is not consistent with the scattering angular distribution observed from the treated cells.
FIGURE 10.
A Mie theory model based on a volume-averaged, homogeneous index of refraction is not compatible with scattering measured from cells subjected to photodynamic insult. The open squares are the angularly resolved scattering data from the treated cells. The solid line is the Mie theory fit of Eq. 6 to the control cell data, and the two dashed lines show the predictions of a model based on a homogeneous refractive index that is diluted by influx of cytosol into the mitochondrial volume.
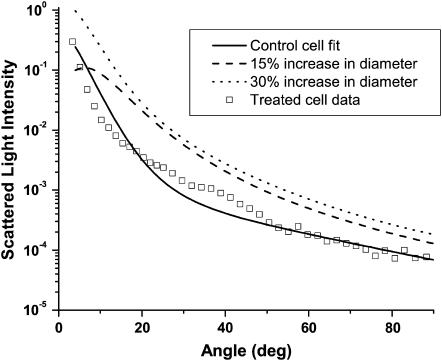
Again using the electron microscopy results such as those shown in Fig. 9, we adopted a coated sphere model as described above in the Methods section. We found that the index of refraction used for the material comprising the core (i.e., water versus cytosol) was very important in terms of the resulting angularly resolved scattering signatures. Fig. 11 illustrates the effects of mitochondria swelling by means of a “water-filled” coated sphere, where the index of refraction of the core was held at 1.33. As shown in the figure, this also is clearly not an appropriate model for the scattering from the cells subjected to photodynamic insult.
FIGURE 11.
A coated sphere model assuming a water core (refractive index = 1.33) is not compatible with scattering from cells whose mitochondria have swelled in response to oxidative stress as shown in Fig. 9. The open squares are the measured scattering data from cells subjected to photodynamic stress, and the solid line is the Mie theory fit to the control cell scattering data. The two dashed curves are the theoretical results for 15 and 30% increases in mitochondrial diameter using a water-filled coated sphere model.
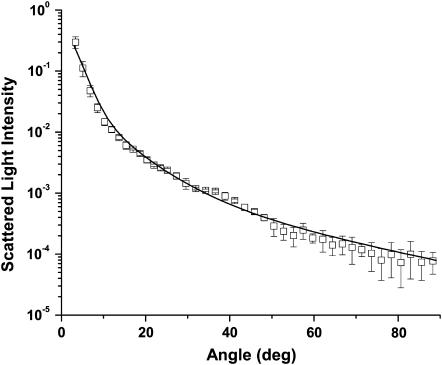
We were, however, able to fit the data quite well with a coated sphere model in which the core of the sphere was cytosol with a refractive index of 1.38. As mentioned previously, we included mitochondria within the “large” population of scatterers obtained by the fits to the control cells, and we therefore let this population swell as coated spheres as described in Methods. The fits reported a 13% (±2%) increase in diameter for this population in the photodynamically-treated cells as compared to the control case. The angularly resolved scattering data from the photodynamically treated cells and a cytosol core, coated sphere model fit are displayed in Fig. 12. The 13% swelling reported by the analysis of the scattering measurements is less than the 20% obtained by direct measurements of mitochondria using electron microscopy, a result which is consistent with the fact that the larger population of intracellular scattering centers contains a nonmitochondrial component. If one assumes that these nonmitochondrial scatterers do not swell immediately in response to photodynamic insult, the dilution of the magnitude of the mitochondrial swelling extracted from the fits to the whole-cell scattering data suggests that ∼65% (0.13/0.20) of the larger population are mitochondria.
FIGURE 12.
Scattering data (□) from the cells subjected to photodynamic insult and a coated sphere fit that incorporates cytosolic filling of the inner mitochondrial compartment. The refractive index of the cytosol was assumed to be 1.38.
DISCUSSION
The data and analysis presented in this report establish the feasibility of monitoring stress-induced changes in mitochondrial morphology in intact, living cells without administration of exogenous agents. Our experiments confirm that, in this cell line, mitochondria contribute significantly to light scattering at angles from ∼5 to 90°. Evidence for this comes first from the comparison of the size distributions extracted from fits to the whole cell and isolated mitochondria scattering data. Probably more convincing, however, is the fact that the analysis of the angle-resolved scattering from cells subjected to mitochondrial oxidative stress is remarkably compatible with the morphology changes observed under electron microscopy of identically treated cells.
The angle-resolved scattering plotted in Fig. 3 shows clear differences between the EMT6 cells subjected to photodynamic insult and the control, untreated cells. We emphasize that these measurements were made immediately after irradiation, and that the cells were intact; no significant lysis was observed at these early time points. Although some loss of cell volume regulation is probably also happening concurrently, our measurements would likely not be sensitive to this. Whole-cell volume is reported in the extremely forward-directed scattering (Salzman et al., 1990) that is not detected in our experiments, which begin sampling at ∼5° from the incident laser beam.
The fits to the angle-resolved scattering data in Fig. 4 reveal two populations of intracellular scatterers, which is generally consistent with the findings of Mourant et al. (1998) in two rat embryo fibroblast cell lines. In fact, the size estimates that we extract for the mean diameters of the two populations—0.22 and 1.15 μm—agree remarkably well with the range of intracellular scatterer dimensions reported by those authors. Although the mean of the larger size distribution is at 1.15 μm and this is indeed smaller than the diameter of a cell nucleus, this does not mean that the nucleus does not contribute to scattering in this angular range. The plots of Fig. 5 illustrate this clearly, where the size distributions extracted from the fits to the angle-resolved data of Fig. 4 are multiplied by the total scattering cross section as a function of particle diameter. These plots, which report the total light scattered as a function of particle size diameter, have several important features. First, although there are more than a 100-fold greater number of the small-diameter scatterers within a cell, these small-diameter structures scatter relatively little light in the angular range 5–90° as compared to the larger-diameter organelles. Second, although the mean of the larger-diameter size distribution was ∼1 μm, Fig. 5 shows that most of the light that is scattered is in fact scattered by particles with diameters of 2 μm, and the large-diameter tail of this distribution is certainly compatible with a contribution from the nucleus.
Fig. 6 presents angle-resolved data from a suspension of rabbit liver mitochondria. Here the Mie-theory fit is excellent, and the resulting size distribution, shown in Fig. 7, is significantly narrower than the large-diameter distribution that results from fits to the whole-cell data of Fig. 4. There are two explanations for these observations. First, as stated above the larger-diameter population of scatterers in the whole-cell case probably includes contributions from organelles other than mitochondria, and this will widen the size distribution. Second, with respect to the mitochondrial contribution itself, because the mitochondria in intact cells are ellipsoidal and randomly oriented whereas mitochondria in suspension tend to round, the isolated mitochondria will have a more tightly distributed range of effective diameters. Nevertheless, the peak and the mean of this distribution are in good agreement with those of the larger of the two scatterer populations from whole cells, as depicted in Fig. 7.
As noted above, this agreement is one piece of evidence that the larger size distribution extracted from fits to the whole-cell scattering data includes a significant contribution from mitochondria. The second, and perhaps more compelling evidence, comes from the fact that photodynamic insult changed the mitochondria in specific ways, and a coated sphere interpretation of the scattering measurements reported this change correctly. Figs. 8 and 9 summarize results of electron microscopy imaging performed on intact cells pre- and postphotodynamic stress. In particular, the representative EM images shown in Fig. 9, A and C, provided the rationale for the use of homogenous and coated sphere models in analyzing the scattering angular distributions from the control and treated EMT6 cells, respectively. Before leaving the images of Fig. 9, we note that the photodynamically treated mitochondria shown in Fig. 9 C bear a striking resemblance to mitochondria during state 4 to state 3 transition, as depicted for example in Fig. 14 of Hackenbrock (1966).
In Figs. 10, 11, and 12, we show the results of fitting the whole-cell scattering data from the treated cells using various candidate models that incorporated different assumptions about the morphology of the mitochondrial subjected to oxidative stress. The data are dramatically incompatible with models based on a homogeneously swollen sphere with a uniformly diluted refractive index (Fig. 10) and on a coated sphere in which the core has a refractive index equal to that of water (Fig. 11). The fact that the data are able to discriminate between these interpretations and one that incorporates a coated sphere with a cytosolic core is a measure of the excellent sensitivity of angularly resolved light scattering to very specific changes in the morphology of mitochondria, at least in this cell line. Interestingly, a coated sphere model was used previously by Brunsting and Mullaney (1974) to interpret scattering from Chinese hamster ovary (CHO) and from HeLa cells in terms of a nucleus surrounded by cytosol. Over part of the angular range studied in that work, the authors demonstrated in the CHO cells modestly better agreement with experiment using a coated versus homogeneous sphere model. Results with the HeLa cells were not shown but were apparently less encouraging. In a study of the angular dependence of visible light scattering from Escherichia coli cells, Cross and Latimer (1972) had good success by treating the bacteria as a coated ellipsoid, with the coat in this case representing the cell wall. As far as we are aware, ours is the first use of a coated sphere model to analyze the influence of morphological changes in mitochondria induced by any means on scattering angular distributions from whole cells, and it is the first direct experimental validation of a coated sphere model with EM. Although our coated sphere extension to a Mie theory analysis worked very well in this situation and seems to have captured the critical physical features of the problem, there does appear to be some structure in the angular distribution near 40° from the treated cells (see Fig. 12) that is not reproduced by the fitting function. It is possible that a rigorous comparison with other methods of treating these kinds of data, such as the finite-difference time-domain approach described by Drezek et al. (1999), would yield further insight. Finally, we emphasize that our measurements and analysis cannot strictly exclude the possibility that other organelles may also be responding to this form of oxidative stress in ways that may influence the scattering angular distributions.
There are several lines of investigation suggested by this study. It may be possible, for example, to use the methods described here to identify where changes in mitochondrial morphology occur in the apoptotic cascade and in the demise of cells subjected to a variety of insults (Green and Reed, 1998). This would enable a noninvasive assay capable of predicting the fate of cells without exogenous fluorescent reporters or other labeling. Encouraging work along these lines using optical scatter imaging microscopy has just been reported by Boustany et al. (2004). The sensitivity of the angle-resolved scattering to mitochondrial morphology and the similarity between the EM appearance of the mitochondria undergoing a state 4 to state 3 transition shown by Hackenbrock (1966) and those of our Fig. 9 C suggest that these measurements could be useful in fundamental studies of mitochondria in intact cells. Although studies of these kinds and others could be performed in suspension as we have done, the applicability of the light scattering technique would be greatly expanded if it could be implemented using adherent cells. In this regard, it is encouraging that Bartlett et al. (2004) recently suggested that mitochondrial signatures may be detected in a reflectance geometry using polarized light spectroscopy.
Acknowledgments
The authors are grateful to Scott Gibson for help with the preparation of the isolated mitochondria and to Dr. Norbert Lange for the gift of ALA-hexylester. We thank Professor Nancy Oleinick for helpful discussions on the subject of mitochondrial swelling and cell death pathways and Karen Bentley for help with the electron microscopy.
This work was supported by National Institutes of Health grant CA68409 awarded by the National Cancer Institute.
David J. Calkins' present address is The Vanderbilt Eye Institute, Vanderbilt University Medical Center, Nashville, TN 37232.
References
- Backman, V., R. Gurjar, K. Badizadegan, I. Itzkan, R. R. Dasari, L. T. Perelman, and M. S. Feld. 1999. Polarized light scattering spectroscopy for qualitative measurement of epithelial cellular structure in situ. IEEE J. Sel. Top. Quant. Elect. 5:1019–1026. [Google Scholar]
- Bartlett, M., G. Huang, L. Larcom, and H. Jiang. 2004. Measurement of particle size distribution in mammalian cells in vitro by use of polarized light spectroscopy. Appl. Opt. 43:1296–1307. [DOI] [PubMed] [Google Scholar]
- Beauvoit, B., S. M. Evans, T. W. Jenkins, E. E. Miller, and B. Chance. 1995. Correlation between the light scattering and the mitochondrial content of normal tissues and transplantable rodent tumors. Anal. Biochem. 226:167–174. [DOI] [PubMed] [Google Scholar]
- Beuthan, J., O. Minet, J. Helfmann, M. Herrig, and G. Muller. 1996. The spatial variation of the refractive index in biological cells. Phys. Med. Biol. 41:369–382. [DOI] [PubMed] [Google Scholar]
- Bevington, P. R. 1969. Data Reduction and Error Analysis for the Physical Sciences. McGraw-Hill, New York.
- Bohren, C. F., and D. R. Huffman. 1998. Absorption and scattering of light from small particles. Wiley, New York.
- Boustany, N. N., R. Drezek, and N. V. Thakor. 2002. Calcium-induced alterations in mitochondrial morphology quantified in situ with optical scattering imaging. Biophys. J. 83:1691–1700. [DOI] [PMC free article] [PubMed] [Google Scholar]
- Boustany, N. N., Y.-C. Tsai, B. Pfister, W. M. Joiner, G. A. Oyler, and N. V. Thakor. 2004. BCL-xL-dependent light scattering by apoptotic cells. Biophys. J. 87:4163–4171. [DOI] [PMC free article] [PubMed] [Google Scholar]
- Brunsting, A., and P. F. Mullaney. 1974. Differential light scattering from spherical mammalian cells. Biophys. J. 14:439–453. [DOI] [PMC free article] [PubMed] [Google Scholar]
- Cross, D. A., and P. Latimer. 1972. Angular dependence of scattering from Escherichia coli cells. Appl. Opt. 11:1225–1228. [DOI] [PubMed] [Google Scholar]
- de Mesy Jensen, K. L., and P. A. di Sant' Agnese. 1992. Large block embedding and “pop-off” technique for immunoelectron microscopy. Ultrastruct. Pathol. 16:51–59. [DOI] [PubMed] [Google Scholar]
- Drezek, R., A. Dunn, and R. Richards-Kortum. 1999. Light scattering from cells: finite-difference time-domain simulations and goniometric measurements. Appl. Opt. 38:3651–3661. [DOI] [PubMed] [Google Scholar]
- Green, D. R., and J. C. Reed. 1998. Mitochondria and apoptosis. Science. 281:1309–1312. [DOI] [PubMed] [Google Scholar]
- Hackenbrock, C. R. 1966. Ultrastructural bases for metabolically linked mechanical activity in mitochondria. J. Cell Biol. 30:269–297. [DOI] [PMC free article] [PubMed] [Google Scholar]
- Kessel, D., and Y. Luo. 1999. Photodynamic therapy: a mitochondrial inducer of apoptosis. Cell Death Differ. 6:28–35. [DOI] [PubMed] [Google Scholar]
- Lam, M., N. L. Oleinick, and A. L. Nieminen. 2001. Photodynamic therapy-induced apoptosis in epidermoid carcinoma cells. J. Biol. Chem. 276:47379–47386. [DOI] [PubMed] [Google Scholar]
- Mourant, J. R., J. P. Freyer, A. H. Hielscher, A. A. Eick, D. Shen, and T. M. Johnson. 1998. Mechanisms of light scattering from biological cells relevant to noninvasive optical-tissue diagnosis. Appl. Opt. 37:3586–3593. [DOI] [PubMed] [Google Scholar]
- Mourant, J. R., T. M. Johnson, S. Carpenter, A. Guerra, T. Aida, and J. P. Freyer. 2002. Polarized angular dependent spectroscopy of epithelial cells and epithelial cell nuclei to determine the size scale of scattering structures. J. Biomed. Opt. 7:378–387. [DOI] [PubMed] [Google Scholar]
- Mourant, J. R., T. M. Johnson, and J. P. Freyer. 2001. Characterizing mammalian cells and cell phantoms by polarized backscattering fiber-optic measurements. Appl. Opt. 28:5114–5123. [DOI] [PubMed] [Google Scholar]
- Oleinick, N. L., R. L. Morris, and I. Belichenko. 2002. The role of apoptosis in photodynamic therapy: what, where, why, and how. Photochem. Photobiol. Sci. 1:1–21. [DOI] [PubMed] [Google Scholar]
- Packer, L. 1960. Metabolic and structural states of mitochondria. J. Biol. Chem. 235:242–249. [PubMed] [Google Scholar]
- Palade, G. E. 1953. An electron microscopy study of the mitochondrial structure. J. Histochem. Cytochem. 1:188–211. [DOI] [PubMed] [Google Scholar]
- Peng, Q., K. Berg, J. Moan, M. Kongshaug, and J. M. Nesland. 1997. 5-Aminolevulinic acid-based photodynamic therapy: principles and experimental research. Photochem. Photobiol. 65:235–251. [DOI] [PubMed] [Google Scholar]
- Perelman, L. T., V. Backman, M. Wallace, G. Zonios, R. Manoharan, A. Nusrat, S. Shields, M. Seiler, C. Lima, T. Hamano, I. Itskan, J. Van Dam, J. M. Crawford, and M. S. Feld. 1998. Observation of a periodic fine structure in reflectance from biological tissue: a new technique for measuring nuclear size distribution. Phys. Rev. Lett. 80:627–630. [Google Scholar]
- Press, W. H., B. P. Flannery, S. A. Teukolsky, and W. T. Vetterling. 1992. Numerical Recipes in C: The Art of Scientific Computing. Cambridge University Press, New York.
- Salzman, G. C., S. B. Singham, R. G. Johnston, and C. F. Bohren. 1990. Light scattering and cytometry. In Flow Cytometry and Sorting. M. R. Melamed, T. Lindmo, and M. L. Mendelshoh, editors. Wiley-Liss, New York. 81–107.
- Senior, A. E., S. E. McGowan, and R. Hilf. 1975. A comparative study of inner membrane enzymes and transport systems in mitochondria from R3230AC mammary tumor and normal rat mammary gland. Cancer Res. 35:2061–2067. [PubMed] [Google Scholar]
- Sokolov, K., R. Drezek, K. Gossage, and R. Richards-Kortum. 1999. Reflectance spectroscopy with polarized light: is it sensitive to cellular and nuclear morphology. Opt. Express. 5:302–317. [DOI] [PubMed] [Google Scholar]
- Wax, A., C. Yang, V. Backman, K. Badizadegan, C. W. Boone, R. R. Dasari, and M. S. Feld. 2002. Cellular organization and substructure measured using angle-resolved low-coherence interferometry. Biophys. J. 82:2256–2264. [DOI] [PMC free article] [PubMed] [Google Scholar]


