

Abstract
A cylindrical transmembrane molecule is constructed by linking hydrophobic sites selected from a coarse grain model. The resulting hollow tube assembly serves as a representation of a transmembrane channel, pore, or a carbon nanotube. The interactions of a coarse grain di-myristoyl-phosphatidyl-choline hydrated bilayer with both a purely hydrophobic tube and a tube with hydrophilic caps are studied. The hydrophobic tube rotates in the membrane and becomes blocked by lipid tails after a few tens of nanoseconds. The hydrophilic sites of the capped tube stabilize it by anchoring the tube in the lipid headgroup/water interfacial region of each membrane leaflet. The capped tube remains free of lipid tails. The capped tube spontaneously conducts coarse grain water sites; the free-energy profile of this process is calculated using three different methods and is compared to the barrier for water permeation through the lipid bilayer. Spontaneous tube insertion into an undisturbed lipid bilayer is also studied, which we reported briefly in a previous publication. The hydrophobic tube submerges into the membrane core in a carpetlike manner. The capped tube laterally fuses with the closest leaflet, and then, after plunging into the membrane interior, rotates to assume a transbilayer orientation. Two lipids become trapped at the end of the tube as it penetrates the membrane. The hydrophilic headgroups of these lipids associate with the lower tube cap and assist the tube in crossing the interior of the membrane. When the rotation is complete these lipids detach from the tube caps and fuse with the lower leaflet lipids.
INTRODUCTION
Membrane channels, pores, and transporters provide pathways for the transport of atoms or molecules across cellular membranes. Transporter (carrier) proteins generally present a wide range of motion by which a specific ion or molecule is preferentially transported across a membrane (Stacey et al., 2002). Peptide transport in plants, for example, takes place by the energy-dependent effort of several protein families (Stacey et al., 2002). Channels and pores on the other hand exhibit a relatively static structure as compared to transport proteins (Bayley, 1999). Channels generally do not have large-scale motions except for the opening and closing of the membrane pore. The composition of pores and channels share a common motif (Spencer and Rees, 2002); secondary structure assemblies come together to form a transmembrane tertiary structure with a gating mechanism that allows passage to specific molecules through the membrane (Bayley, 1999). Water, ions, and/or solute molecules may then diffuse across the central cavity of the pore or channel. Channels are generally smaller than pores and selective for ions of specific size and charge. For simplicity, channels and pores will be referred to collectively as “channels” throughout the article.
Successful attempts at synthesizing and incorporating both naturally occurring and synthetic structures into the membrane to observe and control channel activity have been made by various groups (Bayley, 1999). The idea behind this approach focuses on mimicking channel structure and function to understand the principles that drive their activity. There are several approaches for the synthesis of ion channels, which we classify into two main categories. The first involves transmembrane molecules designed from naturally occurring amino acids such as the LS2 and LS3 ion channels of DeGrado and co-workers (Zhong et al., 1998; Dieckmann et al., 1999). In this case the channels are largely composed of naturally occurring Lys and Ser residues that form alpha helices and are engineered to oligomerize through specific residue interactions. Another example in this approach involves the use of naturally occurring units to form synthetic structures as in the case of the Ghadiri tubular peptide assemblies. In this case alternating D and L amino acids are joined to make rings which can then self assemble into tubular stacks that form transmembrane structures (Hartgerink et al., 1998; Kim et al., 1998; Fernandez-Lopez et al., 2001; Asthagiri and Bashford, 2002). The second approach involves the synthesis of nonnaturally occurring compounds such as carbon nanotubes and the incorporation of such molecules into natural or synthetic membranes (Konig, 1997; Lee et al., 2002; Harrell et al., 2003). The selectivity of this construct can be adjusted for discrimination of specific molecules (Wang and Branton, 2001; Yeh and Hummer, 2004). As shown by Hummer and co-workers it may be possible to use nanotubes as channels for water or protons (Hummer et al., 2001). Simulations of model membranes, nanotubes, and water have shown that the diffusion of water through a hydrophobic pore has a dependence on the radius of the pore (Beckstein et al., 2001; Zhu et al., 2004). The advantage of the synthetic approach lies in that channel occupancy and conductivity could in principle be tuned by modifying the local channel environment (Berezhkovskii and Hummer, 2002). In principle, properties such as tube polarity, local hydrophilicity, and rigidity would be controlled by means of incorporating functional groups into the synthetic channel (Bayley 1999). The creation of nanoscale devices such as nanosyringes or nanosensors of controlled functionality comprise a field where theoretical modeling could provide insights to be used in a design strategy.
Antimicrobial peptides are an important class of transmembrane molecules, which have activity at the membrane level. Such molecules are present in many vertebrates and invertebrates (Zasloff, 2002). Many antimicrobial peptides have been identified since the first magainins were observed in the late 1980s (Andreu and Rivas, 1998). The overall structure of antimicrobial peptides can be strikingly similar throughout different organisms (Hoffmann et al., 1999). In general, antimicrobial peptides can be either linear or cyclic peptides which are relatively small and exhibit some type of membrane destabilizing activity (Andreu and Rivas, 1998). Families of these peptides include magainins, cecropins, defensins, and drosomycins (Andreu and Rivas, 1998). Several general structural features are shared by these types of antimicrobial peptides. Linear peptides, for example, have hydrophobic domains commonly accompanied by some positively charged residues which are thought to interact with negatively charged target membranes. In the case of magainins and melittins these positively charged groups have been shown to be essential for antimicrobial activity (Zasloff, 1987). An increase in permeability of the target membrane is the general mechanism of action for antimicrobials, although more complicated pathways are known in some families (Zasloff, 2002). Mechanisms of penetration and oligomerization have been proposed (Huang, 2000; Bechinger, 2001). Work by Huang and co-workers has shown that the protein-lipid assemblies have a structure that is dependent on the antimicrobial molecule (Yang et al., 2000, 2001).
Molecular motions in lipid membranes span a wide range of timescales, from bond vibrations at the femtosecond level, to membrane fusion and transbilayer lipid flips at the microsecond or longer timescale. Theoretically, phenomena with the fastest motions are studied by different methods, including ab initio dynamics and classical dynamics simulations. These studies provide insight into the atomistic structure and function of the membrane and membrane associated proteins. Other events, at slower timescales, such as membrane fusion, active transport across membranes, and peptide insertion into the membrane, are not suitable for studies with current ab initio or classical molecular dynamics simulations as they span scales that are of an order of magnitude larger than the largest studies to date (hundreds of nanoseconds to a few microseconds). An alternative approach, such as a mesoscale coarse grain model, is applicable and suitable to study such events. Such models have already been applied to study phospholipid bilayer behavior (Goetz and Lipowsky, 1998; Shelley et al., 2001; Pastor et al., 2002). The choice of interaction sites, which describe the basic units of the coarse grain model, and the parametrization of such sites lies at the heart of the coarse grain approach. At still larger scales a continuum treatment of the bilayer as a flexible, elastic sheet is often used. Connections between the continuum and molecular descriptions are made by comparing the power spectra associated with various fluctuation modes of the bilayer membrane. Multiscale simulations that employ several levels of description would be useful in treating, for example, an ion channel in full detail while using a reduced description to treat the lipid and water molecules located more than a few solvent shells away from the channel. Such mixed treatments are largely unrealized in the literature.
In the coarse grain model employed in this study, 13 site lipid molecules (see Fig. 1) have been parameterized to reproduce the properties of a fully hydrated dimiristoyl-phosphatidyl-choline (DMPC) lipid bilayer in a semiquantitative manner. The coarse grain approach aims to reproduce important all-atom simulation data by reducing the level of description into statistically weighted interaction sites (Nielsen et al., 2004b).
FIGURE 1.

Comparison of coarse-grain and all-atom representations of the lipid DMPC.
This study deals with the simulation of a transmembrane model channel inspired by previous theoretical and experimental studies of ion channels, antimicrobial peptides, and synthetic peptides. These results expand on and provide more quantitative detail of our earlier report (Lopez et al., 2004) and aim to provide a broad picture of the behavior and dynamics of such molecules at the mesoscale level. One quantitative detail presented in this article is the computation of the free-energy profile of water transport through the transmembrane channel. Free-energy methods such as steered molecular dynamics (SMD) and constrained molecular dynamics (CMD) in combination with coarse grain MD can provide information on the probability and rate of processes with even longer timescales than the ones mentioned above. In our unbiased coarse-grain simulations, water transport through the transmembrane channel is sporadically observed. This allows us to compare the free-energy profile obtained with SMD and CMD with an estimate from a very long (brute force) simulation.
METHODS
Overview of the coarse-grain approach
These simulations were carried out using a previously developed coarse grain model for lipid and water molecules (Shelley et al., 2001; Nielsen et al., 2004b). Briefly, atomic sites are combined into coarse-grain sites to form a coarse grain representation of molecules as shown for cgDMPC in Fig. 1. In this cgDMPC model, one site is parametrized to represent the choline group, whereas another site represents the phosphate group. These two sites carry positive and negative electrostatic charges of equal magnitude. The glycerol chain atoms are grouped into another site as is the carboxylic carbon with its surrounding atoms. The acyl tail atoms are grouped such that three carbon atoms and their associated hydrogens are clustered into a single site. Three loosely packed water molecules are represented by one coarse grain water site (Ws).
We have been able to reproduce previous simulation results with a significant gain in efficiency. This speed up comes from two sources: first, from the actual decrease in CPU calculation time, and second, from an inherent increase in the mobility of the coarse grain particles due to the potential functions used to parameterize the interaction sites.
In the first case the gain is straightforward; this model decreases the number of sites by an order of magnitude, which in turn results in two orders of magnitude fewer pairwise interactions as compared to all-atom representations. Furthermore, once the reduced description is used, the potential energy functions become slowly varying when compared with their all-atom counterparts. Since the resulting forces are much smoother than in an all-atom calculation, and the masses are bigger, a larger time step may be employed to integrate the equations of motion. We routinely employ a 10–20 fs time step, which is an order of magnitude larger than is typical in all-atom simulations.
The particle mobility is enhanced due to the smoother interaction potentials. The particles tend to diffuse faster than their all-atom counterparts. As shown in previous work, the coarse grain lipid molecules diffuse two orders of magnitude faster. The overall dynamics of the coarse-grain model must therefore be tuned to that of the all-atom model. We employ the diffusion as a means to estimate the overall dynamical timescale of the coarse grain molecules as compared to their all-atom representation. This scaling has been used in all the times reported in this study. A rough estimate of the overall gain in simulation efficiency is therefore five orders of magnitude when compared to the corresponding all-atom simulation. Note, however, that a different property could have been used to perform the timescaling. For example, the diffusional speedup of a bulk alkane liquid (namely a liquid consisting solely of the lipid tails) is only one order of magnitude. Furthermore, we have characterized the rotational diffusion coefficients for both atomistic and coarse grained DMPC bilayers and the speedups vary from one to two orders of magnitude. For a detailed discussion see Nielsen et al. (2004b).
Construction of the coarse grain tubes
Inspired by the work of Ghadiri (Fernandez-Lopez et al., 2001) and Hummer (Hummer et al., 2001), we created a model that could both represent a transmembrane peptide with a hydrophobic core (as is common in many ion channels) as well as a tubelike molecule or nanotube. We use a hydrophobic site (SM) from the coarse grain model which represents three bonded methylene segments as the generalized site for the construction of our model tube. Two cylindrical moieties are constructed for the purpose of the simulations. The first consists of purely hydrophobic sites (HBT), whereas the second includes hydrophilic caps at both ends (HBTC). In both cases, six rings consisting of eight hydrophobic sites are stacked in a staggered manner and joined by bonds with an equilibrium length of 5 Å. The force constants of these bonds and of the bending potentials are chosen to be stiff to restrain the tube from distorting from its original shape. In the case of the hydrophilic capped tube the hydrophobic rings are flanked by eight membered rings constructed from coarse grain water sites with an equilibrium bond length of 5 Å. In all, the tubes consist of 48 sites in the case of the hydrophobic tube, and 64 sites in the case of the hydrophilic tube as shown in Fig. 2. The hydrophobic length of the first tube was chosen to match the hydrophobic length of the lipid bilayer. The second tube was built with an additional matching to the hydrophilic headgroups of the bilayer. Hydrophobic/hydrophilic matching has been shown previously to be important for transmembrane proteins (Ridder et al., 2002).
FIGURE 2.
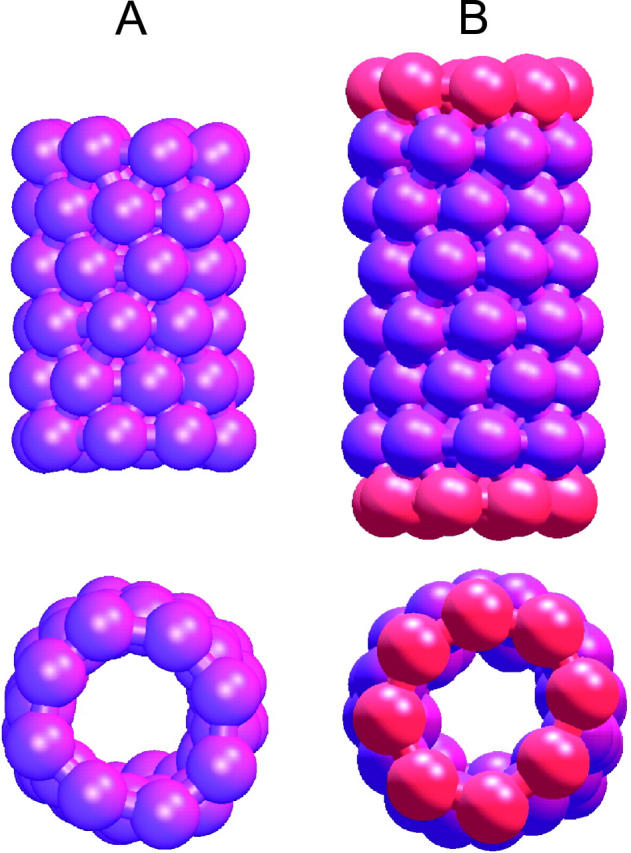
Comparison of a purely HBT (panel A) and an HBTC (panel B). Hydrophobic sites are shown in purple and hydrophilic sites in red.
Each ring of the tube consists of an octagon with a bond size of 5 Å between sites, which results in a radius of 6.5 Å. The van der Waals radius of the Ws and SM site is 5 Å. This leaves a space of ∼8 Å in the middle of the tube for diffusion of species within the tube.
Simulation details
For this study, we conducted three types of simulations: two equilibration runs (labeled 1A and 1B), two spontaneous insertion runs (2A and 2B) and a number of free-energy calculations (3). The first simulation (1A) consists of a 256 coarse grain cgDMPC lipid bilayer, 2192 Ws, and a 48-site hydrophobic tube (HBT) embedded within the membrane. The second simulation (1B) is identical except that the tube used is the 64-site hydrophobic tube with hydrophilic caps (HBTC). The initial configuration of the second type of simulations consists of, respectively, an HBT (2A) and a HBTC (2B) placed on top of the membrane rather than embedded in the membrane. The setup of free-energy simulations was inherited from simulation 1B and is detailed below.
All simulations employ the same methodology for the molecular dynamics run. The CM3D implementation of molecular dynamics (MD) has been reported previously for lipid bilayers consisting of 1024 cgDMPC molecules (Lopez et al., 2002b). The MD simulations were conducted in the constant pressure, temperature, and number of particles (NPT) ensemble using Nosé-Hoover chains of length 4 for both thermostats and barostats. Multiple time steps molecular dynamics were implemented using a three-stage RESPA integration of the equations of motion(Tuckerman and Martyna, 2000). The cutoff for the van der Waals potentials was set to 15 Å whereas that for the real-space part of the Ewald calculation was 18.7 Å. The simulations used a flexible orthorhombic cell and periodic boundary conditions in three dimensions.
Tube in a lipid bilayer
A cavity was built in a preequilibrated lipid bilayer consisting of 256 coarse-grain cgDMPC molecules and 2192 Ws. The methodology for constructing cavities in lipid bilayers is detailed in a previous study to which readers are referred (Lopez et al., 2002a). Briefly, nonself-interacting Lennard-Jones spheres of a very small radius (∼1 Å or less) are linked and placed within the membrane. The radius of the spheres is steadily increased until the induced cavity provides enough room for the HBT structure. The HBT was then embedded in the cavity perpendicular to the membrane surface and constrained in position while the lipids reaccommodate. All constraints are then released and equilibration in the NPT ensemble as described above was carried out followed by a data collection run of 100 ns. This run was labeled 1A. The HBTC tube was introduced into the membrane in an analogous manner. This simulation was run for 66 ns and was labeled 1B.
For the insertion runs, we placed the HBT in the water subphase of a box containing a preequilibrated, fully hydrated, bilayer with 256 cgDMPC and 4263 water molecules. More water was necessary for this simulation to avoid the interaction of the tube with the periodic images of the membrane. This is a general concern in multilamellar systems where stacked membranes are close together (Zheng et al., 2001). The tube is initially oriented parallel to the membrane and ∼15 Å away from the nearest bilayer surface. The data collection phase begins with the HBT closer to the surface because some diffusion occurs during the equilibration phase. The simulation was run for a total of 80 ns and labeled 2A. The same procedure was followed for the capped HBTC tube. The simulation was run for a total of 80 ns and labeled 2B.
Free-energy methods
For the study of the transport of water through the transmembrane tube, we used a smaller system to reduce the computational expense of the free-energy calculations. That is, the original system of 2192 water sites, 256 lipids, and one tube (corresponding to the system used in run 1B) is reduced in size to 382 water sites, 32 lipids, and one tube by removing lipids and water which are far from the tube. The free energy is estimated for the original system to demonstrate that the nature of the process remains unchanged. We compare three methods to compute the free-energy profile of water transport along the long (vertical) axis of the tube, namely: “brute force”, constrained MD, and steered MD. With the first method, the free energy is estimated from an equilibrium simulation by constructing a probability distribution of the vertical distance of water sites from the center of the tube. The free energy is then simply (−kT) times the logarithm of this distribution. This is done both for an equilibrium simulation of the original system and for the small system. Secondly, constrained MD runs are performed to calculate the free-energy profile. Forty simulations of 4.5 μs each were performed by attaching a particular water site from the tube center to a fixed value with a harmonic spring of stiffness 100,000 K/Å2 (= 13,800 pN/Å = 831 kJ/mol/Å2). The 40 constraint values used are −19 Å, −18, … −1, 0 and 0.5, 1.5, … 19.5 Å. The resulting mean force of constraint versus distance curve (shown in Fig. 3) is integrated to yield the free-energy profile. For the third free-energy method, steered MD, a particular water site was pulled multiple times with constant velocity through the embedded tube, to estimate the free energy. Initial conditions were drawn from an equilibrium simulation where the water site was constrained to be −2 Å vertical distance from the tube center and 10,000 frames at 225 ps intervals were stored. One of these frames was used to launch a single pulling run at a velocity of 0.005 Å/ns. Ten of these frames were used to launch ten pulling runs each at a velocity of 0.05 Å/ns. One hundred of these frames were used to launch one hundred pulling runs each at a velocity of 0.5 Å/ns. Every tenth frame was used to launch 1000 pulling runs each at a velocity of 5 Å/ns. Finally, each frame was used to launch 10,000 pulling runs each at a velocity of 50 Å/ns. In every case the reaction coordinate was linked to the pulling coordinate with a harmonic spring of stiffness 100,000 K/Å2 (= 13,800 pN/Å = 831 kJ/mol/Å2). The total pulling distance was 21 Å (from −2 Å to 19 Å) in every case. The simulations at the five different pulling velocities each take two weeks of single-processor CPU time. The stiff spring approximation of Park and Schulten (Park et al., 2003) is used to extract the free energy based on the first order cumulant expansion formula, the second order cumulant expansion formula, and the full exponential (infinite cumulant) formula (Park et al., 2003).
FIGURE 3.

Mean forces of constraint from the 40 constrained runs of 4.5 μs each. Error bars are assigned from the standard deviation of the mean in each of 20 consecutive 225-ns windows. The constraint is imposed by tethering the reaction coordinate to a fixed value with a harmonic spring of stiffness of 13,800 pN/Å (831 kJ/mol/Å2). A cubic spline is fit to the data as shown to calculate the integral. Note that 600 K = 5.0 kJ/mol.
DISCUSSION AND RESULTS
Hydrophobic tube in a cgDMPC bilayer (1A)
Throughout the simulation, the HBT remains within the membrane and no major structural changes are observed for the lipid membrane or the HBT species. We observe water diffusion across the tube in rare instances, although water molecules populate the first quarter of the tube on both ends throughout the run. There are never more than two water molecules in the mouth of the tube, although water molecules can “push” each other further into the tube. The tube diameter is only large enough to accommodate a single column of water sites. A snapshot of water molecules inside the tube, diffusing across the membrane, is shown in Fig. 4 a. See “Free-energy profile of water in the tube” for a discussion of the free-energy profile for water traversing the tube.
FIGURE 4.

Snapshots of an HBT (purple) in a cgDMPC bilayer as Ws (blue) passes across the HBT (panel A) and after a lipid tail (yellow) blocks the HBT (panel B). Choline is shown in red, phosphate in purple and the phosphate and glycerol in dark blue.
Near the end of the simulation, after ∼80 ns, a lipid tail diffuses into the tube effectively blocking the end of the tube. The tube therefore becomes solvated by the acyl lipid tails and water may no longer diffuse across the membrane (Fig. 4 b). The simulation was terminated shortly after this event.
The angular fluctuations between the bilayer normal and the long axis of the tube are shown in the top panel of Fig. 5. The tube oscillates but remains approximately perpendicular to the bilayer surface throughout the run. Complete submergence of the tube into the hydrophobic core of the membrane would seem more favorable. Apparently the initial perpendicular orientation provides a local minimum from which the tube is unable to escape during the simulation. However, in “Insertion of a hydrophobic tube into a bilayer”, where the tube begins outside of the membrane and is allowed to spontaneously insert, the final state is indeed observed to be the expected parallel orientation (see Fig. 14).
FIGURE 5.

Oscillations of the tilt angle of the tube long axis with respect to the bilayer normal for HBT (top: run 1A) and HBTC (bottom: run 1B) embedded in a cgDMPC bilayer. The corresponding time accumulated histograms of the angles are embedded in each graph.
FIGURE 14.

Illustrative snapshot of the HBT submerged in the hydrophobic core of the membrane after spontaneous insertion in run 2A.
Hydrophobic tube with hydrophilic caps in a cgDMPC lipid bilayer (1B)
From the previous simulation it can be inferred that a hydrophobic tube embedded in the membrane is not sufficient to allow for the continuous passage of water molecules across the membrane. Modifications are necessary to allow for the continuous flow of water, or at least for the formation of a pore that does not get occluded by lipid tails. We therefore considered hydrophobic-hydrophilic matching more carefully. The HBT closely matches the hydrophobic length of the membrane. The tails are excluded from the HBT volume but the headgroups are free to bend over onto the tube. The fluctuations arising from this headgroup flopping at the HBT/water interface presents an erratic environment for approaching waters and promotes oscillations of the angle between the long axis of the tube and the bilayer. A hydrophilic ring was therefore added at the top and bottom of the tube to emulate the functionality of a hydrophilic cap (the HBTC tube).
A plot of the oscillations of the long axis of the tube with respect to the bilayer normal is shown in the bottom panel of Fig. 5. From this figure it is readily apparent that the tube with the caps oscillates much less than the HBT (top panel of Fig. 5) suggesting that the caps anchor the tube in a transbilayer orientation.
The tube remains in approximately the same position normal to the bilayer throughout the run as is evident from the weighted atom density profile of Fig. 6. These profiles are akin to electron density profiles in that they are obtained from the number of electrons that correspond to each coarse grain site. It is important to note that the overall behavior of the sites, as compared to real atoms, is captured in an average manner.
FIGURE 6.

Density profile of the lipid (line) water (dot-dash) and HBTC tube (dash) for simulation 1B. The tube remains anchored at the lipid water interface throughout the run.
From Fig. 6 it is observed that the HBTC caps are anchored at the headgroup water interface. This interface is not sharp; the water penetrates into the headgroup region of the membrane. However, this is not indicative of water penetration into the tube itself. Notice that the lack of water density in the middle is indicative of the rarity of diffusion events across the tube although these events do occur as shown in Fig. 7. A continuous column of water sites across the membrane would result in some density of water near the middle of the bilayer. With this model a continuous wire of Ws sites is not possible because these sites do not include the necessary partial charges. The periodic density of the HBTC is indicative of a static position within the membrane with minor smearing due to rattling along the bilayer normal.
FIGURE 7.
Snapshot of water (blue) diffusing across the HBTC tube embedded in a cgDMPC bilayer. The hydrophobic part of the tube is depicted in purple, and the hydrophilic caps in red. The lipid tails (yellow), phosphate unit (purple), choline unit (red), and glycerol and ester groups (dark blue) are shown semitransparent.
Our simulations are run in the NPT ensemble where the orthorhombic box size is adjusted separately in all three directions, which does not permit a nonzero surface tension to develop. Nevertheless, the surface tension and the area per headgroup have a well-established relationship that allows us to talk about a local surface tension in what follows. The analysis of the change in area per headgroup of the individual lipids with distance from the tube is presented below both to examine the packing and as a way to explore the change in surface tension.
In Fig. 8, we examine the packing of the lipids around the tube through the use of Voronoi diagrams. The two-dimensional Voronoi polygons corresponding to a particular leaflet have as their centers the lipid centers of mass (COM) projected onto the bilayer plane. The polygon region of a particular lipid consists of all the points that are closer to that lipid COM than to any other lipid-projected COM. The area of the tube in the bilayer plane is 316 Å2 and the average area of the lipids in the first shell surrounding the tube is 64 Å2. The lipids in the second shell have a larger area with a value of 69 Å2 and the lipids in the remainder of the leaflet have an area per headgroup of 70 Å2. This value of 70 Å2 of the lipids far from the tube is equal to the mean area per lipid in an undisturbed (pure) lipid bilayer model; this differs from the experimentally known value and represents an inaccuracy in the CG model. From this analysis we see that the lipids tend to pack more tightly around the tube seemingly as a result of their direct interaction with HBTC.
FIGURE 8.

Voronoi diagram for the tube atoms and lipid centers of mass for one leaflet snapshot halfway through simulation 1B. The tube points (•) and lipid points (○) are shown for each polygon. The first lipid shell (cyan) and second shell (orange) have a different packing as discussed in the text.
We observe diffusion of water across the membrane during the simulation. In addition we see that water populates the entrance to the tube more than in the hydrophobic tube case. The diffusion of water molecules across the tube is again a rare event, and we only see a few molecules shuttle across the membrane throughout the run. The smaller amplitudes of the HBTC tilt with respect to the membrane plane as compared to the previous simulation and the lack of interaction of the acyl tails with the hydrophilic caps dictate that this structure will preferentially stay in the perpendicular configuration across the membrane throughout the run. Placing the caps at the ends of HBT to make HBTC results in a tube that conducts water molecules and does not become blocked. The blockage of HBT by the lipid tails is possible even on short timescales, a problem for molecules that could need transmembrane functionality such as nanosyringes or antibiotics. We predict that, in general, synthetic molecules will have to be tuned to have the correct hydrophobic match and favorable hydrophilic interactions with the headgroups of a lipid bilayer to remain in a perpendicular configuration with respect to the bilayer plane. This will also result in less pore blockage due to the lipid tails interacting with the lumen of the pore.
The energetics of transport across the transmembrane HBTC is explored in “Free-energy profile of water in the tube”. The motivation for this comes in part from previous work by Hummer and Sansom and their respective co-workers where a nanotube or hydrophobic cylinder in a model membrane are studied and the critical radius for diffusion is determined (Beckstein et al., 2001; Hummer et al., 2001). In these cases the all-atom water species are observed to form water wires or groupings of water molecules populating the inside of the tube. In our case, due to the nature of the model, hydrogen bonds are missing. For this reason the formation of water wires is intrinsically impossible. One would imagine however, that in an experimental setup with molecular sizes similar to the ones presented in this work, water molecules would be able to diffuse across the center of the pore. As shown in previous work the conductivity and selectivity of these pores can be controlled by means of functional groups or pore radius (Bayley, 1999). The results of a simulation with a coarse grain model that describes these systems would be a good starting point for an all-atom simulation to examine the conduction of water through a pore in detail.
Free-energy profile of water in the tube (3)
The free energy profile of water inside the tube as a function of the vertical distance from the tube center is given in Fig. 9. The CG water site is a Lennard-Jones particle and so we do not observe water wires or other such structures that require hydrogen bonding. The diameter, length, and hydrophobicity of the tube will influence the free-energy profile (Beckstein et al., 2001). We did not attempt to characterize the dependence on these parameters—this could be done in a complementary study. The tube is not uniform but rather is composed of eight rings. The location of these rings is marked in Fig. 9 by dots on the x axis. To the inside of every ring location (i.e., in the direction of the tube center), we see a shoulder in the free-energy profile due to the unfavorable region in the plane of the narrow ring. The outermost rings are hydrophilic, resulting in local minima above and below the ring plane. The free energy is characterized to a remarkable accuracy: note that 1 kcal/mol = 503 K. The free-energy is estimated by three different methods as shown in Fig. 9. An equilibrium simulation can yield an estimate of the free-energy profile if the energies along the reaction coordinate are thermally accessible; in this case water is indeed observed to populate the tube so that one can attempt to obtain enough statistics to measure the free-energy profile. The brute-force data is noisy near the center of the tube because water is rarely observed there. Nonetheless, an estimate of the full free-energy profile is possible. This is shown in Fig. 9 along with the same analysis for the original (large) system (as was used in simulation 1B). The good agreement between the two equilibration runs demonstrates that we did not alter the physical picture of water in the tube by using the smaller unit cell (see the Methods section). The agreement of the free-energy profiles obtained from the equilibration runs with those from the constrained MD and steered MD free-energy methods is remarkable.
FIGURE 9.

Free energy of water in the tube calculated with three different methods: constrained MD, equilibrium simulations, and steered MD (see the text for details). The solid circles indicate the average positions of the eight rings of the tube. Only relative energies are meaningful: the absolute scale is arbitrary. Note that 1000 K = 8.3 kJ/mol.
Immediately outside of the tube (i.e., beyond a vertical distance of −15 and 15 Å from the center) is a mixture of water and lipid headgroups, and farther outside is the bulk water region of the lamellar Lα lipid phase. As seen in Fig. 6, water penetrates the bilayer to a significant extent up to 10 Å around the tube. However, because we are interested in the free-energy profile of water transport through the tube, we only histogram the water sites that are inside the tube, for vertical distances between −15 and 15 Å. Outside this range, we see a steep decrease of the free energy that only reaches a plateau value (data not shown in the figure) due to the confined volume of the unit cell. This value depends on the size of the simulation box in analogy to the free energy of an ideal gas being proportional to (the logarithm of) the volume of the box: the small and large systems hence have different values. Furthermore, the SMD and CMD free-energy simulations only collect statistics on one water site; this site must have time to diffuse over the entire accessible volume slab at a given vertical distance from the tube center if it is to capture this volume effect. The SMD and CMD simulations are not run nearly long enough to allow for diffusion over this length scale, hence the discrepancy with the equilibration runs far from the tube center. We do not attempt to correct for this behavior and therefore we do not take the bulk water region as the reference state for the free-energy scale; rather the scale is referenced to the value at a distance of 12 Å, an arbitrary choice which has no physical significance.
The distribution of work values for the pulling runs at a distance of 5 Å are shown in Fig. 10. As expected, the distributions shift to higher mean values and lose their Gaussian nature as the pulling speed increases. Non-Gaussian behavior is characterized by a discrepancy between the second order cumulant and full exponential estimates of the free energy. This is not a problem for the lower pulling velocities as shown in Fig. 11 and Fig. 12. For a pulling speed of 5 Å/ns (see Fig. 13), the first order cumulant estimate is extremely poor; this means that we are not at equilibrium. However, the second order cumulant estimate is quite good, indicating that we are possibly still within the linear response regime, although the full exponential estimate differs from the second order cumulant estimate. The free-energy profile estimated from the fastest pulling velocity (50 Å/ns) is poor and is not shown.
FIGURE 10.

Distribution of work values for different pulling speeds at a vertical distance from the tube center of 5 Å, starting from an equilibrium distribution constrained at a vertical distance from the tube center of −2 Å. Notice that the distribution corresponding to the fastest pulling speed is non-Gaussian. The distributions have all been scaled so that their maximum value is assigned a probability density of one. Note that 1000 K = 8.3 kJ/mol.
FIGURE 11.

Free energy of water in the tube estimated with 10 steered MD simulations at a constant velocity of 0.05 Å/ns. The overlap of the second order and full exponential estimates indicates that the distribution of work values is Gaussian. Note that 1000 K = 8.3 kJ/mol.
FIGURE 12.

Free energy of water in the tube estimated with 100 steered MD simulations at a constant velocity of 0.5 Å/ns. Note that 1000 K = 8.3 kJ/mol.
FIGURE 13.

Free energy of water in the tube estimated with 1000 steered MD simulations at a constant velocity of 5 Å/ns. Note that 1000 K = 8.3 kJ/mol.
To put the free-energy profile shown in Fig. 9 into perspective, we also calculated the free-energy profile for water permeation across the lipid bilayer. Using the symmetrized steered MD technique of equation 17 in (Hummer, 2001) with 8 trajectories, each with a pulling velocity of 0.2 Å/ns, we find a free-energy barrier of 2500 ± 240 K (20.8 ± 2.0 kJ/mol). This compares favorably with the most recent literature value of 22.9 ± 1.9 kJ/mol, which was computed from a fully atomistic MD simulation (Bemporad et al., 2004). The free-energy barrier for water permeation is thus lowered by a factor of 2.5 after insertion of our model tube. Clearly caution should be exercised regarding observations about water transport given that the coarse graining is done over length scales larger than that of an individual water molecule. The comparison between permeation through the bilayer itself and through a transmembrane pore is done at the same level of description and so has some significance, perhaps more for a small neutral hydrophilic species rather than for water.
Insertion of a hydrophobic tube into a bilayer (2A)
A purely hydrophobic tube was placed above the membrane and allowed to insert. The tube submerges into the hydrophobic core of the membrane to become solvated and occluded by the lipid tails. The long axis of the tube remains approximately parallel to the bilayer plane throughout this process (see Fig. 14 for a snapshot). This orientation is expected to be favorable because of the completely hydrophobic nature of the tube. In the discussion of the preinserted run, 1A, (see “Hydrophobic tube in a cgDMPC bilayer”) we noted that the HBT remains near its initial perpendicular orientation, and was not seen to rotate spontaneously to this more favorable submerged state on the timescale of the simulation.
Insertion of a hydrophobic tube with hydrophilic caps into a bilayer (2B)
The HBTC is placed on the membrane as described in “Methods”. The data collection phase of the simulation begins when the tube is close to the membrane (Fig. 15 A1). The equilibration of this system is difficult because holding the tube fixed and allowing the remainder of the system to relax invariably results in the membrane and the tube drifting toward each other and forming a meniscus (the tube is in an unfavorable environment).
FIGURE 15.

Snapshots (left) and Voronoi diagrams (right) for the evolution of the insertion and rotation of the HBTC into the bilayer (simulation 2B). The Voronoi diagrams on the right depicting the first (cyan) and second (orange) solvation shells are shown. The color scheme for the snapshots is the same as in Fig. 7.
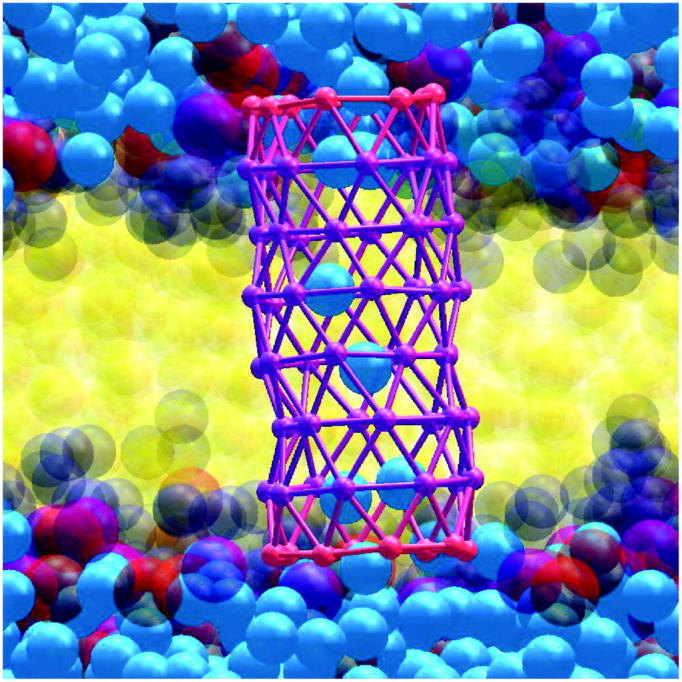
When the HBTC is close to the membrane, the bulk Ws-HBTC interaction is repulsive and anisotropic due to the presence of the membrane. This repulsion in conjunction with an attractive HBTC-membrane van der Waals interaction drives the HBTC toward the membrane. The tube then plunges into the membrane in a lateral orientation, almost perpendicular to the bilayer normal as shown in Fig. 15 B1. During this process some lipids become attached to the ends of the tube. Two key lipids, depicted in orange in Fig. 15 C1, chaperone the HBTC lower cap through the acyl tail region as it rotates to align perpendicular to the membrane. The tube rotation allows its hydrophobic core to become solvated by the lipid tails. This, however, implies that the hydrophilic cap in the core of the bilayer (Fig. 15 C1) is in an unfavorable environment along with the chaperone lipids, which remain attached due to the interaction between the lipid headgroups and the tube caps. As the rotating end of the tube approaches the opposite leaflet, the chaperone lipids help the HBTC finish its rotation. Fig. 15, D1 and E1, show the tube in the final stages of its rotation. After the rotation is completed the chaperoning lipids join the lower leaflet and the tube remains perpendicular throughout the remainder of the simulation.
We follow the insertion process by plotting the atom weighted density profiles as shown in Fig. 16, a–d, and the tilt angle as shown in Fig. 17. In Fig. 16 a, the tube starts to penetrate the membrane. Fig. 16 b shows the tube almost fully inside the membrane but still parallel to the membrane plane. In Fig. 16 c the tube has begun to rotate toward the far (lower) side, shown here in a configuration that is diagonal to the normal of the bilayer. Finally in Fig. 16 d the tube has assumed its transmembrane orientation and we see that the positions of the hydrophilic caps overlap the peaks of the phosphate and choline groups. This final picture is similar to the situation of the previous section where HBTC was initially embedded in the membrane.
FIGURE 16.

Evolution of the density profile of the lipid (line), water (dot-dash), and HBTC tube (dash) system as HBTC submerges and rotates into a cgDMPC lipid bilayer (simulation 2B).
FIGURE 17.

Evolution of the tilt angle between the long axis of HBTC and the bilayer normal throughout HBTC insertion (simulation 2B). The tube begins parallel to the bilayer plane and rotates to become perpendicular to the bilayer plane in a transmembrane conformation. The inset shows the normalized angle histograms.
The tilt angle of the tube throughout the simulation is plotted in Fig. 17. The initial orientation of the tube is approximately parallel to the bilayer surface. As the system evolves, at ∼10 ns, we see an abrupt change in the tilt angle from an angle of 80°. After ∼35 ns of simulation time there is another major change where the value of the angle goes from almost 90° to ∼60°. The rotation from this point on occurs steadily until the tube is finally perpendicular to the membrane plane.
We again calculate the instantaneous area per headgroup at different stages of the simulation to gain an understanding of the local changes in lipid available area and surface tension. The calculations of the area per headgroup are performed with Voronoi diagrams as shown in Fig. 15. The points represent the center of mass of the lipids in the near leaflet relative to the tube or the points of the atoms in the tube (as specified in the plot). The values of the area per headgroup at different stages throughout the simulation are summarized in Table 1.
TABLE 1.
Values of the projected area per headgroup (in Å2) for different snapshots of HBTC insertion into a cgDMPC lipid bilayer
| Time | HBTC area | Area of 1st shell | Area of 2nd shell | Other lipids |
|---|---|---|---|---|
| 1 ns | - | 61.0 | - | - |
| 20 ns | 703.6 | 48.6 | 66.6 | 66.6 |
| 40 ns | 792.1 | 53.7 | 68.6 | 67.2 |
| 60 ns | 529.1 | 59.5 | 69.0 | 68.2 |
| 80 ns | 384.4 | 56.1 | 72.5 | 69.9 |
The times correspond to the snapshots in Fig. 15.
The cyan shaded area in Fig. 15 A2 depicts the lipids closest to the tube before insertion. A snapshot corresponding to this situation is shown in Fig. 15 A1. As the tube approaches the membrane some of the lipids move laterally to accommodate it. The area per headgroup of these lipids therefore changes reflecting the rearrangement of the lipids to accommodate the tube.
Fig. 15, B1 and C1, show two intermediate points at 10 ns and 20 ns of the simulation. As seen in Fig. 15 B1, the tube enters the membrane in a lateral orientation and some of the lipids have been displaced. This insertion is compatible with a carpetlike description of peptide insertion into a membrane. As shown in Table 1 and Fig. 15, B2 and C2, the lipids in the cyan area are squeezed to a lower area per headgroup than their undisturbed value, whereas the remaining lipids in the orange area and the white area have an area per headgroup somewhat lower than their undisturbed value; a consequence of the space taken by the tube. The snapshot in Fig. 15 B1 provides a view of the tube after immersion into the membrane. The lipid tails wrap around the tube and the lipid headgroups move away from the immersing tube. The hydrophilic cap of HBTC is shown with the chaperon lipid molecules in orange in this figure. Fig. 15 C1 shows a snapshot midway through the rotation of the tube after immersion into one of the leaflets.
Fig. 15, D2 and E2, show two configurations, one where the tube is transverse to the bilayer normal (Fig. 15 D1) and one where the tube is perpendicular to the bilayer normal (Fig. 15 E1). In both cases the area per headgroup of the lipids around the HBTC differs from the undisturbed value as shown in Table 1. The area per headgroup of the lipids shaded in cyan, in the first shell around the tube, is ∼10 Å2 smaller than the average value for the equilibrated pure bilayer. The orange and white areas of the snapshots however have values nearly equal to the undisturbed equilibrium lipid. Fig. 15 D1 and Fig. 15 E1 show the snapshots corresponding to the plots of Fig. 15, D2 and E2. From Fig. 15 D1 it is possible to see that the orange tagged lipids that were associated with the tube are diffusing into the bulk lipid monolayer. In Fig. 15 E1 the tube is completely perpendicular to the bilayer and one of the tagged lipids has diffused to the opposite side of the simulation cell.
Perhaps the most interesting finding of our simulation from a biochemical point of view is the transport across the bilayer of the tube hydrophilic cap facilitated by two associated lipids. This work suggests that it is possible to have tubelike molecules, α-helices or nanotubes insert spontaneously into a bilayer, even when they contain hydrophilic groups, and immersion of such species can be mediated by chaperon lipid flip flop. Intriguingly, it is known that the presence of transmembrane stretches of protein in the bilayer greatly enhances phospholipid flip-flop (Kol et al., 2003). Nonetheless, lipid transbilayer flips are among the slowest molecular timescale events undertaken by lipids. These timescales cannot be accessed by classical atomistic molecular dynamics simulations. It is not far-fetched, however, to imagine such motions at a macroscopic level where millions of lipids are available for flipping and where other effects such as undulations and raft aggregation will have an effect on the overall dynamics of the membrane and even on HBTC-type immersion.
As discussed previously the local surface tension can be related to changes in the area per headgroup. As the tube approaches the membrane the area per headgroup of the lipids close to the tube increases before insertion, but decreases as the tube merges into the membrane. The area per headgroup of the lipids in the first shell around the tube remains small, implying that the surface pressure remains high during the immersion process. As the tube rotates, the area per headgroup of the lipids increases, implying a relaxation of the surface pressure. Finally, both in the simulation with the tube embedded in the membrane and in the insertion simulation we see that the area per headgroup of the lipids surrounding the tube moiety is generally small. This is indicative of a high surface pressure around the tube. This may be due to the rattling of the tube within the lipid cage. The final structures of these simulations are interesting starting points for all-atom MD simulations where the membrane-tube interaction and membrane-channel interaction can be explored in more detail.
CONCLUSIONS
The simulations presented in this article show the interactions of a model channel with a coarse grain hydrated lipid bilayer. The coarse-grain model for the tube was built from generic preexisting units. In agreement with previous studies by Hummer and co-workers and Sansom and co-workers, our coarse grain tubes exhibit some capacity for water transport. It is important to realize that the water sites in the coarse grain model represent three loosely clustered water molecules and as such cannot form conducting water wires. We computed the free-energy profile for water permeation both through the lipid bilayer and through the tube. The excellent agreement between the coarse grained and atomistic barrier for water permeation through a lipid bilayer demonstrates, firstly, that the coarse grained representation captures the correct physics and, secondly, allows us to quantify the barrier lowering after tube insertion, namely a factor of 2.5.
The length of the tube plays an important role in the stability of the transmembrane structure. If the hydrophobic part of the tube is longer or shorter than that of the lipid bilayer a swelling or compression of the bilayer is observed so that a meniscus forms around the tube (Nielsen et al., 2004a). As seen in the simulation, the addition of hydrophilic caps to the tube favorably stabilizes the transmembrane structure.
The insertion of the tube into the membrane shows that spontaneous insertion of molecules of this type is possible. This can be viewed in several ways. On the one hand, it seems plausible that a synthetic nanotube like the present tube can insert into the membrane and be used as a channel in nanosyringe or sensor applications. The functionality of such a molecule would be tunable by selecting functional groups or chains that would alter the conductivity and specificity of the channel. All-atom molecular dynamics simulations with a molecule of this type would provide the necessary details that this would entail. On the other hand, from a biological point of view, a collection of proteins, as in the barrel-stave model of insertion, could come together to form an overall structure reminiscent of the channel-tube model that we present in this article. The insertion of such an assembled oligomer seems plausible from what we observe in our simulations.
The insertion and subsequent rotation of the tube-channel model in our simulation is akin to a carpet-model insertion process, where the tube plunges into the bilayer in a lateral orientation. In this case the transport of one of the hydrophilic caps across the membrane core is facilitated by two lipids that effectively block the entrance to the pore and screen its interaction with the hydrophobic tails. Furthermore these lipids help in the final phase of the rotation by fusing with the lower leaflet and dragging the tube into its final transmembrane configuration in the process.
Acknowledgments
The authors thank Dr. Srinivas Goundla for useful comments regarding this manuscript.
We acknowledge the Pittsburgh Supercomputing Center through the Pennsylvania research initiative and the National Center for Supercomputing Applications through the National Partnership for Advanced Computational Infrastructure for computer time used for these simulations. This work was funded by National Institutes of Health grant GM 40712.
Carlos F. Lopez' present address is Institute for Theoretical Chemistry, University of Texas at Austin, 1 University Station A5300, Austin, Texas 78712-1167.
References
- Andreu, D., and L. Rivas. 1998. Animal antimicrobial peptides: an overview. Biopolymers. 47:415–433. [DOI] [PubMed] [Google Scholar]
- Asthagiri, D., and D. Bashford. 2002. Continuum and atomistic modeling of ion partitioning into a peptide nanotube. Biophys. J. 82:1176–1189. [DOI] [PMC free article] [PubMed] [Google Scholar]
- Bayley, H. 1999. Designed membrane channels and pores. Curr. Opin. Biotechnol. 10:94–103. [DOI] [PubMed] [Google Scholar]
- Bechinger, B. 2001. Membrane insertion and orientation of polyalanine peptides: a n-15 solid-state NMR spectroscopy investigation. Biophys. J. 81:2251–2256. [DOI] [PMC free article] [PubMed] [Google Scholar]
- Beckstein, O., P. C. Biggin, and M. S. P. Sansom. 2001. A hydrophobic gating mechanism for nanopores. J. Phys. Chem. B. 105:12902–12905. [Google Scholar]
- Bemporad, D., J. W. Essex, and C. Luttmann. 2004. Permeation of small molecules through a lipid bilayer: a computer simulation study. J. Phys. Chem. B. 108:4875–4884. [Google Scholar]
- Berezhkovskii, A., and G. Hummer. 2002. Single-file transport of water molecules through a carbon nanotube. Phys. Rev. Lett. 89:064503. [DOI] [PubMed] [Google Scholar]
- Dieckmann, G. R., J. D. Lear, Q. F. Zhong, M. L. Klein, W. F. DeGrado, and K. A. Sharp. 1999. Exploration of the structural features defining the conduction properties of a synthetic ion channel. Biophys. J. 76:618–630. [DOI] [PMC free article] [PubMed] [Google Scholar]
- Fernandez-Lopez, S., H. S. Kim, E. C. Choi, M. Delgado, J. R. Granja, A. Khasanov, K. Kraehenbuehl, G. Long, D. A. Weinberger, K. M. Wilcoxen, and M. R. Ghadiri. 2001. Antibacterial agents based on the cyclic D,L-alpha-peptide architecture. Nature. 412:452–455. [DOI] [PubMed] [Google Scholar]
- Goetz, R., and R. Lipowsky. 1998. Computer simulations of bilayer membranes: self-assembly and interfacial tension. J. Chem. Phys. 108:7397–7409. [Google Scholar]
- Harrell, C. C., S. B. Lee, and C. R. Martin. 2003. Synthetic single-nanopore and nanotube membranes. Anal., Chem. 75:6861–6867. [DOI] [PubMed] [Google Scholar]
- Hartgerink, J. D., T. D. Clark, and M. R. Ghadiri. 1998. Peptide nanotubes and beyond. Chem. Eur. J. 4:1367–1372. [Google Scholar]
- Hoffmann, J. A., F. C. Kafatos, C. A. Janeway, and R. A. B. Ezekowitz. 1999. Phylogenetic perspectives in innate immunity. Science. 284:1313–1318. [DOI] [PubMed] [Google Scholar]
- Huang, H. W. 2000. Action of antimicrobial peptides: two-state model. Biochemistry. 39:8347–8352. [DOI] [PubMed] [Google Scholar]
- Hummer, G. 2001. Fast-growth thermodynamic integration: error and efficiency analysis. J. Chem. Phys. 114:7330–7337. [Google Scholar]
- Hummer, G., J. C. Rasaiah, and J. P. Noworyta. 2001. Water conduction through the hydrophobic channel of a carbon nanotube. Nature. 414:188–190. [DOI] [PubMed] [Google Scholar]
- Kim, H. S., J. D. Hartgerink, and M. R. Ghadiri. 1998. Oriented self-assembly of cyclic peptide nanotubes in lipid membranes. J. Am. Chem. Soc. 120:4417–4424. [Google Scholar]
- Kol, M. A., A. N. C. van Laak, D. T. S. Rijkers, J. A. Killian, A. de Kroon, and B. de Kruijff. 2003. Phospholipid flop induced by transmembrane peptides in model membranes is modulated by lipid composition. Biochemistry. 42:231–237. [DOI] [PubMed] [Google Scholar]
- Konig, B. 1997. Well-rounded research: nanotubes through self-assembly. Angew. Chem. Int. Ed. Engl. 36:1833–1835. [Google Scholar]
- Lee, S. B., D. T. Mitchell, L. Trofin, T. K. Nevanen, H. Soderlund, and C. R. Martin. 2002. Antibody-based bio-nanotube membranes for enantiomeric drug separations. Science. 296:2198–2200. [DOI] [PubMed] [Google Scholar]
- Lopez, C. F., M. Montal, J. K. Blasie, M. L. Klein, and P. B. Moore. 2002a. Molecular dynamics investigation of membrane-bound bundles of the channel-forming transmembrane domain of viral protein U from the human immunodeficiency virus HIV-1. Biophys. J. 83:1259–1267. [DOI] [PMC free article] [PubMed] [Google Scholar]
- Lopez, C. F., P. B. Moore, J. C. Shelley, M. Y. Shelley, and M. L. Klein. 2002b. Computer simulation studies of biomembranes using a coarse grain model. Comput. Phys. Commun. 147:1–6. [Google Scholar]
- Lopez, C. F., S. O. Nielsen, P. B. Moore, and M. L. Klein. 2004. Understanding nature's design for a nanosyringe. Proc. Natl. Acad. Sci. USA. 101:4431–4434. [DOI] [PMC free article] [PubMed] [Google Scholar]
- Nielsen, S. O., C. F. Lopez, I. Ivanov, P. B. Moore, J. C. Shelley, and M. L. Klein. 2004a. Transmembrane peptide induced lipid sorting and mechanism of Lα to inverted phase transition using coarse grain molecular dynamics. Biophys. J. 87:2107–2115. [DOI] [PMC free article] [PubMed] [Google Scholar]
- Nielsen, S. O., C. F. Lopez, G. Srinivas, and M. L. Klein. 2004b. Coarse grain models and the computer simulation of soft materials. J. Phys. Condens. Matter. 16:R481–R512. [Google Scholar]
- Park, S., F. Khalili-Araghi, E. Tajkhorshid, and K. Schulten. 2003. Free energy calculation from steered molecular dynamics simulations using Jarzynski's equality. J. Chem. Phys. 119:3559–3566. [Google Scholar]
- Pastor, R. W., R. M. Venable, and S. E. Feller. 2002. Lipid bilayers, NMR relaxation, and computer simulations. Acc. Chem. Res. 35:438–446. [DOI] [PubMed] [Google Scholar]
- Ridder, A., W. van de Hoef, J. Stam, A. Kuhn, B. de Kruijff, and J. A. Killian. 2002. Importance of hydrophobic matching for spontaneous insertion of a single-spanning membrane protein. Biochemistry. 41:4946–4952. [DOI] [PubMed] [Google Scholar]
- Shelley, J. C., M. Y. Shelley, R. C. Reeder, S. Bandyopadhyay, and M. L. Klein. 2001. A coarse grain model for phospholipid simulations. J. Phys. Chem. B. 105:4464–4470. [Google Scholar]
- Spencer, R. H., and D. C. Rees. 2002. The alpha-helix and the organization and gating of channels. Annu. Rev. Biophys. Biomol. Struct. 31:207–233. [DOI] [PubMed] [Google Scholar]
- Stacey, G., S. Koh, C. Granger, and J. M. Becker. 2002. Peptide transport in plants. Trends Plant Sci. 7:257–263. [DOI] [PubMed] [Google Scholar]
- Tuckerman, M. E., and G. J. Martyna. 2000. Understanding modern molecular dynamics: techniques and applications. J. Phys. Chem. B. 104:159–178. [Google Scholar]
- Wang, H., and D. Branton. 2001. Nanopores with a spark for single-molecule detection. Nat. Biotechnol. 19:622–623. [DOI] [PubMed] [Google Scholar]
- Yang, L., T. A. Harroun, T. M. Weiss, L. Ding, and H. W. Huang. 2001. Barrel-stave model or toroidal modelÅ A case study on melittin pores. Biophys. J. 81:1475–1485. [DOI] [PMC free article] [PubMed] [Google Scholar]
- Yang, L., T. M. Weiss, R. I. Lehrer, and H. W. Huang. 2000. Crystallization of antimicrobial pores in membranes: magainin and protegrin. Biophys. J. 79:2002–2009. [DOI] [PMC free article] [PubMed] [Google Scholar]
- Yeh, I. C., and G. Hummer. 2004. Nucleic acid transport through carbon nanotube membranes. Proc. Natl. Acad. Sci. USA. 101:12177–12182. [DOI] [PMC free article] [PubMed] [Google Scholar]
- Zasloff, M. 1987. Magainins, a class of antimicrobial peptides from Xenopus skin—isolation, characterization of 2 active forms, and partial cDNA sequence of a precursor. Proc. Natl. Acad. Sci. USA. 84:5449–5453. [DOI] [PMC free article] [PubMed] [Google Scholar]
- Zasloff, M. 2002. Antimicrobial peptides of multicellular organisms. Nature. 415:389–395. [DOI] [PubMed] [Google Scholar]
- Zheng, S. Y., J. Strzalka, C. Ma, S. J. Opella, B. M. Ocko, and J. K. Blasie. 2001. Structural studies of the HIV-1 accessory protein Vpu in langmuir monolayers: synchrotron x-ray reflectivity. Biophys. J. 80:1837–1850. [DOI] [PMC free article] [PubMed] [Google Scholar]
- Zhong, Q., P. B. Moore, D. M. Newns, and M. L. Klein. 1998. Molecular dynamics study of the LS3 voltage-gated ion channel. FEBS Lett. 427:267–270. [DOI] [PubMed] [Google Scholar]
- Zhu, F. Q., E. Tajkhorshid, and K. Schulten. 2004. Theory and simulation of water permeation in aquaporin-1. Biophys. J. 86:50–57. [DOI] [PMC free article] [PubMed] [Google Scholar]