

Abstract
Dynamic instability of MTs is thought to be regulated by biochemical transformations within tubulin dimers that are coupled to the hydrolysis of bound GTP. Structural studies of nucleotide-bound tubulin dimers have recently provided a concrete basis for understanding how these transformations may contribute to MT dynamic instability. To analyze these ideas, we have developed a molecular-mechanical model in which structural and biochemical properties of tubulin are used to predict the shape and stability of MTs. From simple and explicit features of tubulin, we define bond energy relationships and explore the impact of their variations on integral MT properties. This modeling provides quantitative predictions about the GTP cap. It specifies important mechanical features underlying MT instability and shows that this property does not require GTP-hydrolysis to alter the strength of tubulin-tubulin bonds. The MT plus end is stabilized by at least two layers of GTP-tubulin subunits, whereas the minus end requires at least one; this and other differences between the ends are explained by asymmetric force balances. Overall, this model provides a new link between the biophysical characteristics of tubulin and the physiological behavior of MTs. It will also be useful in building a more complete description of MT dynamics and mechanics.
INTRODUCTION
MTs are ubiquitous cellular structures that are essential for normal growth and division of eukaryotic cells (recently reviewed in Howard and Hyman, 2003). These self-assembling polymers are constructed from globular subunits that measure ∼46 × 65 × 80 Å (Nogales et al., 1999), each of which contains two related proteins: α- and β-tubulin. Each dimer within the MT wall forms two types of noncovalent bonds with its closest neighbors: longitudinal bonds, which are oriented parallel to the MT's axis and are responsible for the “head-to-tail” attachments of dimers, and lateral bonds by which the lateral surfaces of each tubulin monomer interact with their neighbors on either side (reviewed in Nogales, 2001). The ability to establish such bonds results in the formation of hollow, rigid tubes with an ∼25 nm outside diameter, the walls of which are built from a single layer of tubulins (Chretien et al., 1998; Chretien and Fuller, 2000; Li et al., 2002; Meurer-Grob et al., 2001; Nogales et al., 1999).
Under physiological conditions, tubulin monomers form a three-start helix with 13-fold symmetry. Consequently, there is a seam running along each MT where dimers interact differently than in the rest of the polymer. In such a polymer, the dimers are positioned strictly one above the other, forming 13 PFs that run parallel to the MT axis. This configuration is, however, unstable and may undergo a “catastrophe” in which the state of slow subunit addition is switched to a condition of rapid subunit loss, leading the MT to shrink. During the resulting periods of rapid shortening, the individual PFs dissociate and tend to bend outward, followed by dissociation into individual tubulin dimers (Hyman et al., 1995; Mandelkow and Mandelkow, 1985; Mandelkow et al., 1991; Melki et al., 1989).
Tubulin polymerization is closely coupled with hydrolysis of one of its bound GTPs (reviewed in Erickson and O'Brien, 1992). The dimers assemble at appreciable rates only if both of their nucleotide binding sites are occupied by GTP. Soon after polymerization, the GTP associated with β-tubulin is hydrolyzed to GDP, which remains bound at the same site. Thus, most tubulin in a MT is GDP-associated, and only the most recently added subunits retain GTP. Although this heterogeneity in bound nucleotide is difficult to detect, the heterogeneity of MT composition is thought to play a crucial role in determining MT stability. A “cap” of GTP-subunits at the MT end is thought to stabilize each MT, whereas removal of the cap triggers MT depolymerization (Mitchison and Kirschner, 1984). The exact size of the GTP cap on MTs growing under normal conditions is not known, but it must be determined by the mechanism that couples hydrolysis and polymerization (reviewed in Desai and Mitchison, 1997). Several indirect lines of evidence argue that the cap is relatively small (reviewed in Caplow, 1992), and more recent but still controversial data suggest that the cap may consist of a single ring of non-GDP-tubulins (Caplow and Fee, 2003; Caplow and Shanks, 1996; Panda et al., 2002). It is unclear if the MT's minus end is also capped; although it exhibits a dynamic instability similar to that of the plus end, it has been suggested that the minus end lacks a GTP cap altogether (Horio and Hotani, 1986; Nogales et al., 1999; Walker et al., 1988, 1989).
Structural studies strongly suggest that the equilibrium configurations for GTP- and GDP-tubulin dimers are different (reviewed in Nogales et al., 2003). The GDP-dimer is more bent, producing a PF shape that does not conform well with the straight cylindrical wall of the MT lattice (Gigant et al., 2000; Howard and Timasheff, 1986; Müller-Reichert et al., 1998). The conformational change between GTP- and GDP-tubulin appears to be constrained by the lattice. Thus, the accumulated stress may provide the driving force for the rapid splitting apart of PFs that follows a catastrophe, as well as for their subsequent curling into the “ram's horn” configuration seen at the ends of disassembling MTs (Arnal et al., 2000; Mandelkow et al., 1991). Since GTP-hydrolysis takes place only on the β-tubulin monomer, the major conformational changes are likely to occur within this part of the tubulin dimer, rather than in an α-tubulin monomer (reviewed in Nogales, 2001). The curvature of the GDP-PF is likely to have two components: bending within the dimer and the rotation between the dimers (reviewed in Nogales et al., 2003). Although these structural findings are not yet complete, they provide an appealing mechanical basis for linking conformational changes within a tubulin molecule to both structural and physiological features of the MT polymer.
A comprehensive analysis of the complex and unusual behavior of MTs cannot be accomplished without a formal, quantitative mathematical model. Several such models, addressing different aspects of the MT behavior, have been proposed over the years. Most of them are broad-spectrum developments from the pioneering work by Hill and his colleagues (Chen and Hill, 1985; Hill and Chen, 1984; Hill and Kirschner, 1982). These models are based on biochemical schemes of tubulin attachment/detachment and different sets of rules about changes in the microscopic rate constants for GDP- and GTP-bound tubulins (e.g., Bayley et al., 1989; Flyvbjerg et al., 1996; Martin et al., 1993; Odde et al., 1995; Pedigo and Williams, 2002). A more recent model additionally contains a set of rules that mimic some general mechanical features of MTs (VanBuren et al., 2002). Although this approach greatly facilitates understanding the kinetic processes of MT assembly/disassembly and some aspects of tubulin polymerization energetics, these models do not allow a detailed analysis of the mechanical characteristics of MT and of the stress-associated energy changes. The mechanical properties of the whole stable MT were first analyzed by Janosi and collaborators (Janosi et al., 1998, 2002), who modeled the MT wall as an elastic two-dimensional material with intrinsic curvatures. These properties, however, were not based on any kinetic or mechanical characteristics of the tubulin molecule, which greatly limits interpretation of the obtained results.
Here we present a novel mathematical model of the MT, which is based on the current knowledge of tubulin structure and biochemistry. In the model, longitudinal forces acting between the head-to-tail attached dimers tend to bend PFs away from the MT axis, whereas lateral forces between dimers in neighboring PFs counteract this activity. This set of assumptions is sufficient to describe a major property of the MT: for the same set of parameters, the homogeneous MT is unstable but can be stabilized by rings of GTP-tubulin at its ends. Moreover, this MT behavior can be explained without a need to invoke either difference in the strength of lateral bonds between α- and β-tubulins or any dependence of lateral bond on the state of the bound nucleotide.
MATHEMATICAL MODEL
The general framework and assumptions
We model a generic MT with tubulin dimers (8 nm in length) positioned in a 13_3 lattice (i.e., 13 PFs with a helical pitch of 3 monomers per left-hand spiral turn). The helical lattice that contains the centers of mass for each monomer is set at a radius of 11.2 nm (Li et al., 2002). The MT's central axis is assumed to be straight, and in this work we do not consider MT bending as a whole. The individual PFs can bend but cannot twist (see below). Conformational changes within the dimer after the GTP-hydrolysis that occurs in the MT wall are thought to have two major components: one from bending within the dimer and one from tilting between the β-subunit of the lower dimer (the one closer to the minus end) and the α-subunit in its upper (plus end proximal) neighbor (Gigant et al., 2000; Nicholson et al., 1999; Steinmetz et al., 2000). For simplicity, we modeled dimers as solid and almost nondeformable objects (see Appendix 2 in Supplementary Material), so the structural changes induced by GTP-hydrolysis are manifested exclusively by tilting, i.e., changes in the steady-state angle between neighboring dimers (more detailed analysis suggests that this simplification does not affect the major conclusions of this study). Interaction between dimers occurs in the model at specific points, rather than all over the contact surfaces. Thus, each dimer within the MT wall has six contact points where interactions with neighbors take place (Fig. 1, A and B). Two points are positioned along the dimer's long axis, so the top point for a lower dimer coincides with the lower point of the upper dimer in the same PF. The remaining four interaction points correspond to interactions between α- and β-subunits of each dimer with those in its lateral neighbors (note that at the MT seam the neighboring monomers are different, i.e., α-subunits interact with β-subunits). The relative positions of these points are identical for all monomers (Fig. 1 B). The lateral interaction points on two neighboring monomers lie in the plane that is orthogonal to the MT axis. We designate the distance between them r. In a cylindrical, perfectly straight MT, r = ρ ≥ 0. By definition, ρ is the distance at which the potential energy of lateral interactions is at a minimum (see Supplemental Materials). If we put ρ = 0, the positions of lateral interaction points coincide for the neighboring monomers, and hence r = 0. When r > ρ, the PFs bend outward, and r < ρ when PFs bend inward, i.e., toward the MT's axis.
FIGURE 1.

MT geometry and the forces acting between dimers. (A) A segment of a three-dimensional drawing of the MT polymer in a straight configuration with 13 individual PFs arranged with a helical pitch of three monomers per turn of the helix. Axis z is the central axis of the MT and points to the MT's plus end. MT dimers consist of the lower α-tubulin (dark green) and the upper β-tubulin (light green) monomers. Each nonterminal dimer (e.g., the dimer circled with an orange line) has six points of interaction with adjacent dimers (shown with darker color): longitudinal (red dots), and lateral (blue). The MT space is divided into 13 equal sectors. Plane P(3) (shown as semitransparent) contains the third PF axis and includes the longitudinal interaction points for all dimers in this PF. (B) An enlarged schematic diagram of a dimer and its adjacent neighbors showing the positions of interaction points; zi is the axis of the ith PF, h is a longitudinal shift between neighboring PFs, L is the dimer's length. Centers of monomers for a central dimer are shown with crosses. (C) Side view of a single bent PF in plane P(i). Bending of each PF (exaggerated) is assumed to occur only in its respective plane P (xi, zi). For each dimer the angle θ describes the dimer's tilting relative to the respective PF's axis, whereas χ is the angle between a dimer and its upper neighbor. The longitudinal forces (red bent arrows) bend the PF such that all angles  tend to the equilibrium
  The lateral forces correspond to α−α and β−β bonds and have their projections (blue straight arrows) in the plane P(i).
There are two types of forces that act at the dimer interaction points (Fig. 1 C); these are described in more detail below and in Appendix 1 of the Supplementary Material. Force acting at the lateral interaction points depends only on r, and either brings PFs closer or pushes them apart. The second force, which acts at the head-to-tail interaction points within each PF (longitudinal force), is chosen such that each dimer pair tends to assume its equilibrium bending configuration with angle  between the dimers in plane P, which contains the MT's and the PF's axes. One of the model's assumptions is that bending of each dimer, and therefore of the entire PF, occurs only within its respective plane P. This assumption significantly simplifies the calculations, and it is justified in part by the MT's symmetry. Indeed, due to this feature, the sum of lateral forces acting at each nonterminal dimer lies in (if neighboring dimers are of the same type) or near (if neighbors are different) the plane P. The lateral interactions are symmetric for the majority of lattice dimers although there is an asymmetry for some terminal dimers and for α- and β-tubulin monomers at the seam (assuming that lateral interactions between two α-tubulins differ from those for two β-tubulins).
For a detailed description of a MT's configuration, we used a Cartesian system of coordinates in which z coincides with the MT's longitudinal axis (for details, see Appendix 1 of the Supplementary Material). The shape and position of the ith PF (i = 1 – 13) is explicitly defined by setting the coordinates for one longitudinal interaction point for any of the PF's dimers and by angles  between z and the axis of each dimer within this PF. Positive
  describe dimers in which the upper β-subunit is farther away from the MT's axis than the lower α-subunit. To study stability of the MT plus end, the coordinates of the lowest 13 dimers (k = 0) are fixed, and their angles θo = 0 for all 13 PFs. Stability of the minus end has been examined using a MT in which the parameters of the terminal plus end dimers were treated similarly.
Forces acting between dimers in the same PF
The longitudinal bonds between dimers are thought to be considerably stronger than the lateral ones. This is based on the known pathway of catastrophic MT disassembly, in which the lateral bonds dissociate before the longitudinal (Arnal et al., 2000; Müller-Reichert et al., 1998; Tran et al., 1997a), on structural data (Nogales et al., 1999), and on theoretical estimates (Erickson, 1989; Sept et al., 2003; VanBuren et al., 2002). We therefore postulate that the head-to-tail bonds are not extensible and do not break (i.e., in curved PF, the dimers remain attached to each other). The energy G of a PF's bending is localized to the points of interactions between the dimers and is the sum of the energies gk of individual longitudinal points of interaction. G depends only on the angle between any pair of adjacent dimers (Fig. 2 A):
 |
(1) |
where N is the total number of dimers in a PF.
FIGURE 2.

Energy potentials for dimer interactions. (A) The potential function used to describe longitudinal interactions is a quadratic function of the angle χ; its minimum for GDP-dimers is at  Rad (shown). The minimum for GTP-dimers is shifted closer to zero, since
  (not shown). Vertical broken line here and in B marks 0. (B) The potential for lateral interactions has its maximum when the distance between interaction points 2ro = 2.4 Å; it is minimal when dimers are either not separated (r = ρ) or when r tends to infinity (the potential shown is for ρ = 0).
The exact shape of the potential g is not known. In this model, we have used a simple quadratic dependence, so that the resulting force increases proportionally to increasing deviation from equilibrium:
 |
(2a) |
 |
(2b) |
where B is a parameter that is assumed to be identical for GDP- and GTP-bound dimers. It characterizes the stiffness of the bending moments between neighboring dimers in the PF. Symbols D and T refer to the GDP- and GTP-bound forms of tubulin, respectively.
The value of angle  at which g has a minimum, can be estimated from structural studies (Müller-Reichert et al., 1998). For two head-to-tail attached GDP-dimers,
  Rad (22°). Based on the available images of the GTP-tubulin MTs, the equilibrium angle between two GTP-dimers is likely to be very small (Hyman et al., 1992; Mandelkow et al., 1991). Its upper limit can be approximated from the data for GMPCPP MTs (Müller-Reichert et al., 1998). Therefore,
  Rad, and except where noted, we have used the upper limit. Upon GTP-hydrolysis, the major conformational changes within the dimer are thought to concentrate within the β-subunit of the dimer, whereas the conformation of the α-tubulin subunit remains relatively unchanged (Gigant et al., 2000). It is therefore reasonable to assume that for a given pair of dimers the equilibrium angle is largely determined by the conformational status of the β-subunit, which forms the interaction surface with the α-tubulin of the second (upper) dimer. It follows, that there are only two types of energy potentials
  to consider:
  and
and  which correspond to the GDP- and GTP-bound forms, respectively, of the lower (minus end) dimer, regardless of the form of the upper (plus end) dimer.
Forces acting between a dimer and its lateral neighbors
To enable an analysis of PF bending and the eventual breaking of bonds between the PFs, we describe interaction (ν) at each lateral interaction point (Fig. 2 B) with an equation that grasps the basic features of a chemical bond and a typical protein-protein interaction (Glastone et al., 1941; Jiang et al., 2002):
 |
(3) |
where r is the distance between two adjacent lateral interaction points; ro is a parameter that characterizes the distance at which this bond exerts a maximum attractive force; ρ is a parameter that defines r at the potential energy minimum; ξ characterizes the dimers' deviation from the equilibrium configuration; and A is a parameter that characterizes the stiffness of lateral bonds (for details, see Appendix 2 of the Supplementary Material).
For small positive ξ, the potential energy from force acting at the lateral interaction point is proportional to the square of the deviation; i.e., there is a short-acting attracting force when monomers are slightly separated (Fig. 2 B). At the same time, there is a strong repelling force if monomers are pushed closer together, i.e., ξ < 0. The potential reaches its maximum at ξ = 2ro, where ro is chosen as a typical distance for protein-protein interactions, 1.2 Å (Jiang et al., 2002). This barrier impedes the breaking of lateral bonds between the dimers. For ξ > 2ro, the potential quickly decreases. It should be noted that a typical potential curve for protein-protein interaction has negative energy at ξ = 0, whereas MT polymerization is likely to have positive energy (Johnson and Borisy, 1979), suggesting that the same is true for the lateral bonds. However, since this value is unknown, we have carried out the calculations for different depths of potential wells (see Results).
The total potential energy of the MT
The steady-state MT conformation was determined by minimizing its total potential energy U, which is the sum of the longitudinal and lateral interactions for all points of interaction within the MT:
 |
(4a) |
 |
(4b) |
The first part of Eq. 4b contains sums of the potential energies for all adjacent dimer pairs within the ith PF. The second part is a sum of lateral interactions for all interaction points between monomers in the ith PF and the (i + 1)th PF. If all PFs contain N dimers, then the first part of Eq. 4b has N items, whereas the second part has 2N items for i≠13 (i.e., for all PFs except the 13th PF). Note that due to MT helicity, there are three monomers at the plus end of the 13th PF, which have lateral interactions on one side only.
Using interaction potentials described by Eqs. 2 and 3, the total potential energy  of the ith PF can be written as:
 |
(5) |
 |
where A, ro, and B are parameters from Eqs. 3 and 2; ao and γ are coefficients (below);  and
and  correspond to the lower and upper monomers, respectively, of the kth dimer (for details, see Appendix 2 of the Supplementary Material). For simplicity, ρ = 0 and the superscript i has been omitted in the right-hand parts of Eq. 5. Note that
  of the ith PF depends on angles
  and
and  in this and in the neighboring PF, respectively, since they determine the distance rk between their lateral interaction points.
The steady-state MT conformation was determined by minimizing the total potential energy in Eq. 5, as described in Appendix 2 of the Supplementary Material. The parameter B does not affect the steady-state MT configuration but becomes important for calculating the absolute value of U.
Ratio of the lateral and longitudinal bonds and relative strength of the β-β bond
The ratio A/B characterizes the relative strength of lateral and longitudinal forces. To simplify its interpretation, we have normalized it by dividing by ao, where ao is the minimal value of the ratio of lateral and longitudinal stiffness coefficients A/B for a MT that consists entirely of the GDP-dimers and for which the MT is still stable (see Results for details). The coefficient γ is introduced to enable examination of the importance of the possible weakening of the lateral bonds between two β-tubulin monomers, which may occur during MT polymerization after GTP-hydrolysis (Nogales et al., 1999). In the model, γ = 1 if the strength of the β-β bond does not change; γ < 1 if the β-tubulin lateral bond weakens after GTP-hydrolysis. For simplicity, the strength of the bond between two α-tubulins is kept constant and equal to the strength of the GTP-bound β-β bond.
Model of the MT without helicity
We have also developed a model describing the MT's shape for a case in which there is no helicity (13_0 lattice). Such a MT is truly symmetric and all its PFs are identical ( is independent of i). In this case, all items in Eq. 4a are identical, and the potential energy U depends only on N variables
  This greatly simplifies the numerical calculations and allows some analytical estimates, because only a single PF has to be considered (for details, see Appendix 3 of the Supplementary Material). We used this model for the initial analysis (e.g., in the study of the balance of forces acting at the MT wall dimers), but all major conclusions were then verified using numerical calculations for the complete model above.
RESULTS
The model describes a cap-dependent MT stability
The steady-state configuration of a MT of given length and described by parameters of given values can be determined in the model by minimizing the total potential energy for all interactions between the dimers. For a wide range of model parameters (described in more detail below), the steady-state configuration of the MT with a cap is stable, and the MT is predicted to have a straight, cylindrical shape (Fig. 3 A). Fig. 3 B shows the profile of a typical PF from a stable MT with two terminal layers of dimers in the GTP-bound form (2T-cap). Its plus end is slightly bent, reminiscent of the structural cap described in Janosi et al. (2002). However, the maximal radial deformation in our model is <2 Å. It is found only at the very tip and diminishes rapidly away from the MT end. The third from the top tubulin layer extends to the side <0.4 Å. All layers below the seventh layer are deformed <0.005 Å, which corresponds to angular deformation (angles  between MT and each dimer's axes) of <10−4 Rad. Importantly, a MT built with the same parameters but that consists entirely of the GDP subunits is unstable. Its equilibrium configuration consists of individual PFs that have peeled back into the “ram's horn” formations (Fig. 3 C) that are characteristic of disassembling MTs (Mandelkow et al., 1991).
FIGURE 3.

Steady-state MT configurations. Numerical calculations were carried out using the model of a helical MT and for a = 0.65, γ = 1,  N = 10 (see Mathematical Model and Supplementary Materials for details). Black and shaded segments represent dimers in the GDP and GTP form, respectively. (A) The three-dimensional arrangement of all PFs in a MT with a 2T plus-end cap. (B) The side view of the eighth PF from the same MT as shown in A. Numbers on the right are the deviations (in angstroms) of the dimer's top interaction points from the vertical axis. Shaded area corresponds to the inner side of the MT. Note difference in scale between ordinate and abscissa. (C) The equilibrium configuration of a MT with the same parameters as in A but with no cap. Under normal conditions, after separation of lateral attachments, the dimers also loose their longitudinal connections; the PFs in C are shown bent but unbroken because in the model the longitudinal bonds do not separate. This feature does not interfere with analysis of the events occurring before the dimer's dissociation.
Balance of longitudinal forces is responsible for the maintenance of a straight configuration for nonterminal dimers
The equilibrium state of each dimer within the wall of a stable MT requires that the sum of all forces acting at this dimer is zero (Fig. 1 C). The deviations of nonterminal dimers from the PF's axis are close to zero (Fig. 3 B). Therefore, the potentials for lateral interactions are at local minima (Eq. 3), and the resulting lateral force is negligible. The bending forces acting on each dimer at its longitudinal interaction points are, however, quite substantial. Nonetheless, the sum of these bending forces, as well as the sum of their moments, is almost zero (see Appendix 3 of the Supplementary Material for details). Therefore, the highly straight configuration of a stable MT is a direct consequence of compensation of bending longitudinal forces acting at each dimer within each PF.
To verify directly that the lateral interactions at nonterminal dimers contribute very little to the maintenance of the MT shape, we used numerical calculations to determine the stability of a MT with a 2T-cap, in which the strength of lateral interactions of GDP-dimers was reduced while GTP-dimer bonds were kept unchanged. We found that the reduction by a factor of 10 was insufficient to cause any measurable deformations anywhere along the MT length (Fig. 4, compare A and B). Further reduction in GDP-dimer interaction leads to an inward bending of PFs in long MTs. Therefore, lateral bonds between the nonterminal dimers within the MT wall are slightly compressed. They act such that dimers are slightly pushed away, rather than pulled inside the MT. We concluded that the part of the MT wall that is not immediately adjacent to the MT tips remains straight and cylindrical because of the compensation of the bending forces acting on each dimer from its neighbors in the PF, but not from the restraining activity of the lateral forces.
FIGURE 4.

Side-view profiles of a single PF from nonhomogeneous MTs. The numerical calculations were carried out using the model for a nonhelical 13_0 MT with 10 tubulin layers (N = 10, except in D, where N = 20) for a = 0.65, γ = 1, and  (A–E, H), or
  (F and G). See Fig. 3 for other details. All MTs have a 2T-cap at their plus ends except E and F, where the GTP cap has six layers, and H, where there is no cap. In B the strength of all lateral bonds for GDP-dimers was reduced 10-fold, relative to GTP-dimers. In C, the MT has the same parameters as in A, but it contains a layer of nonterminal GTP-dimers. H shows the steady-state configuration for a MT without a cap, but with a single nonterminal GTP layer. The plus end of such a MT underwent catastrophe, but PF bending (almost horizontal black line) stopped at the GDP layer above the GTP-containing dimers.
Dimer interactions are local
The analysis of force balance in nonhelical MTs has also established that the position of the kth dimer depends on the interaction of this dimer with its closest neighbors (k + 1) and (k − 1) and is almost insensitive to the status of the dimers farther away (Appendix 3 of the Supplementary Material). This suggests that perturbation in MT shape due to nonhomogeneity of that MT's composition should remain local and does not propagate far. This was verified, e.g., by determining the shape of the GDP-MT containing a single nonterminal layer of GTP-dimers (Fig. 4 C). The resulting distortion is significant only at the interaction sites of the GTP-dimers and their upper neighbors. This causes a local kink in the MT wall, which remains highly cylindrical only a few subunits away.
Fine structure of the MT tip depends on the cap size and the equilibrium bending angles
The bending force acting on the dimer at the MT end is always significant because the terminal dimer has only one longitudinal neighbor. This leads to a local deformation of the PFs at the MT tip. Its shape is largely determined by the size of the GTP cap and the 2–3 adjacent GDP layers. As expected from the locality of dimer interactions, the structure of the tip is insensitive to the total MT length (Fig. 4, compare A and D). When the GTP cap is relatively large (>5–6 layers), its central layers are quite straight and cylindrical (Fig. 4 E). The kink is localized to the boundary between the GDP and GTP layers, whereas deformations at the very tip are almost the same as seen for the 2T-cap in MTs with the same parameters (Fig. 4, A–D).
One of the factors that determines the exact shape and size of these deformations is the equilibrium angle  for two head-to-tail attached GTP-dimers (see Mathematical Model). If
  the MT tip is perfectly straight, but there is a large deformation at the cap boundary (Fig. 4, compare E and F). The deformation at the boundary is greater for smaller
  because of the greater difference between the equilibrium angles for the GTP- and GDP-bound dimers. For the same reasons, when the tip is short (2–3 layers), there are greater deformations for smaller
  and in this case the terminal dimer even bends inward (Fig. 4 G). Similarly, changing the
  will also slightly increase deformations at the tubulin-GTP cap boundary if they increase the difference between
  and
and  but in this case the structure of the distal GTP-bound layers will remain unchanged. Importantly, for all equilibrium values of
  the deformations are always local, and the dimers rarely stick out from the MT wall farther than the typical distance for the protein-protein interaction (∼1.2 Å). All of the above description is applicable to both plus and minus MT ends, and the basic features of their shape are quite similar. However, for the same value of the parameters of the stable MT, its minus end tip is less deformed than its plus end (below).
The relative strength of lateral and longitudinal forces determines MT stability
To explore the impact of different parameters on MT stability, we used the parameter acr, a critical value of parameter a that characterizes the relative strength of lateral and longitudinal forces for a given MT composition (see Mathematical Model). Although the relative strengths of these two types of forces play a minor role in maintaining straight configuration of the nonterminal dimers, the bending forces for the tubulin dimers at the tip are not compensated. The resulting deformation increases the distance r between the interaction points of these dimers and their lateral neighbors; the increased lateral force acts to prevent catastrophes. Therefore, for relatively strong lateral forces, i.e., large a, the MT is stable, whereas the same MT is unstable at smaller a. The critical value acr is the minimal a necessary to prevent a given MT from catastrophe. For example, the end of a MT consisting entirely of GDP-dimers will not undergo catastrophic disassembly, even without a tubulin-GTP cap, if a is greater than acr. This particular value has been chosen as a reference, and for the plus end of a helical GDP-MT without a cap we put acr = 1. The ends of MTs of different composition are characterized by different acr; when acr < 1 for a given MT's end, this end is more stable than the plus end of the GDP-MT without a cap.
A 2T-cap is necessary and sufficient to stabilize the MT plus end for a wide range of model parameters
Using the above approach, we then evaluated MT's stability for different cap size and values of parameters that define tubulin characteristics, such as the strength of the GDP-β-tubulin bond (parameter γ) and the equilibrium bend  Table 1 contains critical values acr for MTs of different composition, for example with different sizes of tubulin-GTP caps. The addition of GTP-tubulin layers to either MT end has a stabilizing effect, and acr becomes smaller compared to that of a GDP-MT for the same parameters. Importantly, the first two GTP-layers (i.e., those closest to the GDP-layers) are the most significant in determining the plus end stability (e.g., compare Table 1 lines 1–5 for
  and γ = 1). For these parameters, the tubulin-GTP cap with a single layer (1T-cap) has almost no effect on stabilization of the plus end (acr does not change), but the addition of only one more layer decreases acr by ∼2.4. The latter corresponds to a maximal possible stabilization by the tubulin-GTP cap, and further increase in cap size does not change appreciably the MT's stability (Table 1, lines 4 and 5). Although the single GTP-layer seems to have no effect in stabilizing the MT plus end, if there are two layers the one that is second from the end takes on a crucial role. Indeed, for a wide range of model parameters, the MT can be stabilized equally well by the homogeneous 2T-cap and by the heterogeneous two-layer cap, in which only the second from the end layer contains GTP-tubulins (Table 1, lines 3 and 6). If terminal layers contain mixtures of GTP- and GDP-tubulins, the stability is intermediate, and it decreases with increasing content of GDP-dimers. The above conclusions hold true for MTs of any length examined, except for very short MTs (<5–6 tubulin layers).
TABLE 1.
Role of different parameters in MT stability

|

|
||||
|---|---|---|---|---|---|
| Composition | γ = 1 | γ = 0.1 | γ = 1 | γ = 0.1 | |
| 1 | DDD…DDDDD + | 1.00 | 2.90 | 1.00 | 2.90 |
| 2 | DDD…DDDDT + | 1.00 | 1.02 | 1.00 | 1.02 |
| 3 | DDD…DDDTT + | 0.43 | 0.43 | 0.20 | 0.20 |
| 4 | DDD…DDTTT + | 0.43 | 0.43 | 0.17 | 0.17 |
| 5 | DDD…DTTTT + | 0.43 | 0.43 | 0.17 | 0.17 |
| 6 | DDD…DDDTD + | 0.43 | 1.04 | 0.20 | 0.36 |
| 7 | −TDDDD…DDD | 0.43 | 0.43 | 0.20 | 0.22 |
| 8 | −DDDDD…DDD | 1.00 | 1.11 | 1.00 | 1.11 |
The critical values of parameter a are given for one of the ends of helical 13_3 MTs (N = 10,  Rad, ro = 1.2 Å), whose composition is abbreviated with “D” and “T” (bold), corresponding to the homogeneous layers of GDP and GTP-dimers, respectively. Symbols “+” and “−” refer to the “plus” and “minus” ends. γ = 1 corresponds to the configuration in which all lateral bonds are identical; γ = 0.1 means that the strength of lateral bonds for α-tubulin are identical to those of the β-tubulin in GTP form, whereas GDP β-tubulin bonds are 10-fold weaker. For a perfectly straight GTP-dimers pair,
  ; the most bent configuration has
  (for details, see Appendix 2 of the Supplementary Material).
We have also examined how the relative strengths of lateral bonds between α-tubulins or β-tubulins affect the above conclusions. A 10-fold decrease in the strength of GDP-β-tubulin bonds alone (γ = 0.1), or even of all lateral bonds for GDP-dimers (Fig. 4 B), has no appreciable effect on the shape of the MT along its length, and it does not affect the stability of MTs with a cap that is 2T or larger (Table 1). The MT's stability and the shape of the MT plus end tip become sensitive to γ only if the GTP cap is <2T or completely absent. When γ = 0.1, MTs without a cap are less stable by almost threefold (acr = 2.9). Now, even a single GTP layer has a significant stabilizing effect on the plus end although this MT is still slightly less stable than one without a cap but with unchanged β-tubulin bonds.
A similar effect is seen if the strength of the lateral bonds is kept unchanged, but the equilibrium angle  for the GTP-dimers is varied (
 ). If the conformation of GTP-dimers is straighter (smaller
  ) it is even easier to stabilize such a MT by a cap (Table 1). This can also be seen by comparing acr for MTs with a 2T-cap but with different equilibrium angles
  (Table 2). If
  is decreased from its upper limit 0.2 Rad (11.5°) down to 0.1 Rad (5.7°), the acr gets smaller by almost a factor of 2. However, further reduction in the equilibrium angle has a much smaller effect on MT stability.
TABLE 2.
MT stability for different equilibrium angles for GTP-dimers

|

|
||||||
|---|---|---|---|---|---|---|---|
| Composition | 0.40 | 0.20 | 0.15 | 0.10 | 0.05 | 0 | |
| 1 | Helical | 1.0 | 0.43 | 0.30 | 0.23 | 0.20 | 0.20 |
| 2 | Not helical | 0.78 | 0.33 | 0.25 | 0.19 | 0.17 | 0.17 |
The critical values of parameter a are given for the plus ends of helical (13_3) and not helical (13_0) MTs with 2T-cap, γ = 1 (for details, see Appendix 2 of the Supplementary Material).
Finally, we have examined the stability of a MT in which a single layer of GTP-tubulins is not distal but is located elsewhere along the MT's length. This calculation was carried out to mimic the experiment in which MTs were depolymerizing from their plus ends but paused, presumably because the shortening exposed the single GTP layer, making it terminal (Caplow and Shanks, 1996). The final steady-state configuration of a MT with a single, nonterminal GTP-layer, is indeed stable in the model. However, our computations revealed that the GTP-layer does not become terminal after MT depolymerization from the plus, GDP-monomer-containing end. Rather, the GTP-tubulin layer is still predicted to be covered by a single remaining layer of GDP-tubulin (Fig. 4 H). Such a heterogeneous cap is unlikely to occur during normal MT growth, but as described above it is sufficient to stabilize the MT and prevent its catastrophe for almost all parameter values (Table 1, line 6).
A difference between the plus and minus ends is determined by different force balances
When all lateral bonds are identical, the values of acr for both ends of the GDP-MT are the same (Table 1, γ = 1). Therefore, the stabilities of the GDP plus and minus ends without GTP caps are similar. However, the GTP cap has a different impact on each end because the addition of a single GTP-layer is sufficient to stabilize the minus end (Table 1, lines 7 and 8), whereas two layers are required at the plus end. At both ends, additional layers have little effect on polymer stability. When both ends have ≥2T-caps, they become equally stable. Weakening of the β-β lateral bonds for GDP-tubulin (γ = 0.1), as described above, tends to destabilize the MT, especially at the plus end of the GDP-MT without a cap (Table 1, line 1). The minus end is much less sensitive to changes in strength of the lateral bonds. For example, the critical value for the minus end of the GDP-MT remains almost unchanged if GTP-hydrolysis leads to a 10× reduction in the strength of lateral β-β bonds (Table 1, line 8). In this case, the relative stability of the plus and minus ends for an uncapped MT differs almost threefold, and it becomes theoretically possible to have a MT that is stable at its minus end in the absence of the cap but requires a 1T-cap for stability at its plus end. However, for the reasons described in Discussion, we do not think that this situation is plausible.
Different characteristics of the plus and minus ends are best understood in the model by considering the balance of forces at the MT ends in the context of the asymmetry of a tubulin dimer. Since the major destabilizing activity is likely to be brought about by conformational changes in the β-tubulin rather than the α-tubulin monomer, the equilibrium angle between the terminal dimer and its lower neighbor at the plus end is determined mostly by the lower dimer. In contrast, the equilibrium angle for the terminal minus-end dimer depends largely on the status of this dimer, rather than that of its upper neighbor. As a result, the addition of a more “straight” GTP-dimer to the less “straight” GDP-dimer at the plus end has a weaker stabilizing effect than the comparable addition at the minus end (Table 1, lines 2 and 7). Consistently, the plus-end tip shows larger deformations than those seen at the minus-end tip of the same MT (Fig. 5, A and B).
FIGURE 5.

Differences between plus and minus ends. Fine structure of the plus (A) and minus (B) ends in the same 13_0 MT with 1T-cap; a = 1.25, γ = 0.1,  ; a > acr of the plus end, so that both ends are stable when each has a 1T-cap. See legend of Fig. 1 for more details. (C) A schematic illustration of how structural differences at the ends lead to their different shapes and stabilities. The bending (not to scale) at two ends of a single PF is shown for γ < 1. Straight arrows show amplitude and direction of the lateral forces acting between the monomers in this PF and its neighbors (not shown). Round arrows correspond to the bending forces between the head-to-tail adjacent dimers in the same PF.
The asymmetry is even stronger when we consider the lateral bonds between the terminal dimers at each MT end (Fig. 5 C). The plus end β-monomer is ∼3 times farther from the rotation center (at the head-to-tail interaction point with the neighboring dimer) than the β-monomer at the minus end. As a result, the moment of the restraining lateral bond between β-monomers in adjacent PFs is ∼3 times stronger at the plus end than at the minus end. Therefore, if the strength of the β-β bonds is reduced after the GTP-hydrolysis, it would decrease the total moment of the restraining forces at the minus end to a lesser extent than at the plus end (Table 1, lines 1 and 8). The upper limit of this difference is ∼3-fold, and it will be seen if GTP-hydrolysis leads to a complete loss of the lateral bonds between β-monomers.
A helical 13_3 MT is slightly less stable than a 13_0 one
Modeling of a helical MT revealed that the dimer configuration in this lattice is again highly parallel to the MT's axis (not shown). The helicity of a MT does not interfere with the compensation of bending moments described above because it results from the head-to-tail longitudinal interactions between the dimers within the PF, which are insensitive to the helicity. However, several dimers in a 13_3 MT inevitably lack some lateral bonds. If all PFs have the same number of dimers, at least two plus-end dimers have a weaker attachment to the rest of the MT, leading to a general asymmetry at the end (Fig. 6). The deviation of terminal dimers from the MT's central axis gradually increases from the PF that contains all plus-end lateral bonds to the most protruding PF, which altogether lacks three lateral bonds.
FIGURE 6.
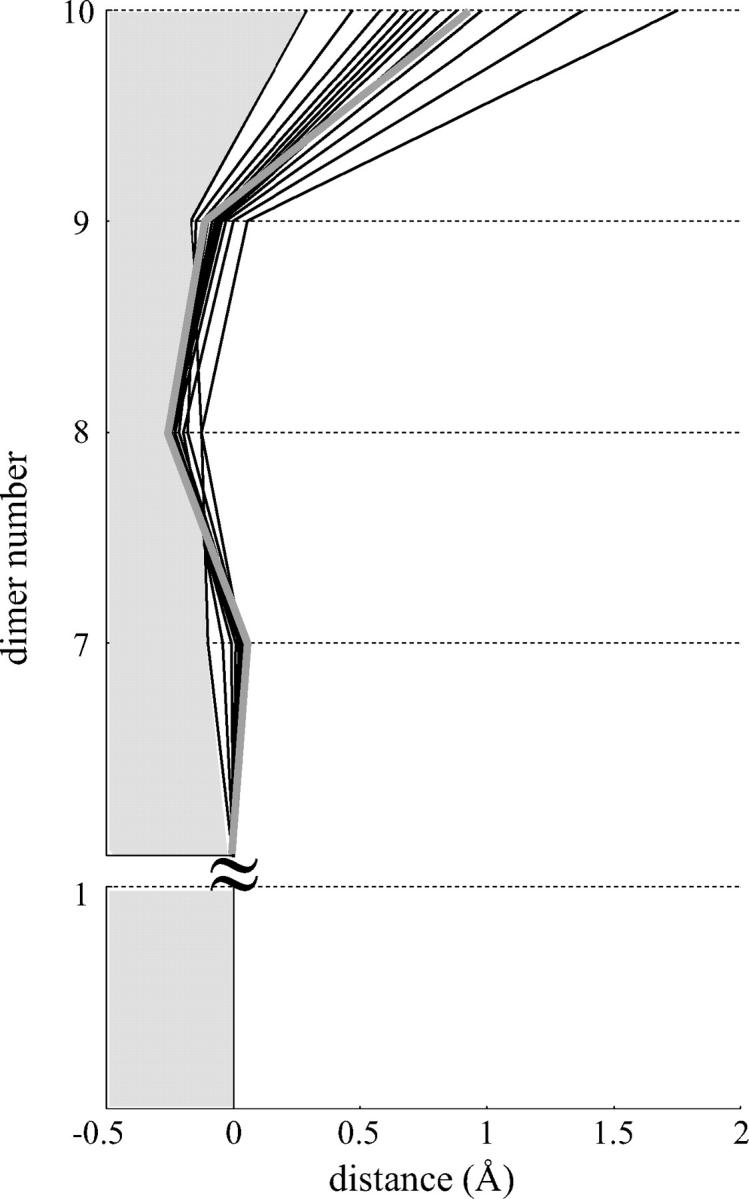
Fine structure of the tips of all PFs in a helical MT. The side views of all 13 PFs (black). In the first PF the dimers have neighbors for all lateral interaction points (most straight black contour), whereas the 13th PF is missing three lateral bonds (most bent black contour). Structure of the PF in a nonhelical MT with the same parameter values is shown for a comparison (thick shaded contour).
When all lateral bonds are identical, the critical value acr that is required to prevent catastrophe in the helical MT is slightly higher (∼20%) than for a 13_0 MT of the same composition (Table 2), but all the conclusions obtained above from the model of a nonhelical MT remain largely correct. When γ < 1, the influence of seam is also very small and depends on the strength of lateral bonds between α- and β-tubulins. It is reasonable to assume that the strength of this α-β bond might be intermediate between the strengths of α-α and β-β bonds. In this case, the presence of the seam will have essentially no consequences because, as we have shown above, the weakening of all lateral bonds for the GDP-dimers has little effect on the MT with a >2T-cap. Similarly, lateral α-β bonds at the seam in a GTP-tubulin cap do not alter the MT's stability, because it will be determined by the weaker β-β bonds between all other dimers in the cap.
Major model conclusions are relatively insensitive to changes in parameters that describe the forces acting between dimers
Since the exact functions that describe the energy potentials of lateral and longitudinal interactions between dimers are not known, it is important to evaluate the impact of different parameters for the functions we have chosen on the model conclusions. Changing the shape of the energy potential for longitudinal force (Eq. 2) by adding terms of a higher order than  did not alter any qualitative property of the MT. As shown above, the value of
  which is known with less certainty than
  is relatively important in determining the exact shape of the tiny deformations in the MT's tip (Fig. 4). It also affects MT stability (Tables 1 and 2) although the maximal possible effect does not exceed ∼2.5.
The energy potential for the lateral interactions can be characterized by three major parameters: the height of the potential barrier, characterized by parameter A, the width of the well (2 ro) and relative energy levels at ξ = 0 and at infinity. The stiffnesses of lateral A (Eq. 3) and longitudinal B (Eq. 2) bonds are not known. Modeling revealed, however, that although their exact values are not important, their ratio a = A/aoB is a major determinant of MT behavior (see above). Thus, for a given B, the larger barriers produce more stable MTs with a straighter end, whereas smaller barriers are destabilizing. The range for possible ro is unlikely to exceed 1 < ro < 3 Å (Jiang et al., 2002). For these values, the major model conclusions are unaffected, although ro influences the exact size of the kinks at the MT tip (Fig. 7, A and B). Additionally, the value of ro determines in part the absolute value of the normalizing coefficient ao, but this does not affect the comparison of acr for MTs of different composition. We have also varied the depth of the well by keeping the infinity level at 0 and changing the minimum energy level for ξ = 0 (Fig. 7 C). The stability of the MTs calculated for these three potentials, as evaluated by the critical values of a, and the MT shape remained essentially the same. Finally, we have found that all major model conclusions remain true if the potential for lateral interactions is described by functions different from Eq. 3, as long as they include a potential barrier.
FIGURE 7.

 |
 |
DISCUSSION
We have developed the first, to our knowledge, molecular-mechanical model of a MT that is based on the known structure of the tubulin dimer and MT lattice. In its present form, this model does not address the dynamics of MT polymerization and depolymerization, but it permits an examination of the stability and shape of MTs with different composition. The model can be used to estimate the impact of different parameters of dimers interactions, which are known experimentally with some uncertainty (e.g., the equilibrium angle between GTP-dimers). The model describes the major structural properties of a MT quite well: the cylindrical shape over its entire length except at the capped tips and the catastrophic peeling of PFs from unstable MTs in a “ram's horn” configuration. One of the major general properties of the MT polymer uncovered with this model is that structural perturbations within the MT lattice affect only the nearest neighbors, i.e., the dimer interactions are all local. Although every dimer of the MT wall is subjected to bending forces, for a homogeneous nonterminating lattice, the force exerted by the upper dimer's neighbor is completely compensated by that applied by its lower neighbor within the same PF. As a result, every dimer is oriented highly parallel to the MT central axis. Surprisingly, lateral bonds between nonterminal dimers in neighboring PFs play no significant role in maintaining this configuration. From a mechanical point of view, the MT resembles a bundle of 13 stiff rods connected and held together only at their ends. The GTP-containing cap is, therefore, the major determinant of a MT's stability.
Size of the stabilizing cap
The crucial role in a cap's ability to prevent catastrophes is played by lateral bonds that act between the dimers at MT ends. To stabilize the MT, the strength of lateral bonds between GTP-dimers in the cap must be sufficient to compensate for their own bending moments, as well as the bending moments of the underlying GDP-containing layer. Within the broad range of model parameters, and if the strength of lateral β-β bonds is independent of GTP-hydrolysis, the model strongly predicts that such stabilization at the plus end requires two layers of GTP-tubulin to form an effective cap. Importantly, the restraining properties of the cap do not increase significantly if the GTP cap gets larger. This result suggests that the growing plus end on average contains slightly more than two layers of GTP-tubulin. Indeed, if the cap were significantly larger, the frequency of catastrophic events in the population of MTs would become negligible, due to the low probability of losing all extra GTP layers (down to a <2T-cap).
The above conclusion is consistent with numerous experimental results (Panda et al., 2002; Vandecandelaere et al., 1999; Voter et al., 1991; Walker et al., 1991) and theoretical analyses (e.g., Flyvbjerg et al., 1994; Martin et al., 1993; VanBuren et al., 2002). Drechsel and Kirschner (1994) have used some statistical arguments to conclude that a single GTP layer might be sufficient to stabilize a MT end, but their assay did not allow the unambiguous determination of MT polarity. In view of our finding that the two ends are likely to have different mechanical stability, such reasoning might need reexamination. Our conclusions seem to contradict an experimental observation described in Caplow and Shanks (1996). These authors propose that a single monolayer tubulin-GTP cap is both necessary and sufficient to stabilize MTs. However, a more detailed analysis of their experimental design reveals that if the MT contains a single nonterminal GTP layer, its catastrophic shortening from the GDP-containing plus end should stop at the GDP-containing layer that is distal to the GTP-layer. For a wide range of model parameters, such a heterogeneous cap should provide stability similar to that of the 2T-cap. Since such a distal GDP-containing layer would have gone undetected, these experimental results do not disagree with the theoretical calculations.
Strength of the lateral bonds
We have also used the model to examine the hypothesis that the lateral β-β bonds may weaken after the GTP-hydrolysis and that this feature may contribute to dynamic instability (Nogales et al., 1999). We found that if the GDP-containing β-β lateral bond is 10 times weaker than before GTP-hydrolysis, the stability of a capless MT is reduced almost threefold. However, the stability of MTs with the GTP-containing caps remains almost unaffected. There are at least two physiologically relevant circumstances in which hypothetical weakening of the β-β bonds could have some impact. First, it would exaggerate the destabilizing activity of a “rogue” tubulin dimer within the MT wall, e.g., a dimer that has lost its GTP-ase activity. Such heterogeneity would create local distortions in the MT lattice, and the accumulated tension might promote the MT's breakage at this site. Second, if a GDP-containing β-β lateral bond is destabilized, this would preferentially (up to the threefold difference) destabilize the MT's plus end (Fig. 5 C). However, it would also lead to an increased rate of depolymerization of the plus end, relative to the minus end. Indeed, the rate of the catastrophic MT shortening is likely to be determined primarily by the dissociation of the lateral bonds between dimers in neighboring PFs. As illustrated in Fig. 5 C, due to the asymmetry of the tubulin dimer the breakage of lateral bonds is expected to be similar for both ends if γ = 1, but it will proceed more easily at the plus end if γ < 1. Since numerous studies demonstrate that the minus end depolymerizes faster than the plus (Gildersleeve et al., 1992; Horio and Hotani, 1986; O'Brien et al., 1990; Tran et al., 1997b; Walker et al., 1988, 1991), we conclude that it is highly unlikely that the β-β lateral bond for the GDP-tubulin is weaker than the α-α lateral bond. This conclusion is consistent with a theoretical estimate (Sept et al., 2003) and strongly argues against the model in which stability of the minus end does not require a cap (Nogales et al., 1999).
Implications of the MT end structure
Although the two MT ends have different mechanical stability, the lateral bonds for the terminal plus and minus end dimers are the same. This similarity of the ends can manifest itself in several ways, e.g., in their interactions with destabilizing MT-associated proteins, such as Kin I. According to our model, the depolymerization activity of such an enzyme can work at either MT end and does not require additional energy to achieve depolymerization; such action may occur via electrostatic effects that weaken lateral bonds between the terminal dimers. This prediction has recently been confirmed by studies on MT depolymerization by Kin I (Desai et al., 1999; Ogawa et al., 2004).
Both MT ends are characterized by a surprisingly complex shape that depends on wall composition and tubulin characteristics. Although for certain model parameters the predicted shape of the tip is similar to that described in Janosi et al. (2002), the important differences are that in our model the deformations are much smaller and more variable. The existing electron-microscopic images of MT ends frequently show large structural deformations, but their meaning is unclear due to a substantial experimental variability and the difficulty in determining which ends were growing and which were truly blunt at the time of fixation/freezing (Arnal et al., 2000; Chretien et al., 1995; Mandelkow et al., 1991; Simon and Salmon, 1990). For a given length of the cap and equilibrium interdimer angles, the exact radial size of the deformations is limited by the length of the lateral bonds ro, the value of which is unlikely to exceed 0.3 nm. Thus, if large deformations (1–2 nm) are indeed found at blunt MT ends, as predicted in Janosi et al. (2002), it would imply some significant conformational changes, e.g., a larger lateral size of dimers in their GTP versus GDP form. The minute wall deformations predicated in our model would propagate with the end of a growing MT, thereby providing rich and variable grounds for the binding of various plus end tip-associated proteins (reviewed in Carvalho et al., 2003; Mimori-Kiyosue and Tsukita, 2003; Schuyler and Pellman, 2001). In addition to an increased affinity of such proteins for specific structural sites at the MT plus end, the model suggests an alternative mechanism for plus-end specific binding for proteins that copolymerize with tubulin but have similar affinities for the GDP and GTP lattice (e.g., CLIP170): their release from the MT wall may be triggered by a propagating “wave” of conformational distortion at the border between the GDP-containing lattice and GTP cap (Fig. 4 F).
Future directions
One of the characteristic features of the MT is its helical symmetry. Surprisingly, we find that this property is relatively unimportant for a MT's overall shape and stability. This suggests that the role of a MT's helicity may lie in different processes. For example, helicity may promote MT growth because the edge of the tip in helical MT always contains sites for dimer binding, which in addition to the head-to-tail attachment include one or several lateral bonds. In contrast, dimer attachment to the even edge of nonhelical MT would occur only via the formation of a longitudinal bond, and therefore such a dimer would have a larger dissociation constant. Future development of this model will be required to allow accurate description of the dynamic process of MT assembly and disassembly. We note several advances that should take place in such a model: 1), the PF bending should not be restricted to a single plane; removal of this restriction is required for description of more complex formations, such as two-dimensional sheets, at the MT tip; and 2), longitudinal bonds should also be allowed to dissociate; this is the most important requirement for incorporating kinetic processes of dimer assembly/disassembly into this mechanical model. Although both these modifications have proven to complicate the calculations, the development of such a model is underway.
SUPPLEMENTARY MATERIAL
An online supplement to this article can be found by visiting BJ Online at http://www.biophysj.org.
Supplementary Material
Acknowledgments
We thank A. Efremov and Drs. V. Tichonravov, I. Kochikov, and M. Trubetskov for useful discussions, and A. I. Vorobjev for general support.
This work was supported in part by National Institutes of Health grant GM33787 to J.R.M.
Abbreviations used: MT, microtubule; PF, protofilament; Rad, radian; GTP, guanosine triphosphate; GDP, guanosine diphosphate.
References
- Arnal, I., E. Karsenti, and A. A. Hyman. 2000. Structural transitions at microtubule ends correlate with their dynamic properties in Xenopus egg extracts. J. Cell Biol. 149:767–774. [DOI] [PMC free article] [PubMed] [Google Scholar]
- Bayley, P., M. Schilstra, and S. Martin. 1989. A lateral cap model of microtubule dynamic instability. FEBS Lett. 259:181–184. [DOI] [PubMed] [Google Scholar]
- Caplow, M. 1992. Microtubule dynamics. Curr. Opin. Cell Biol. 4:58–65. [DOI] [PubMed] [Google Scholar]
- Caplow, M., and L. Fee. 2003. Concerning the chemical nature of tubulin subunits that cap and stabilize microtubules. Biochemistry. 42:2122–2126. [DOI] [PubMed] [Google Scholar]
- Caplow, M., and J. Shanks. 1996. Evidence that a single monolayer tubulin-GTP cap is both necessary and sufficient to stabilize microtubules. Mol. Biol. Cell. 7:663–675. [DOI] [PMC free article] [PubMed] [Google Scholar]
- Carvalho, P., J. S. Tirnauer, and D. Pellman. 2003. Surfing on microtubule ends. Trends Cell Biol. 13:229–237. [DOI] [PubMed] [Google Scholar]
- Chen, Y. D., and T. L. Hill. 1985. Monte Carlo study of the GTP cap in a five-start helix model of a microtubule. Proc. Natl. Acad. Sci. USA. 82:1131–1135. [DOI] [PMC free article] [PubMed] [Google Scholar]
- Chretien, D., H. Flyvbjerg, and S. D. Fuller. 1998. Limited flexibility of the inter-protofilament bonds in microtubules assembled from pure tubulin. Eur. Biophys. J. 27:490–500. [DOI] [PubMed] [Google Scholar]
- Chretien, D., and S. D. Fuller. 2000. Microtubules switch occasionally into unfavorable configurations during elongation. J. Mol. Biol. 298:663–676. [DOI] [PubMed] [Google Scholar]
- Chretien, D., S. D. Fuller, and E. Karsenti. 1995. Structure of growing microtubule ends: two-dimensional sheets close into tubes at variable rates. J. Cell Biol. 129:1311–1328. [DOI] [PMC free article] [PubMed] [Google Scholar]
- Desai, A., and T. J. Mitchison. 1997. Microtubule polymerization dynamics. Annu. Rev. Cell Dev. Biol. 13:83–117. [DOI] [PubMed] [Google Scholar]
- Desai, A., S. Verma, T. J. Mitchison, and C. E. Walczak. 1999. Kin I kinesins are microtubule-destabilizing enzymes. Cell. 96:69–78. [DOI] [PubMed] [Google Scholar]
- Drechsel, D. N., and M. W. Kirschner. 1994. The minimum GTP cap required to stabilize microtubules. Curr. Biol. 4:1053–1061. [DOI] [PubMed] [Google Scholar]
- Erickson, H. P. 1989. Co-operativity in protein-protein association. The structure and stability of the actin filament. J. Mol. Biol. 206:465–474. [DOI] [PubMed] [Google Scholar]
- Erickson, H. P., and E. T. O'Brien. 1992. Microtubule dynamic instability and GTP hydrolysis. Annu. Rev. Biophys. Biomol. Struct. 21:145–166. [DOI] [PubMed] [Google Scholar]
- Flyvbjerg, H., T. E. Holy, and S. Leibler. 1994. Stochastic dynamics of microtubules: a model for caps and catastrophes. Phys. Rev. Lett. 73:2372–2375. [DOI] [PubMed] [Google Scholar]
- Flyvbjerg, H., T. E. Holy, and S. Leibler. 1996. Microtubule dynamics: caps, catastrophes, and coupled hydrolysis. Phys. Rev. E. 54:5538–5560. [DOI] [PubMed] [Google Scholar]
- Gigant, B., P. A. Curmi, C. Martin-Barbey, E. Charbaut, S. Lachkar, L. Lebeau, S. Siavoshian, A. Sobel, and M. Knossow. 2000. The 4 A x-ray structure of a tubulin: stathmin-like domain complex. Cell. 102:809–816. [DOI] [PubMed] [Google Scholar]
- Gildersleeve, R. F., A. R. Cross, K. E. Cullen, A. P. Fagen, and R. C. Williams Jr. 1992. Microtubules grow and shorten at intrinsically variable rates. J. Biol. Chem. 267:7995–8006. [PubMed] [Google Scholar]
- Glastone, S., K. J. Laidler, and H. Eyring. 1941. Theory of Rate Process. McGraw-Hill Book Company, New York and London.
- Hill, T. L., and Y. Chen. 1984. Phase changes at the end of a microtubule with a GTP cap. Proc. Natl. Acad. Sci. USA. 81:5772–5776. [DOI] [PMC free article] [PubMed] [Google Scholar]
- Hill, T. L., and M. W. Kirschner. 1982. Bioenergetics and kinetics of microtubule and actin filament assembly-disassembly. Int. Rev. Cytol. 78:1–125. [PubMed] [Google Scholar]
- Horio, T., and H. Hotani. 1986. Visualization of the dynamic instability of individual microtubules by dark-field microscopy. Nature. 321:605–607. [DOI] [PubMed] [Google Scholar]
- Howard, J., and A. A. Hyman. 2003. Dynamics and mechanics of the microtubule plus end. Nature. 422:753–758. [DOI] [PubMed] [Google Scholar]
- Howard, W. D., and S. N. Timasheff. 1986. GDP state of tubulin: stabilization of double rings. Biochemistry. 25:8292–8300. [DOI] [PubMed] [Google Scholar]
- Hyman, A. A., D. Chretien, I. Arnal, and R. H. Wade. 1995. Structural changes accompanying GTP hydrolysis in microtubules: information from a slowly hydrolyzable analogue guanylyl-(alpha,beta)-methylene-diphosphonate. J. Cell Biol. 128:117–125. [DOI] [PMC free article] [PubMed] [Google Scholar]
- Hyman, A. A., S. Salser, D. N. Drechsel, N. Unwin, and T. J. Mitchison. 1992. Role of GTP hydrolysis in microtubule dynamics: information from a slowly hydrolyzable analogue, GMPCPP. Mol. Biol. Cell. 3:1155–1167. [DOI] [PMC free article] [PubMed] [Google Scholar]
- Janosi, I. M., D. Chretien, and H. Flyvbjerg. 1998. Modeling elastic properties of microtubule tips and walls. Eur. Biophys. J. 27:501–513. [DOI] [PubMed] [Google Scholar]
- Janosi, I. M., D. Chretien, and H. Flyvbjerg. 2002. Structural microtubule cap: stability, catastrophe, rescue, and third state. Biophys. J. 83:1317–1330. [DOI] [PMC free article] [PubMed] [Google Scholar]
- Jiang, L., Y. Gao, F. Mao, Z. Liu, and L. Lai. 2002. Potential of mean force for protein-protein interaction studies. Proteins. 46:190–196. [DOI] [PubMed] [Google Scholar]
- Johnson, K. A., and G. G. Borisy. 1979. Thermodynamic analysis of microtubule self-assembly in vitro. J. Mol. Biol. 133:199–216. [DOI] [PubMed] [Google Scholar]
- Li, H., D. J. DeRosier, W. V. Nicholson, E. Nogales, and K. H. Downing. 2002. Microtubule structure at 8 A resolution. Structure (Camb). 10:1317–1328. [DOI] [PubMed] [Google Scholar]
- Mandelkow, E. M., and E. Mandelkow. 1985. Unstained microtubules studied by cryo-electron microscopy. Substructure, supertwist and disassembly. J. Mol. Biol. 181:123–135. [DOI] [PubMed] [Google Scholar]
- Mandelkow, E. M., E. Mandelkow, and R. A. Milligan. 1991. Microtubule dynamics and microtubule caps: a time-resolved cryo-electron microscopy study. J. Cell Biol. 114:977–991. [DOI] [PMC free article] [PubMed] [Google Scholar]
- Martin, S. R., M. J. Schilstra, and P. M. Bayley. 1993. Dynamic instability of microtubules: Monte Carlo simulation and application to different types of microtubule lattice. Biophys. J. 65:578–596. [DOI] [PMC free article] [PubMed] [Google Scholar]
- Melki, R., M. F. Carlier, D. Pantaloni, and S. N. Timasheff. 1989. Cold depolymerization of microtubules to double rings: geometric stabilization of assemblies. Biochemistry. 28:9143–9152. [DOI] [PubMed] [Google Scholar]
- Meurer-Grob, P., J. Kasparian, and R. H. Wade. 2001. Microtubule structure at improved resolution. Biochemistry. 40:8000–8008. [DOI] [PubMed] [Google Scholar]
- Mimori-Kiyosue, Y., and S. Tsukita. 2003. Search-and-capture of microtubules through plus-end-binding proteins (+TIPs). J. Biochem. (Tokyo). 134:321–326. [DOI] [PubMed] [Google Scholar]
- Mitchison, T., and M. Kirschner. 1984. Dynamic instability of microtubule growth. Nature. 312:237–242. [DOI] [PubMed] [Google Scholar]
- Müller-Reichert, T., D. Chretien, F. Severin, and A. A. Hyman. 1998. Structural changes at microtubule ends accompanying GTP hydrolysis: information from a slowly hydrolyzable analogue of GTP, guanylyl (alpha,beta)methylenediphosphonate. Proc. Natl. Acad. Sci. USA. 95:3661–3666. [DOI] [PMC free article] [PubMed] [Google Scholar]
- Nicholson, W. V., M. Lee, K. H. Downing, and E. Nogales. 1999. Cryo-electron microscopy of GDP-tubulin rings. Cell Biochem. Biophys. 31:175–183. [DOI] [PubMed] [Google Scholar]
- Nogales, E. 2001. Structural insights into microtubule function. Annu. Rev. Biophys. Biomol. Struct. 30:397–420. [DOI] [PubMed] [Google Scholar]
- Nogales, E., H. W. Wang, and H. Niederstrasser. 2003. Tubulin rings: which way do they curve? Curr. Opin. Struct. Biol. 13:256–261. [DOI] [PubMed] [Google Scholar]
- Nogales, E., M. Whittaker, R. A. Milligan, and K. H. Downing. 1999. High-resolution model of the microtubule. Cell. 96:79–88. [DOI] [PubMed] [Google Scholar]
- O'Brien, E. T., E. D. Salmon, R. A. Walker, and H. P. Erickson. 1990. Effects of magnesium on the dynamic instability of individual microtubules. Biochemistry. 29:6648–6656. [DOI] [PubMed] [Google Scholar]
- Odde, D. J., L. Cassimeris, and H. M. Buettner. 1995. Kinetics of microtubule catastrophe assessed by probabilistic analysis. Biophys. J. 69:796–802. [DOI] [PMC free article] [PubMed] [Google Scholar]
- Ogawa, T., R. Nitta, Y. Okada, and N. Hirokawa. 2004. A common mechanism for microtubule destabilizers—M type kinesins stabilize curling of the protofilament using the class-specific neck and loops. Cell. 116:591–602. [DOI] [PubMed] [Google Scholar]
- Panda, D., H. P. Miller, and L. Wilson. 2002. Determination of the size and chemical nature of the stabilizing “cap” at microtubule ends using modulators of polymerization dynamics. Biochemistry. 41:1609–1617. [DOI] [PubMed] [Google Scholar]
- Pedigo, S., and R. C. Williams Jr. 2002. Concentration dependence of variability in growth rates of microtubules. Biophys. J. 83:1809–1819. [DOI] [PMC free article] [PubMed] [Google Scholar]
- Schuyler, S. C., and D. Pellman. 2001. Microtubule “plus-end-tracking proteins”: the end is just the beginning. Cell. 105:421–424. [DOI] [PubMed] [Google Scholar]
- Sept, D., N. A. Baker, and J. A. McCammon. 2003. The physical basis of microtubule structure and stability. Protein Sci. 12:2257–2261. [DOI] [PMC free article] [PubMed] [Google Scholar]
- Simon, J. R., and E. D. Salmon. 1990. The structure of microtubule ends during the elongation and shortening phases of dynamic instability examined by negative-stain electron microscopy. J. Cell Sci. 96:571–582. [DOI] [PubMed] [Google Scholar]
- Steinmetz, M. O., R. A. Kammerer, W. Jahnke, K. N. Goldie, A. Lustig, and J. van Oostrum. 2000. Op18/stathmin caps a kinked protofilament-like tubulin tetramer. EMBO J. 19:572–580. [DOI] [PMC free article] [PubMed] [Google Scholar]
- Tran, P. T., P. Joshi, and E. D. Salmon. 1997a. How tubulin subunits are lost from the shortening ends of microtubules. J. Struct. Biol. 118:107–118. [DOI] [PubMed] [Google Scholar]
- Tran, P. T., R. A. Walker, and E. D. Salmon. 1997b. A metastable intermediate state of microtubule dynamic instability that differs significantly between plus and minus ends. J. Cell Biol. 138:105–117. [DOI] [PMC free article] [PubMed] [Google Scholar]
- VanBuren, V., D. J. Odde, and L. Cassimeris. 2002. Estimates of lateral and longitudinal bond energies within the microtubule lattice. Proc. Natl. Acad. Sci. USA. 99:6035–6040. [DOI] [PMC free article] [PubMed] [Google Scholar]
- Vandecandelaere, A., M. Brune, M. R. Webb, S. R. Martin, and P. M. Bayley. 1999. Phosphate release during microtubule assembly: what stabilizes growing microtubules? Biochemistry. 38:8179–8188. [DOI] [PubMed] [Google Scholar]
- Voter, W. A., E. T. O'Brien, and H. P. Erickson. 1991. Dilution-induced disassembly of microtubules: relation to dynamic instability and the GTP cap. Cell Motil. Cytoskeleton. 18:55–62. [DOI] [PubMed] [Google Scholar]
- Walker, R. A., S. Inoue, and E. D. Salmon. 1989. Asymmetric behavior of severed microtubule ends after ultraviolet-microbeam irradiation of individual microtubules in vitro. J. Cell Biol. 108:931–937. [DOI] [PMC free article] [PubMed] [Google Scholar]
- Walker, R. A., E. T. O'Brien, N. K. Pryer, M. F. Soboeiro, W. A. Voter, H. P. Erickson, and E. D. Salmon. 1988. Dynamic instability of individual microtubules analyzed by video light microscopy: rate constants and transition frequencies. J. Cell Biol. 107:1437–1448. [DOI] [PMC free article] [PubMed] [Google Scholar]
- Walker, R. A., N. K. Pryer, and E. D. Salmon. 1991. Dilution of individual microtubules observed in real time in vitro: evidence that cap size is small and independent of elongation rate. J. Cell Biol. 114:73–81. [DOI] [PMC free article] [PubMed] [Google Scholar]
Associated Data
This section collects any data citations, data availability statements, or supplementary materials included in this article.