

Abstract
The structure and flexibility of the outer membrane protein X (OmpX) in a water-detergent solution and in pure water are investigated by molecular dynamics simulations on the 100-ns timescale and compared with NMR data. The simulations allow for an unbiased determination of the structure of detergent micelles and the protein-detergent mixed micelle. The short-chain lipid dihexanoylphosphatidylcholine, as a detergent, aggregates into pure micelles of ∼18 molecules, or alternatively, it binds to the protein surface. The detergent binds in the form of a monolayer ring around the hydrophobic β-barrel of OmpX rather than in a micellar-like oblate; ∼40 dihexanoylphosphatidylcholine lipids are sufficient for an effective suppression of water from the surface of the β-barrel region. The phospholipids bind also on the extracellular, protruding β-sheet. Here, polar interactions between charged amino acids and phosphatidylcholine headgroups act as condensation seed for detergent micelle formation. The polar protein surface remains accessible to water molecules. In total, ∼90–100 detergent molecules associate within the protein-detergent mixed micelle, in agreement with experimental estimates. The simulation results indicate that OmpX is not a water pore and support the proposed role of the protruding β-sheet as a “fishing rod”.
INTRODUCTION
Integral membrane proteins occur in two different structural motifs. They either consist of a varying number of α-helices, e.g., G-protein coupled receptors (Palczewski et al., 2000), aquaporin (Sui et al., 2001), and the ammonia channel (Khademi et al., 2004), or they adopt a β-barrel fold containing between 8 and 22 β-strands (Schulz, 2002). The latter are exclusively found in the outer membrane of Gram-negative bacteria. However, despite the relative abundance of membrane proteins among all proteins and despite the fact that they represent the majority of the targets for existing drugs (Hopkins and Groom, 2002; Sanders and Myers, 2004), only few structures have been solved.
The prerequisite for functional and structural studies of membrane proteins is the isolation of the protein from the biological membrane and its subsequent purification. An integral part of both processes is the prior solubilization of the membrane protein using detergent molecules (le Maire et al., 2000). In the process of solubilization, the detergent extracts the protein from the native membrane environment by coating at least the hydrophobic membrane-embedded portion (le Maire et al., 2000). The amphiphatic character of the detergent molecules helps solubilize the membrane protein. An important aim besides the protein solubilization is to retain full functionality under the “new” conditions. As an example, the detergent chosen (Sanders et al., 2004), its concentration, or the lipid/detergent ratio may inhibit, e.g., enzyme activity as observed for Na+, K+-ATPase (Esmann, 1984), or for Ca2+-ATPase (Shivanna and Rowe, 1997). Also, the stability of membrane proteins may be lower in detergent micelles compared to lipid bilayers (Bowie, 2001; Engel et al., 2002). In structural studies the detergent has to fulfill additional functions: solution NMR (Arora et al., 2001; Fernandez et al., 2001; Arora and Tamm, 2001) requires detergent molecules forming small, rapidly rotating micellar aggregates with the membrane protein to obtain narrow linewidths of resonances (Opella, 1997; Marassi and Opella, 1998). In x-ray studies, the membrane protein-detergent mixed micelle needs to form well-ordered crystals for high-resolution structure determination.
The importance of detergent molecules or lipids in the process of structure determination and for functional studies of membrane proteins is in contrast with the limited knowledge of the specific interactions of detergent molecules or lipids with proteins, e.g., from spin-label magnetic resonance studies (Marsh and Pali, 2004), and the lack of protein-detergent micelle structures. Understanding the interaction of detergents with membrane proteins will certainly also assist in the elucidation of lipid-protein interactions in biological membranes (Lee, 2003). Furthermore, a detailed knowledge of both the aggregation process and the specific structure of detergent lipids associated to membrane proteins is indispensable for a thorough understanding of the folding process of proteins in membranes (Kleinschmidt, 2003), and by enabling further theoretical and experimental biophysical studies, for functional characterization.
The outer membrane protein X (OmpX) represents an exception because both a crystal structure (Vogt and Schulz, 1999) and an NMR structure (Fernandez et al., 2004) are available. Despite the different environments used in these structure determination studies, the same fold was observed, namely an eight-stranded antiparallel β-barrel with a protruding, four-stranded β-sheet at the extracellular side. The backbone root mean-square deviation (rmsd) between the crystal and NMR structures is only ∼2 Å (Fernandez et al., 2004). The crystal structure of OmpX (Vogt and Schulz, 1999) shows only one detergent molecule on the protein surface (n-octyltetraoxyethylene, C8E4). The NMR studies performed in water-dihexanoylphosphatidylcholine (DHPC) solutions exhibit a large number of contacts between the hydrophobic, membrane-embedded part of the outer membrane protein OmpX and DHPC molecules (Fernandez et al., 2001, 2002, 2004; Hilty et al., 2004). The NMR data were interpreted as a micelle forming around the hydrophobic “jacket” of the protein. In a recent study on the effect of paramagnetic relaxation agents on individual resonances in the NMR spectra of the OmpX/DHPC micelles (Hilty et al., 2004), a “sizeable” relaxation enhancement was measured also for the solvent-accessible regions of OmpX, using 5-doxyl stearic acid (5-DSA) as a paramagnetic reagent whose spin label was observed to be close to the DHPC headgroup. Since 5-DSA was shown to incorporate into DHPC micelles, the latter study therefore suggests an interaction also of lipid molecules with the periplasmic and extracellular parts of OmpX not seen in spectra of the pure OmpX/DHPC system. To conclude, the NMR data leave the question unanswered how the DHPC molecules arrange around OmpX and to what degree they influence its structure and dynamics.
In the past, long-timescale, all-atom molecular dynamics (MD) simulations have been performed to study the spontaneous aggregation of lipids to bilayers (Marrink et al., 2001) or micelles (Marrink et al., 2000), the influence of cations on structure, and dynamics of phosphatidylcholine bilayers (Pandit et al., 2003; Böckmann et al., 2003; Böckmann and Grubmüller, 2004), and for investigating the initial steps of folding of globular water-soluble proteins (Duan and Kollman, 1998). Recently, the initial phase of spontaneous micelle formation around a small protein, the dimeric glycophorin A transmembrane helices, has been studied by MD simulations (Braun et al., 2004; Bond et al., 2004). A stabilization of the protein upon micelle formation was reported (Braun et al., 2004).
However, simulations of mixed protein-lipid-water systems (see, e.g., reviews in Bond and Sansom, 2004; Ash et al., 2004) are usually biased by their setup. For example, proteins are manually inserted into a preformed lipid bilayer (see, e.g., studies on water transport properties of aquaporin (de Groot and Grubmüller, 2001; Tajkhorshid et al., 2002), or pulled into a bilayer for an analysis of peptide anchoring properties (Jensen et al., 2004; Gorfe et al., 2004). In the case of the outer membrane protein A (OmpA)—with a topology comparable to OmpX, consisting of an eight-stranded transmembrane β-barrel domain with a shear number of +8 instead of the +10 of OmpX (Pautsch and Schulz, 1998, 2000), and highly mobile extracellular loops (Arora et al., 2001)—the protein was manually inserted into a micelle (Bond and Sansom, 2003). Especially the micellar setup is highly biased since it is based only on the total mass/volume of the protein-lipid mixed micelle (Arora and Tamm, 2001; Bond and Sansom, 2003). In other words, the experimentally estimated total number of aggregated lipids is modeled in the form of an expanded micelle-like torus around the hydrophobic β-barrel region (Bond and Sansom, 2003). Possible lipid aggregation at the hydrophilic loop region is disregarded. Recently, Bond et al. (2004) reported a 50-ns simulation of spontaneous dodecylphosphocholine (DPC) aggregation around OmpA, using the same amount of detergent molecules (80 DPC molecules) as modeled in the preformed complex (Bond and Sansom, 2003). The global properties of the aggregated protein/detergent micelle resemble those of the preformed complex, e.g., the total number of DPC/protein contacts and the radial density of the protein. Considerable discrepancies were observed in the radial density of water and of DPC (both headgroups and tails) around the protein, and in the detergent-buried solvent-accessible surface. The lack of excess detergent molecules in the simulations might have prevented aggregation numbers larger than the expected one.
Not only the structure of protein-lipid mixed micelles but also knowledge about lipid dynamics on the protein surface is limited. Until now, only the minimal lifetime of DHPC lipids on the OmpX surface (τ > 0.3 ns) could be determined from NMR experiments (Fernandez et al., 2002).
Here, we present an all-atom study (up to 105,000 atoms) of spontaneous and unbiased DHPC micelle formation around OmpX (80-ns timescale) and an analysis of OmpX in pure water (100-ns timescale). The aggregation process of lipids around the outer membrane protein OmpX is investigated at different lipid concentrations in the range of 200–300 mM (total numbers of 105–200). We show how lipids arrange around the protein and propose an interpretation of recent NMR data on this protein-lipid mixed micelle. Furthermore, we compare the structure and dynamics of OmpX in water and in a micellar environment. The distribution and/or dynamics of water and lipid molecules on the protein surface is examined. Finally, we comment on the proposed function of OmpX for promoting cell adhesion and invasion (Vogt and Schulz, 1999). The aggregation simulations allow further a structural and dynamical analysis of pure DHPC micelles, and comparison to the micellar properties as obtained from small-angle neutron scattering experiments (Lin et al., 1986).
METHODS
The crystal structure (Protein Data Bank (PDB) entry 1QJ9, resolution 2.1 Å) (Vogt and Schulz, 1999) has been taken as the starting structure.
Two different types of simulations of OmpX were carried out: one type started from the OmpX solvated in a box of TIP4 (Jorgensen et al., 1983) water molecules at 130 mM NaCl concentration (simulations W1 and W2), and the other started from the OmpX solvated in a water-lipid mixture (simulations M1, M2, and M3) for the study of the self-aggregation process (Table 1). Under the conditions used, the Debye screening length λD
 |
(1) |
can be calculated to 8.7 Å (Boltzmann factor kBT, electron charge e, dielectric constant εo). For the simulation of OmpX in water (simulations W2, see below), the distance between the proteins in the periodic cells is 29 ± 7 Å, rendering possible artifacts due to periodic boundaries and the usage of particle mesh Ewald (PME) highly improbable.
TABLE 1.
Simulation systems
| System | Protein | No. of water | No. of lipids (concentration) | Protein | No. of atoms | Box size (nm3) | Simulation time |
|---|---|---|---|---|---|---|---|
| W1 | OmpX | 8,248 | 0 | 5.0 mM | 35,258 | 6.0 × 6.4 × 8.7 | 13 ns |
| W2 | OmpX | 18,630 | 0 | 2.8 mM | 76,834 | 8.4 × 8.4 × 8.4 | 87 ns |
| M1 | OmpX | 19,971 | 105 (250 mM) | 2.4 mM | 85,334 | 8.7 × 9.0 × 9.0 | 80 ns |
| M2 | OmpX | 29,419 | 149 (243 mM) | 1.6 mM | 124,480 | 10.1 × 10.1 × 10.1 | 20 ns |
| M3 | OmpX | 29,262 | 188 (301 mM) | 1.6 mM | 125,022 | 10.1 × 10.1 × 10.1 | 20 ns |
| M3a | OmpX | 32,805 | 138 (206 mM) | 1.5 mM | 137,694 | 10.4 × 10.4 × 10.4 | 14.5 ns |
| M3b | OmpX | 32,072 | 200 (294 mM) | 1.5 mM | 136,622 | 10.4 × 10.4 × 10.4 | 17.9 ns |
The total number of atoms includes dummy atoms from the TIP4 water model (Jorgensen et al., 1983). Simulation M2 was started by branching M1 after 60 ns (reassigned velocities). M3 was started by branching M2 after 12 ns. M3a and M3b were started by branching M3 after 10 ns.
Simulation systems M were prepared as follows: Starting from OmpX snapshots after 3 ns of equilibration in pure water (simulation W1), 125 copies of a DHPC molecule were placed on a cubic grid with 18 Å spacing. Each DHPC molecule was then randomly rotated and shifted with a maximum shift of 3 Å in every direction. After placing the OmpX molecule into the center of the box those lipids with a distance of <5 Å from the protein were removed, as well as lipids with overlapping van der Waals spheres. The final simulation system M1 contains 105 DHPC lipids (concentration of 250 mM) at 100 mM NaCl, comparable to NMR experiments (Fernandez et al., 2002) and was simulated for 80 ns.
A second aggregation simulation (system M2) starts from a snapshot after 60 ns taken from the initial OmpX-DHPC system (M1): The protein and the aggregated DHP lipids have been relipidized in a larger system to account for the effect of decreasing lipid concentration in the solution due to aggregation. For the relipidized system, the same procedure as described above has been applied to a complex containing the protein, already aggregated lipids (70), protein-close ions (2 Na+, 1 Cl− ion), and protein-close water molecules (400).
The third aggregation simulation (M3) starts from a snapshot after 12 ns taken from the M2 system. Here, 39 DHPC lipids were randomly additionally inserted into the water phase; overlapping water molecules have been removed. Two further simulations (14.5 ns and 17.9 ns, respectively) start from an M3-snapshot after 10 ns. In these simulations, the two micelles formed on the mainly polar, extracellular protruding β-sheet in M1–M3 (see Results section) were removed and, additionally, lipids in solution were removed or added, respectively (simulations M3a and M3b).
All systems contain excess Na+ ions to compensate for the net negative charge of the OmpX protein (net charge, −2). All simulations were performed in a periodic box. The dimensions of the box are 60 Å × 64 Å × 87 Å for system W1. After 13 ns, the protein has been resolvated in a larger cubic box with 84-Å side length to avoid artifacts possibly arising from the periodic boundary conditions (system W2). The box dimensions for the protein-lipid simulation system M1 are 91 Å × 93 Å × 93 Å. The structures were solvated with 10,149 and 18,630 (W1 and W2, respectively), and 22,492 (M1) TIP4 (Jorgensen et al., 1983) water molecules. For the pure protein-water system this corresponds to a water shell thickness of at least 1.3 nm around the protein. The systems comprise, accordingly, 35,258 and 76,834 atoms for W1 and W2, respectively, and 85,334 atoms for M1. The relipidized systems M2 and M3 are enlarged to a cubic box of 101 Å × 101 Å × 101 Å.
The DHPC lipid was modeled starting from the structure of a dimyristoyl-phosphatidylcholine (DMPC) lipid. The optimized potentials for liquid simulation (OPLS) all-atom forcefield was used for the OmpX (Kaminski et al., 2001); for the DHPC molecules we applied a modified version of the Berger forcefield (Berger et al., 1997) that combines the GROMOS parameters for bonds, valence angles, and dihedrals with the Lennard-Jones parameters of the OPLS forcefield, modified for the CH2 and CH3 groups. For consistency, we applied here the OPLS combination rules for the mixed Lennard-Jones parameters instead of the GROMOS combination rules used by Berger et al. (1997).
All MD simulations were carried out using the Gromacs simulation suite (Lindahl et al., 2001). Application of the Lincs (Hess et al., 1997) and Settle (Miyamoto and Kollman, 1992) methods allowed for an integration step size of 2 fs. Short-range electrostatic interactions (distance <1 nm) were calculated explicitly, whereas long-range electrostatic interactions were calculated using the PME (Darden et al., 1993). The systems were coupled separately to an external temperature bath (Berendsen et al., 1984) of 310 K, with a coupling constant of τT = 0.1 ps for the protein and the solvent (including lipids and ions). The pressure was kept constant by a weak coupling to a pressure bath (Berendsen et al., 1984) with τp = 1 ps. Each simulation started with an energy minimization using a steepest descent algorithm (1000 steps). Additionally, for system M2, the minimization was followed by a simulation of 100-ps length with harmonic position restraints applied on all heavy protein atoms of the OmpX molecule (force constant 1000 kJ/mol−1 nm−2) to allow relaxation of the solvent molecules.
Each simulation was run on 8–12 processors of a Beowulf cluster, totaling more than 120,000 h of CPU time. Fig. 4 A was prepared with BobScript (Esnouf, 1997) and Raster3d (Merritt and Bacon, 1997), Figs. 3 C, 4 B, and 7 with PyMOL.
FIGURE 4.

(A) Aggregation simulation system. Shown is the periodic simulation system with the OmpX (orange) solvated in a box of DHPC lipids at a concentration of 250 mM (system M1). Water molecules are not shown. (B) Crystal structure of OmpX (Vogt and Schulz, 1999) with notation of strands, loops, turns, and specific amino acids showing NOEs to the methyl groups of the polar lipid heads (Fernandez et al., 2002).
FIGURE 3.

(A) Pore radius profile for OmpX in water. Shown is the average (thick black line, taken over 4000 snapshots of the final 80 ns of simulation W2) as well as 1 σ and 2 σ standard deviations (gray shaded regions) compared with the pore radius computed on the OmpX x-ray structure (dashed line). (B) Position of selected water molecules along the axis of the β-barrel of OmpX (W systems) as a function of simulation time. (C) Snapshot after 50 ns (system W2) with bound water molecules.
FIGURE 7.

Snapshot of DHPC-OmpX micelle after 80 ns (system M2) from three different perspectives (side views A and C, and view from the periplasmic side, E). Water molecules are not shown, for clarity. Eighty-two lipids are directly or indirectly aggregated on the protein surface. The polar heads of the DHPC molecules are colored magenta, the hydrophobic tails yellow. OmpX is depicted in surface representation with hydrophobic residues colored light green, aromatic residues orange, polar residues light blue, and positively and negatively charged residues blue and red, respectively. (B and D) Snapshots of the water atom distribution in a distance of 3.5 Å from the protein as seen from the views of panels A and C, respectively. Shown in F is a close-up view of the protruding β-sheet, including NOE distance constraints (green) and hydrogen bonds between the upper part of the β4 and β5 sheets. The respective NOE distances as computed from MD simulations W1 and M1 are shown in G.
RESULTS
Stability of OmpX in pure water
The conformation of OmpX remains unchanged in a water environment (130 mM NaCl) during a 100-ns simulation at a temperature of 310 K. Noticeably, the Cα-atom rmsd is only ∼2 Å (see Fig. 1), which is comparable to the value obtained from a 10-ns simulation of OmpA in a DMPC bilayer, and considerably lower than the deviations of 4–5 Å computed for OmpA placed in a DPC micelle (Bond and Sansom, 2003). A decomposition of the structural deviations shows rather small Cα rmsd values of ≈1 Å for the β-barrel domain (thin black line) and fluctuations of ≈3 Å for the protruding β-sheet (β3–β6) and the connecting loops L2 and L3 (residues 47–61 and 87–105; Fig. 1, shaded curve). Also, the latter region shows the largest displacements as quantified by the root mean-square fluctuations (rmsf) shown in Fig. 2 A. The flexibility of the β-sheet amino acids is increased toward the extracellular loops and decreased close to the turns at the periplasmic side. Additional information is gained by averaging the fluctuations over increasing time windows (Fig. 2 B) and subsequent weighting by the rmsf computed over the smallest time window (0.5 ns). In this way, no pronounced differences are seen for the fluctuations occurring on the 1-ns timescale (black solid line), whereas turns (T1–T3) and coils (L1–L4) show a drastically enhanced flexibility on longer timescales (5 ns and 10 ns), allowing for a separation of timescales for (conformational) loop motion and fluctuations of β-sheet regions.
FIGURE 1.

Root mean-square deviation of OmpX (Cα atoms) in water environment. The rmsd is given separately for the membrane-spanning β-barrel domain (thin black line), as well as for the protruding extracellular β-sheet (shaded line).
FIGURE 2.
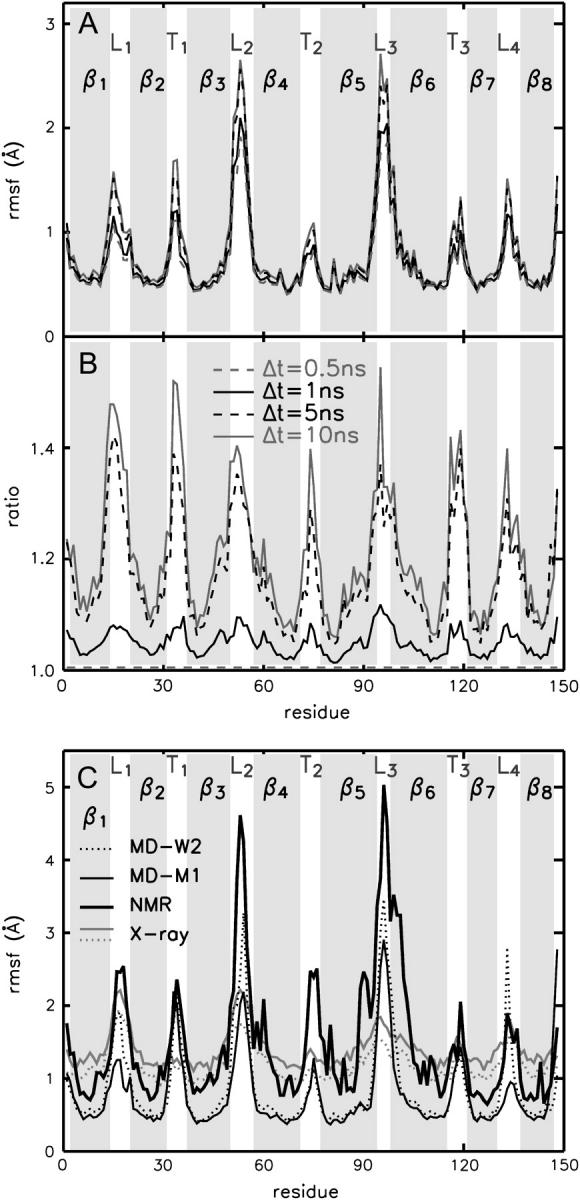
Cα atom rmsf of OmpX in a water environment. The residue-averaged rmsf is shown for four different time windows (0.5 ns, dashed gray; 1 ns, solid black; 5 ns. dashed black; and 10 ns, solid gray line) averaged over the simulation (A). (B) The ratio between the longer time windows and the shortest one (0.5 ns). (C) Comparison of fluctuations between the simulations of OmpX in a water environment (dotted line) and in a DHPC micelle (thin black line), with rmsf values calculated from the x-ray B-factors (PDB entries 1QJ8, dotted gray, and 1QJ9, solid gray line) and as obtained from the NMR ensemble (thick black line, PDB entry 1Q9F). The MD fluctuations are computed over the final 60 ns of the respective simulations (W2 and M1).
As also observed in simulations of OmpA (Bond and Sansom, 2003), the rmsf values for the β-barrel region computed from the x-ray B-factors are considerably larger than the fluctuations of the respective region in the MD simulations (system W2, see Fig. 2 C). Due to the length of the simulation (100 ns), insufficient sampling can be ruled out as a reason for this discrepancy. Therefore, our results support the assumption of Bond and Sansom (2003) that the large x-ray temperature factors may reflect static disorder in the crystal. In the MD simulations, the flexibility of turn T1 is drastically increased as compared to the crystal structures. However, this is in agreement with the diversity of the NMR structure ensemble (thick black line) for this region. Interestingly, the fluctuations in water and in a mixed system containing DHPC lipids (system M1) are similar except for the L1, L2, and L4 loops, which are more flexible in water.
The stability of this membrane protein in a water environment over a 100-ns timescale makes this system especially suitable for aggregation studies of lipids on the surface. Such stability is also consistent with the similarity between the x-ray structure and the NMR structure, despite the different environments. We leave the question unanswered whether or not the fold of this membrane protein remains stable also in a nonnative water environment after being folded in a micelle or a membrane. Experimental evidence is lacking because, most presumably, protein aggregation hampers the analysis of OmpX in pure water.
Water permeation through OmpX?
The crystal structure shows eight cavities inside the β-barrel but no closed pathway between the two ends of the barrel (Vogt and Schulz, 1999). Therefore, and because of the low B-factors of the charged core amino acids, it was considered unlikely that the OmpX functions as a pore.
In agreement with the crystal structure, the average pore radius (calculated using the program HOLE (Smart et al., 1996)) does not allow permeation of water molecules through the barrel (Fig. 3 A, black line). Fluctuations of amino acid side chains pointing into the core, however, might allow for the passage of water molecules. Pore radius fluctuations are estimated in Fig. 3 A by the standard deviations (1 σ and 2 σ, gray shaded areas) of the computed pore radius obtained over 10,000 snapshots (10 ps apart) of the 100-ns OmpX/water simulation (systems W1 and W2). As seen in Fig. 3 B, the fluctuations do not enable water passage through the OmpX on the 100-ns timescale. Five water molecules bound between −10 Å and +5 Å do not cross surrounding barriers rendering a function of the OmpX as a an active or passive water channel even more improbable. This is in line with results for the OmpA embedded in a DMPC bilayer (Bond and Sansom, 2003). Presumably the largest permeation barrier is found close to the periplasmic side, formed by a tight hydrogen-bonded network between Lys27, Tyr80, and Asp124. This network is retained in the simulation systems containing DHPC lipids (runs M1–M3). Thus the inverse micelle-like structure of OmpX with its tight internal hydrogen-bonding network (Vogt and Schulz, 1999) disfavors water transport through the barrel domain.
Aggregation of DHPC on OmpX
System setup
The ≈60-kDa size of the DHPC-OmpX mixed micelle has been estimated from rotational correlation times obtained by N15 NMR relaxation data (Fernandez et al., 2001; Hilty et al., 2002). Analytical ultracentrifugation and protein-detergent titration gave an estimate of 50–70 kDa (Fernandez et al., 2002). This corresponds to a range of 74–118 DHPC lipids in the protein-lipid complex, neglecting hydration water molecules. Modeling of DHPC lipids around the mainly hydrophobic β-barrel (each lipid chain contacting the protein surface) allowed for the placement of 80 DHPC molecules (Fernandez et al., 2002), the same number which was used in the recent simulation setup for the aggregation of single-chain DPC molecules on OmpA (Bond et al., 2004) or in a preformed OmpA-DPC micelle system (Bond and Sansom, 2003). The micelle setup appears to be justified by NMR data showing intermolecular nuclear Overhauser effects (NOEs) between the hydrophobic tails of DHPC molecules and mainly the central apolar β-barrel region (Fernandez et al., 2002). Additionally, few NOEs were observed from the amide backbone protons of Met118 and of Glu119, as well as the indole protons of Trp76 and of Trp140 (see Fig. 4 B), located at the edge of the hydrophobic barrel, to the methyl groups of the polar lipid heads (Fernandez et al., 2002).
The aggregation simulation was started from a system of randomly positioned DHPC lipids distant from the OmpX at a concentration of 250 mM (total number of 105 DHPC molecules, see Fig. 4), well above the cmc of 14–15 mM (Tausk et al., 1974b; Burns et al., 1982; Chou et al., 2004), within the range of concentrations used in the NMR experiments (Fernandez et al., 2001, 2002) (200–300 mM). Assuming an aggregation number of ∼80 DHPC lipids within the mixed micelle the simulation setup with >100 lipids allows for the formation of pure detergent micelles whose size was determined in small-angle neutron scattering experiments to be 19 ± 1 (Lin et al., 1986). The protein “concentration” in the simulation box corresponds to values of 1.5 mM (systems M3aand M3b; see Methods section) to 2.4 mM (M1) (see Table 1), compared to 2 mM in the NMR experiments.
In the simulation, the number of DHPC lipids in direct contact (distance <5.5 Å) with the OmpX in system M1 grows quickly and reaches an equilibrium value of ∼40 already after ≈20 ns (see Fig. 5 A, black and shaded lines). DHPC lipids leaving the protein surface within the simulation time span show a mean lifetime of τ ≈ 2.4 ns (Fig. 5 B). However, a large number of aggregated lipids stay bound for the whole simulation time, suggesting a second, significantly longer lifetime τs ≫ 60 ns. This may be attributed to cooperative binding of lipids to the protein surface and thereby enhanced binding energy, and/or to different binding free energies depending on the specific binding position and also on the lipid binding site (polar head or hydrophobic tails, see below). At the end of simulation M1, 35 lipids are bound for >10 ns, 30 of them being aggregated in the region of the hydrophobic β-barrel and five on the back side of the rather polar extracellular protruding β-sheet.
FIGURE 5.

Number of lipids in contact with OmpX at various protein-lipid distances d ranging from 3.5 Å to 5.5 Å as a function of simulation time (A) and lifetime of contacts at d ≤ 5.5 Å (B) after smoothing the distances with a Gaussian fit with width σ = 800 ps (final 60 ns of simulation M1 considered). The given lipid-protein contact lifetime τ is calculated by fitting the lifetime distribution N(t) ∼ t/τ2 exp – t/τ (solid line) to the lifetime of those lipids which left the protein surface within the simulation time span (gray). Lipids persisting at the end of the simulation are colored black.
To allow large aggregation numbers a second simulation was started from the snapshot of the M1 simulation at t = 60 ns at a similar DHPC concentration of 243 mM, but with an enlarged periodic simulation box (Table 1), thereby increasing the total number of lipids in the simulation box by 42% (149 DHPC molecules, protein concentration decreased to ≈1.6 mM). The average number of directly aggregated lipids for system M2 increases quickly to ≈50 and remains unchanged in a third simulation at 301 mM DHPC concentration (188 DHPC molecules) starting from a snapshot at t = 12 ns of M2 (protein concentration, 1.6 mM; Fig. 5 A, dark gray lines). In contrast, the number of lipids in close contact (distance <3.5 Å) with the protein is almost not influenced by the changes in system size. The number of associated lipids—lipids in direct contact with the protein or contacting it indirectly, e.g., within micelles on the protein surface—increases in simulations M1–M3 to ∼100 (see below).
Protein-detergent mixed micelle formation
Aggregation of DHPC molecules to pure lipid micelles or to protein-detergent micelles is driven mainly by hydrophobic interactions. As shown in Fig. 6 A, the hydrophobic solvent-accessible surface (SAS) of the lipids decreases for simulation M1 from ≈2.8 nm2 to ≈1 nm2 per molecule (105 DHPC molecules in the simulation system), and the protein hydrophobic accessible surface halves from ≈50 nm2 to ≈25 nm2. The nonpolar surface of OmpX is mainly shielded in the region of the hydrophobic, membrane-embedded part (Fig. 6 B). Fluctuations in the SAS are large for the region of the protruding β-sheet (not shown). The polar surface of OmpX is only weakly affected by the aggregation of DHPC molecules, and the largest deviation is observed at L3 (Fig. 6 C).
FIGURE 6.
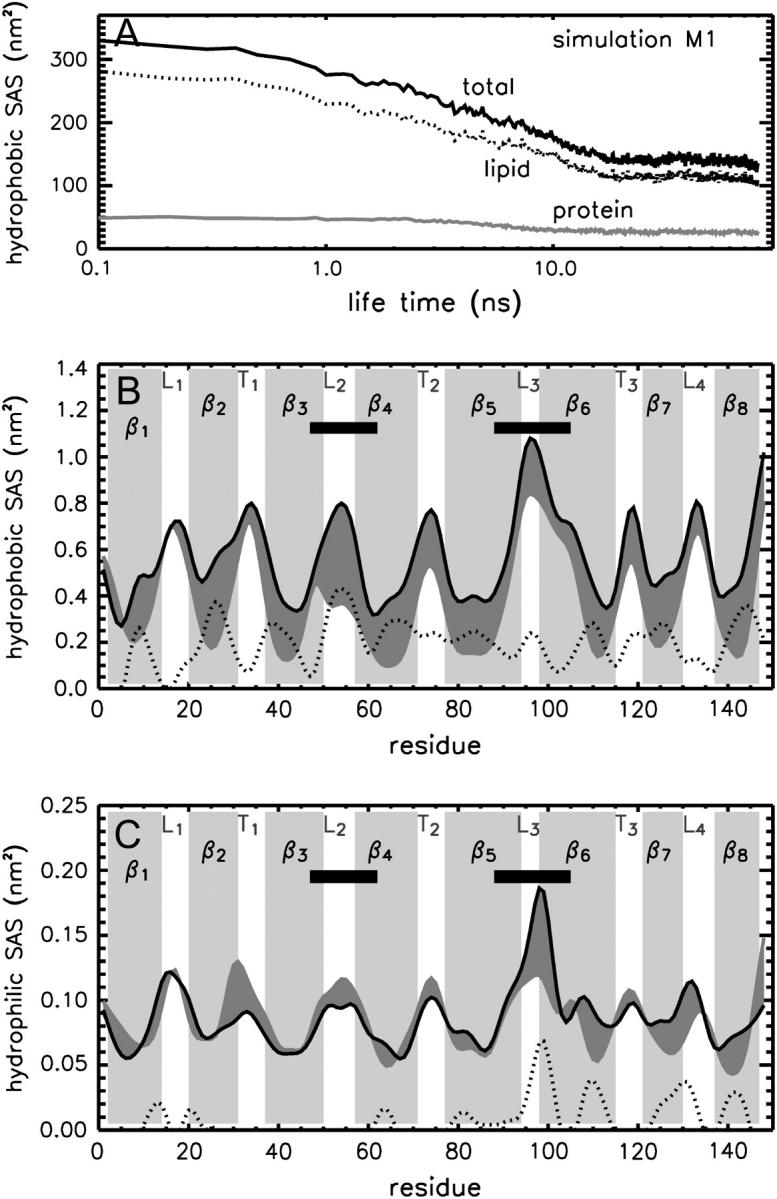
Solvent-accessible surface. (A) Hydrophobic SAS as a function of M1 simulation time given separately for the OmpX (shaded line) and the DHPC lipids (dotted line). (B) Hydrophobic SAS as a function of residue number averaged over the first nanosecond of simulation time (black curve) and its difference (dotted line) to the last nanosecond of simulation M1 (shaded area). The region of the protruding β-sheet is highlighted by black bars. (C) Residual hydrophilic solvent accessible surface. Data shown in B and C are smoothed by using a Gaussian fit with a width of two amino acids.
After 80 ns (end of simulation M2), most of the hydrophobic surface (Fig. 7, light green) is buried by the loosely packed hydrophobic tails (yellow) of the DHPC molecules. Large parts of the polar (light blue) or charged (red and blue) protein surface remain solvent-exposed. In particular, no lipids are bound to the periplasmic end of the β-barrel (Fig. 7 E). In contrast, the extracellular side appears to be prone to aggregation. Two micelles are present on the protein surface, one at loop L1 consisting of 32 molecules (36 at the end of simulation M3) bound by polar interactions between DHPC headgroups and the protein surface, and a second smaller one (14 molecules, 15 at the end of M3) at the interface of strands β4 and β5, as well as loops L2 and L3. The latter micelle involves hydrophobic contacts between the protein and detergent molecules as well as hydrogen bonds between DHPC headgroups or their carbonyl oxygens and predominantly Lys59 and Lys99 at the back side of the protruding β-sheet. The size of the micelle bound at L1 is larger than free in solution ((Lin et al., 1986)), and might be stabilized by the mainly polar interactions to the protein.
Interestingly, after 26 ns one DHPC molecule moves between β4 and β5 (see snapshot after 80 ns in Fig. 7 F). As seen in the amide proton distances between Tyr57 and Thr93 (strands β4 and β5), this part of the structure exhibits local fraying during the pure water simulation (W1; Fig. 7 G, blue curve) and in the water-DHPC system (red curve). This local structural fraying was also indicated by the measured weak protection of this region for backbone amide proton exchange in NMR experiments (Fernandez et al., 2004). A strong hydrogen bond network between the subsequent amino acids Lys59 and Gln91 of strands 4 and 5, respectively, prevents further strand separation (yellow broken lines).
The number of lipids shielding the hydrophobic jacket from water is ∼40, rather low compared to the anticipated result of 80–100 molecules, as deduced from NMR experiments and from rotational correlation times. The respective numbers for simulations M2 and M3 are 37 and 41. A previous simulation study of OmpA (Bond and Sansom, 2003) modeled 80, however, single-chain detergent molecules (DPC) around the hydrophobic membrane-embedded portion of OmpA.
As shown in Figs. 7, B and D, this loose aggregation of DHPC molecules on the OmpX surface effectively suppresses water molecules from the hydrophobic jacket of the protein, while keeping both ends of the β-barrel accessible to water, in agreement with NMR experiments (Fernandez et al., 2004). The suppression of water molecules from the β-barrel region is quantified by the cumulative radial distribution of water oxygens around the backbone nitrogen atoms in Fig. 8. Shown is the radius d of a sphere around the respective nitrogen atom within which, on average, one water molecule is found. This radius stays approximately constant during the simulation time, with d ≈ 4 Å in the regions of loops and turns, but it increases to 8–11 Å in the barrel region.
FIGURE 8.

Water distribution around the OmpX protein for three different time windows of simulation M1. Shown is the distance at which the cumulative radial distribution function of water oxygens around the backbone nitrogen atoms reaches a value of 1. The region of the protruding β-sheet is highlighted by dark shaded bars.
Although water is partly suppressed from the back side of the protruding β-sheet (Fig. 8, dark shaded bars) due to the aggregation of lipids, the forefront remains fully water-accessible, which is reflected by the only weak effect of the aggregation on the cumulative radial distribution of water molecules in this region. This is in agreement with results from measurements of backbone amide proton exchange rates (Fernandez et al., 2004), which cannot distinguish the back side from the forefront.
The protein embedded in the DHPC micelle shows slightly decreased fluctuations with respect to the protein solvated in pure water (see Fig. 2 C, black dotted line). This is especially true for the loop regions, which are stabilized by the built micelles restraining the loop motion.
The micelle in mixed hydrophobic/hydrophilic contact with the back side of the protruding β-sheet stays on the protein surface in all simulations (M1–M3), and the protein surface accounts for a considerable part of this micelle (compare Fig. 7, A and B). In contrast, the larger micelle initially attached to the L1 loop is rather mobile: it detaches in simulation M1 from the L1 loop after ∼70 ns, and moves upward toward the L2 loop and sideways, while staying bound to the protein via a hydrogen bond between a lipid and Arg50 of the β3-strand. In the simulations with increased box sizes, and thereby reduced protein concentration (M2 and M3), however, the large micelle stays at loop L1.
It is difficult to conclude from individual simulations the frequency of occurrence or the lifetime of the observed micelles on the back side of the protruding β-sheet or in the loop-region. To check the frequency of occurrence we performed additional simulations at two different DHPC concentrations with 138 and 200 lipids (206 mM and 294 mM, respectively, systems M3a and M3b; see Table 1), starting from a snapshot after 10 ns of the M3 simulation with (manually) removed extracellular micelles but with retained micellar shielding of the hydrophobic β-barrel (simulation lengths of 14.5 ns and 17.9 ns, respectively). In both control simulations, lipids aggregate in the region of the protruding β-sheet, eight in the system with the higher DHPC concentration (M3b), five in the lower lipid concentration (M3a).
Hydrogen bonding of lipid phosphate oxygens or lipid carbonyl oxygens to lysine amine groups (residue positions 59, 89, and 99), together with partial hydrophobic contacts between the lipid chains and the long hydrophobic side chains of these lysines at the back side of the protruding β-sheet, act as seed for subsequent micelle formation. Also Tyr98 at the outer side of β-strand 6 is observed to bind a DHPC lipid by simultaneous polar and apolar interactions. In M3b, aggregation starts also on the forefront, above the pore axis: a seed lipid for the micelle formation interacts simultaneously via hydrogen bonds between its phosphate oxygen and Arg50 of the β3 strand and (later) between a lipid carbonyl oxygen and Arg133 of the L4 loop. At the end of simulation M3b, three lipids aggregated on top of the L1 and L4 loops and a micelle of eleven DHPC lipids formed on top of the protruding β-sheet, involving a seed lipid hydrogen-bonded to Lys99 on the back side. The number of aggregated lipids in the region of the hydrophobic β-barrel increases from 41 to 52 for simulation M3b (41 for M3a).
Clustering of DHPC lipids in micelles
The total number of lipids within the protein-detergent micelle includes also those DHPC molecules not directly contacting the protein surface but rather aggregated to already protein-bound molecules. Clustering of all DHPC molecules with a simple distance criterium—i.e., a molecule is added to a cluster when at least one heavy atom is within 4 Å of any heavy atom of any other molecule of the cluster—reveals clearly distinguishable cluster sizes (Fig. 9 B): a few DHPC detergent molecules stay unbound (one to two in M1, ∼8 in M2 and M3), and almost all other DHPC molecules are found either in clusters of size 18–20 or in a large cluster with a size between 85 and 105 which can be identified as the micellar shield of the hydrophobic β-barrel domain (see above). Equilibration in terms of cluster sizes proceeds both in the direction of the medium-sized pure detergent micelles and toward the completion of the protein shielding (Fig. 9 A). In simulation M1, the “fusion” of pure detergent micelles by the protein-detergent complex is observed twice: the peaks I, II, and III in the cluster size (Fig. 9 B) are separated by the typical detergent micelle size. The first micelle is incorporated into the protein-detergent complex after ≈65 ns (see Fig. 9 A), binding to the L1 loop; the second detergent micelle fuses after ∼75 ns, with the hydrophobic β-barrel close to the periplasmic side adopting a protuberance-like conformation. Due to the shorter simulation times in simulations M2 and M3, a larger heterogeneity of cluster sizes can be observed both below 30 molecules as well as above 80 molecules. However, even for these simulations a clear trend toward formation of micelles with ∼20 DHPC molecules is observed. The pure detergent micelle sizes fit excellently to the aggregation number of n = 19 ± 1 as determined in small-angle neutron scattering (SANS) experiments at DHPC concentrations of 27–361 mM (Lin et al., 1986). In the M1 simulation, the prevailing micelle consisting of 18 lipids adopts the form of a prolate ellipsoid like the model proposed from the neutron-scattering experiments (Lin et al., 1986), with radii of gyration of 11.6 ± 0.5 Å along the minor axis and 10.3 ± 0.3 Å along the major axis (averaged over 19 ns). Assuming a homogeneous mass distribution within the micelle, it is possible to estimate the axes of the ellipsoidal micelle from the radius of gyration ( ) to a = 16.3 Å for the short axis and b = 20.2 Å for the long axis. Analyzing the radius of gyration separately for the hydrocarbon chains and the headgroup region leads to the model for DHPC micelles depicted in Fig. 10 . The model assumes ellipsoidal shape both for the fatty acyl core region as well as for the outer shell containing the phosphodiester headgroup and the glycerol backbone. The radius of gyration for the outer shell (
 ,
, , as long and short axes, respectively) is given by
 |
(2) |
FIGURE 9.

(A) Lipid cluster sizes and their color-coded frequency of occurrence (fo) as a function of simulation time for runs M1–M3. (B) Time-averaged distribution of cluster sizes. The weighted distributions are averaged over the final 60 ns (simulation M1) or the final 5 ns (M2 and M3), respectively. The gray dashed line indicates the aggregation number of DHPC molecules in pure lipid micelles as determined by small-angle neutron scattering experiments (Lin et al., 1986). I, II, and III are peaks of the protein-detergent mixed micelle.
FIGURE 10.

Schematic picture of a DHPC micelle obtained from simulation results. The lengths of the axes correspond to the radii of gyration of the acyl chains and DHPC headgroups.
The shape of the chain ellipsoid is less elongated than proposed from SANS (a = 7.8 Å, b = 24 Å for the fatty acyl chain ellipsoid, a = 17.8 Å, b = 30 Å for the whole micelle). However, the short axis b of the chain-ellipsoid was fixed to the length of the hydrocarbon chain in the analysis of the SANS experiments (Lin et al., 1986). The volume of the chain-ellipsoid is 25% larger and the volume of the total micelle ∼45% smaller for the simulated micelle as compared to the SANS model. Since the simulated micelle volume (17.3 nm3) is close to the dry volume (18.5 nm3) as obtained in diffusion experiments using NMR (Chou et al., 2004), the discrepancy to the SANS result may reflect hydration effects in SANS. The aspect ratio for the whole DHPC micelle is comparable in simulation (p = 0.62) and experiment (p = 0.59).
The concentration of free detergent molecules varies between 4 and 5 mM for M1 and 16 mM for M2 and M3; the diffusion coefficient for the lipids decreases from ≈6 × 10⁻⁶ cm2/s to ≈2 × 10⁻⁶ cm2/s in simulation M1. Lipids aggregated on the barrel-domain show a diffusion coefficient of 1–2 × 10⁻⁶ cm2/s (M2 and M3), significantly lower than for the rest of the lipids in the simulation box (≈2.5–3.5·10−6 cm2/s). The decrease can be explained by the restricted motion on the (two-dimensional) protein surface.
Comparison to NMR data
Intermolecular NOEs between OmpX amide protons and the hydrophobic tails of the DHPC lipids were reported for the region of the hydrophobic β-barrel. In contrast, NOEs between OmpX amide protons and the polar head methyl groups of the DHPC molecules were observed only for the amide backbone atoms of Met118 and Glu119 and for the indole protons of Trp76 and Trp140 (Fernandez et al., 2002). These findings were interpreted as a micelle shielding the hydrophobic part of the OmpX β-barrel, showing contacts between the lipid headgroups and the protein only in the transition region to the extracellular parts of OmpX (Trp140) and to the periplasmic loops (Met118 and Glu119).
A contact map for the interaction of polar head methyl groups with backbone nitrogen atoms (distance 5.5 Å) computed from simulation M1 is shown in Fig. 11 A. In good agreement with experiment, the tightest interaction between OmpX amide protons and polar head methyl groups of DHPC molecules is observed for Trp76 and Trp140 (upper two rows). As for the backbone nitrogen atoms, most contacts are observed in the loop and turn regions of the OmpX. However, these interactions, as well as the observed few contacts in the region of the hydrophobic β-barrel, have not been observed in NMR experiments (Fernandez et al., 2002).
FIGURE 11.

Contact map between backbone nitrogen atoms (indole nitrogens of Trp76 and Trp140; upper two rows) and both polar head methyl groups of DHPC (A) and the lipid tail CHn groups (B) for simulation M1. Distances <5.5 Å are colored. The gray bars emphasize the loops and turns. Experimentally observed NOEs between amide backbone protons and polar head methyl groups of DHPC are marked by blue arrows (A). The lower graph shows the total number of the respective contacts below 5.5 Å as a function of simulation time. Additionally shown in A and B are pink bars with color intensities according to the measured paramagnetic relaxation enhancement ε using the paramagnetic relaxation probe Gd(DOTA) (A) or 5-DSA (Hilty et al., 2004) (B). White color corresponds to ε = 0, dark pink to ε = εmax (Hilty et al., 2004).
The contacts between the hydrophobic fatty acyl chains of the DHPC molecules and the backbone amide protons of the hydrophobic β-barrel region (Fig. 11 B) agree nicely with the corresponding experimentally observed NOEs (Fernandez et al., 2002). On average, 23 ± 3 lipids show contacts (≤5.5 Å) between their tails and backbone amide protons. The hydrophobic contacts are more frequent close to the periplasmic side as compared to the extracellular side. Additionally, a number of CHn–amide proton contacts are observed in the region of the protruding β-sheet (around loop regions L2 and L3, Fig. 11 B), due to the aggregated micelles in these regions. For these contacts, no NOEs between OmpX amide protons and the DHPC tails were observed (Fernandez et al., 2002). However, in recent NMR experiments by the same group using paramagnetic relaxation probes (Hilty et al., 2004), nonvanishing relaxation enhancements ε were observed not only for the hydrophobic β-barrel portion of the protein but also for parts of the protruding β-sheet when using 5-DSA as a paramagnetic reagent, thus indicating a proximity of DHPC molecules/micelles to the extracellular region (see above). The computed contact maps are in good agreement with these paramagenetic relaxation enhancements (marked pink bars in Fig. 11, A and B): they show contacts between OmpX and DHPC tails also for extracellular amino acids with nonvanishing relaxation enhancements (Fig. 11 B). Moreover, the polar contact map (Fig. 11 A) corresponds well to the measured relaxation enhancements due to a polar Gd(DOTA) probe (Hilty et al., 2004).
The intensity of NOEs between DHPC molecules and protein amide backbone protons can be approximated by computing simple distance averages ( ) for all interproton vectors. This is shown for the different lipid methyl goups in Fig. 12. The largest intensities (lower panels) are computed for contacts of the chain-terminal CHn group (red) to backbone nitrogen atoms of the hydrophobic β barrel. The intensities are reduced with decreasing distance of the CHn groups from the polar head of the DHPC lipid (light gray to black). As expected, minima in intensity are observed for the turns and in the loops and loop-neighbored regions. However, for the L1 and the L3 loops, considerable intensities are seen for contacts to all CHn groups. For the L1 loop, the observed intensity is due to the temporarily bound large micelle. The observed smaller micelle at the back side is responsible for the maxima in intensity in the β4-, β5-, and β6-strands close to the L3 loop. These regions, however, remain accessible to water molecules (see above, Fig. 8), thereby differing from the region of the hydrophobic β-barrel.
FIGURE 12.

Contact time (upper panels) between the backbone nitrogen atoms and the five different CHn groups of the DHPC fatty acyl chains (A, light gray to black, with decreasing distance from the polar headgroup, in simulation M1), and between the backbone nitrogen atoms and the polar head methyl groups (B). Only contacts with distances <5.5 Å and with a lifetime of at least 300 ps are considered. The contact time is given as the fraction of the considered total simulation time (final 60 ns of simulation M1). The lower panels show the approximated NOE intensity by computing  averages for the respective CHn-amide backbone proton distances dij. The residues with experimentally observed NOEs between the DHPC choline head methyl groups and backbone amide protons (gray) or indole protons (black) have been marked by arrows.
Concerning the contacts between amide backbone protons and the choline methyl groups a maximum in intensity is computed for the L2 loop region which was not observed in the NOESY spectra (see above). The contacts are, however, only present for <10% of the simulation time.
CONCLUDING DISCUSSION
The aggregation simulations of DHPC molecules onto OmpX indicate that at detergent concentrations of 200–300 mM, between 37 and 52 DHPC molecules form the micellar shielding of the hydrophobic jacket of OmpX, in contrast to the proposed number of 80 based on NMR studies (Fernandez et al., 2002). This discrepancy can be explained by a previously not considered aggregation of lipids or micelles on the extracellular surface of OmpX. The following experimental data are consistent with the simulation results: 1), the total number of lipids in the protein-lipid mixed micelle; 2), the shielding of water molecules from the hydrophobic β-barrel; 3), the formation of a micellar jacket around the hydrophobic part of the β-barrel; and 4), paramagnetic relaxation enhancement data. The total number of detergent molecules in the protein-detergent mixed micelle (≈100) is well within the experimentally measured range (74–118) (Fernandez et al., 2001, 2002; Hilty et al., 2002); however, hydration water molecules were not considered and the high protein concentration is also expected to slow down rotational molecular tumbling. The DHPC lipids aggregate in the form of a prolate ring around the hydrophobic membrane-embedded portion of OmpX (see Fig. 13 A).
FIGURE 13.

Protein-detergent binding models. Detergent-binding in a prolate micelle (A) and in an oblate micelle (B) (le Maire et al., 2000).
The aggregation number may also be estimated using simple geometrical considerations: If one assumes that the hydrophobic barrel region (approximately cylindrical, with diameter ≈25 Å and height ≈28 Å (Fernandez et al., 2002)) is covered by DHPC lipids, one arrives at possible aggregation numbers between 35 and 55 DHPC molecules. This range is due to the uncertainty in the DHPC headgroup surface area, with values of 65 Å2 as determined for monolayers (Tausk et al., 1974a) or for phosphatidylcholine bilayers, and 102 Å2 as measured for DHPC micelles (Lin et al., 1986), taken at the end of the 8-Å-long hydrocarbon tails. Requiring a prolate binding mode of detergent molecules around the membrane-embedded part of the protein, the interval gives an upper boundary for the aggregation number, since it is assumed that the total barrel surface is covered by detergent molecules (although ∼30% of the barrel surface is hydrophilic). Eighty lipids could only be accommodated assuming a so-called micellar binding (Tanford and Reynolds, 1976; le Maire et al., 2000), i.e., where the lipids bind in an oblate detergent ring around the membrane-embedded portion of the protein (see Fig. 13 B).
That the packing of lipids on the protein surface is comparable to packing in pure DHPC micelles may be inferred from refolding studies (Kleinschmidt et al., 1999) of OmpA: refolding was observed only for detergent concentrations above the particular critical micelle concentration. Also, the presence of the protein did not change the cmc of the detergent (Kleinschmidt et al., 1999). This, however, could be expected if the detergent molecule binding mode and binding affinity differed in pure lipid micelles and in protein-detergent micelles. Aggregation to a protein-detergent mixed micelle and to pure detergent micelles proceeds in parallel. The requirement for preformed detergent aggregates preceding “fusion”, as reported previously for the aggregation of DPC molecules on OmpA (Bond et al., 2004), was not observed in the simulations of OmpX. This may be due to the increased detergent concentration in this study with respect to the before-mentioned study and also to the different detergent (DHPC versus DPC). The single-chain DPC has a cmc of 1.1 mM (DHPC 14–15 mM) and an aggregation number of 50–60 (Lauterwein et al., 1979; Brown et al., 1981) (DHPC, 19 ± 1).
Interestingly, detergent aggregation on the protein surface was not only observed within the region of the hydrophobic β-barrel but also for the predominantly polar extracellular protruding β-sheet. Here, two binding modes could be distinguished: First, metastable micelles might aggregate or grow above the extracellular barrel opening, mainly by polar interactions to the loops. Second, a combined polar and apolar binding of DHPC lipids to lysine residues (Lys59, Lys89, and Lys99) gives rise to stable micelle formation on the back side of the protruding β-sheet. The latter binding mode may be specific for this short-chain phospholipid.
Only little is known about the functions of the eight-stranded β-barrel membrane proteins OmpA and OmpX. Although it has been suggested that OmpA provides a physical linkage between the outer membrane and the underlying peptidoglycan layer (Koebnik et al., 2000), Vogt and Schulz (1999) proposed that the “waving flag” structure of OmpX formed by loops L2 and L3 and the connected β-sheets functions as a fishing rod, i.e., it binds to the surface of various external proteins, thereby defending the bacterium against intruders (Pautsch and Schulz, 2000). The low flexibility of the extracellular loops in OmpX as compared to OmpA is thought to facilitate binding entropically (Pautsch and Schulz, 2000). Furthermore, both β-barrel proteins were shown to bind to antigen presenting cells. Interestingly, OmpA from Klebsiella pneumoniae elicits antigen-specific cytotoxic T-cell responses (Jeannin et al., 2000), whereas OmpX from Escherichia coli does not (Maisnier-Patin et al., 2003). The proposed function of the protruding β-sheet as a fishing rod is supported by the simulation trajectories in that they show a partial fraying of β-strands 4 and 5 in both water and lipid-water environments and even the fishing and subsequent tight binding of a DHPC lipid. Additionally, the growing or aggregation of micelles on the extracellular loops lends support to the function of a fishing rod. However, this aggregation will presumably change the binding affinity for proteins, as compared to the case of a bilayer-embedded OmpX, and thereby hamper possible functional studies on OmpX reconstituted in DHPC.
The high kinetic stability of OmpX in a pure water simulation is consistent with the similarity between x-ray and NMR structures despite the different environments used in the experiments. The protein flexibility in pure water is found to be only marginally larger than in the presence of detergent.
The simulations further provide an atomistic description of pure detergent micelles and allow for a comparison to small-angle neutron scattering data: The number of DHPC lipids in a micelle is nicely reproduced (≈19), whereas the volume of the ellipsoidal micelle (aspect ratio 0.62) is considerably smaller than in the experiment, presumably reflecting the influence of hydration on the SANS data. The agreement in the micelle size is quite noteworthy since the lipid forcefield parameters have not been adjusted to reproduce it. Thus, these results further strengthen the applicability of molecular dynamics simulations not only to the equilibrium description of the dynamics of proteins or preformed protein-lipid mixed micelles but also to aggregation processes like the one described here. Hence, comparative studies of the interaction of various lipids or detergents with membrane proteins, and, e.g., the influence of local anaesthetics on the protein-lipid interface, are becoming accessible to molecular dynamics simulations.
Acknowledgments
We thank Dr. A. A. Gorfe, Dr. U. Alexiev, E. Guarnera, S. Hiller, and R. Pellarin for stimulating discussions. Experimental data were provided by Prof. K. Wüthrich, S. Hiller, and Dr. C. Hilty, who are gratefully acknowledged. The simulations were performed on a Beowulf cluster at the Informatikdienste of the University of Zürich. We thank C. Bollinger, Dr. A. Godknecht, and T. Steenbock for their help in setting up and maintaining the cluster.
This work was supported by the Swiss National Center of Competence in Research in Structural Biology.
Rainer Böckmann's present address is Theoretical and Computational Membrane Biology, Center for Bioinformatics Saar, Universtät des Saarlandes, D-66041 Saarbrücken, Germany.
References
- Arora, A., F. Abildgaard, J. H. Bushweller, and L. K. Tamm. 2001. Structure of outer membrane protein A transmembrane domain by NMR spectroscopy. Nat. Struct. Biol. 8:334–338. [DOI] [PubMed] [Google Scholar]
- Arora, A., and L. K. Tamm. 2001. Biophysical approaches to membrane protein structure determination. Curr. Opin. Struct. Biol. 11:540–547. [DOI] [PubMed] [Google Scholar]
- Ash, W. L., M. R. Zlomislic, E. O. Oloo, and D. P. Tieleman. 2004. Computer simulations of membrane proteins. Biochim. Biophys. Acta. 1666:158–189. [DOI] [PubMed] [Google Scholar]
- Berendsen, H. J. C., J. P. M. Postma, W. F. van Gunsteren, A. D. Nola, and J. R. Haak. 1984. Molecular dynamics with coupling to an external bath. J. Chem. Phys. 81:3684–3690. [Google Scholar]
- Berger, O., O. Edholm, and F. Jähnig. 1997. Molecular dynamics simulations of a fluid bilayer of dipalmitoylphosphatidylcholine at full hydration, constant pressure, and constant temperature. Biophys. J. 72:2002–2013. [DOI] [PMC free article] [PubMed] [Google Scholar]
- Böckmann, R. A., and H. Grubmüller. 2004. Multistep binding of divalent cations to phospholipid bilayers: a molecular dynamics study. Angew. Chem. Int. Ed. Engl. 43:1021–1024. [DOI] [PubMed] [Google Scholar]
- Böckmann, R. A., A. Hac, T. Heimburg, and H. Grubmüller. 2003. Effect of sodium chloride on a lipid bilayer. Biophys. J. 85:1647–1655. [DOI] [PMC free article] [PubMed] [Google Scholar]
- Bond, P. J., J. M. Cuthbertson, S. S. Deol, and M. S. P. Sansom. 2004. MD simulations of spontaneous membrane protein/detergent micelle formation. J. Am. Chem. Soc. 126:15948–15949. [DOI] [PubMed] [Google Scholar]
- Bond, P. J., and M. S. P. Sansom. 2003. Simulations of OmpA in a micelle and in a bilayer. J. Mol. Biol. 329:1035–1053. [DOI] [PubMed] [Google Scholar]
- Bond, P. J., and M. S. P. Sansom. 2004. The simulation approach to bacterial outer membrane proteins. Mol. Membr. Biol. 21:151–161. [DOI] [PubMed] [Google Scholar]
- Bowie, J. U. 2001. Stabilizing membrane proteins. Curr. Opin. Struct. Biol. 11:397–402. [DOI] [PubMed] [Google Scholar]
- Braun, R., D. M. Engelmann, and K. Schulten. 2004. Molecular dynamics simulations of micelle formation around dimeric glycophorin A transmembrane helices. Biophys. J. 87:754–763. [DOI] [PMC free article] [PubMed] [Google Scholar]
- Brown, L. R., C. Bösch, and K. Wüthrich. 1981. Location and orientation relative to the micelle surface for glucagon in mixed micelles with dodecylphosphocholine. Biochim. Biophys. Acta. 642:296–312. [DOI] [PubMed] [Google Scholar]
- Burns, R. A., M. F. Roberts, R. Dluhy, and R. Mendelsohn. 1982. Monomer-to-micelle transition of dihexanoylphosphatidylcholine: carbon-13 NMR and Raman studies. J. Am. Chem. Soc. 2:430–438. [Google Scholar]
- Chou, J. J., J. L. Baber, and A. Bax. 2004. Characterization of phospholipid mixed micelles by translational diffusion. J. Biomol. NMR. 29:299–308. [DOI] [PubMed] [Google Scholar]
- Darden, T., D. York, and L. Pedersen. 1993. Particle Mesh Ewald—An N log(N) method for Ewald sums in large systems. J. Chem. Phys. 98:10089–10092. [Google Scholar]
- de Groot, B. L., and H. Grubmüller. 2001. Water permeation across biological membranes: mechanism and dynamics of Aquaporin-1 and GlpF. Science. 294:2353–2357. [DOI] [PubMed] [Google Scholar]
- Duan, Y., and P. A. Kollman. 1998. Pathways to a protein folding intermediate observed in a 1-microsecond simulation in aqueous solution. Science. 282:740–744. [DOI] [PubMed] [Google Scholar]
- Engel, C. K., L. Chen, and G. G. Prive. 2002. Stability of the lactose permease in detergent solutions. Biochim. Biophys. Acta. 1564:47–56. [DOI] [PubMed] [Google Scholar]
- Esmann, M. 1984. The distribution of C12E8-solubilized oligomers of the na2+k+-ATPase. Biochim. Biophys. Acta. 787:81–89. [DOI] [PubMed] [Google Scholar]
- Esnouf, R. M. 1997. An extensively modified version of MolScript that includes greatly enhanced coloring capabilities. J. Mol. Graph. Model. 15:132–134. [DOI] [PubMed] [Google Scholar]
- Fernandez, C., K. Adeishvili, and K. Wüthrich. 2001. Transverse relaxation-optimized NMR spectroscopy with the outer membrane protein OmpX in dihexanoyl phosphatidylcholine micelles. Proc. Natl. Acad. Sci. 98:2358–2363. [DOI] [PMC free article] [PubMed] [Google Scholar]
- Fernandez, C., C. Hilty, G. Wider, P. Güntert, and K. Wüthrich. 2004. NMR structure of the integral membrane protein OmpX. J. Mol. Biol. 336:1211–1221. [DOI] [PubMed] [Google Scholar]
- Fernandez, C., C. Hilty, G. Wider, and K. Wüthrich. 2002. Lipid-protein interactions in DHPC micelles containing the integral membrane protein OmpX investigated by NMR spectroscopy. Proc. Natl. Acad. Sci. 99:13533–13537. [DOI] [PMC free article] [PubMed] [Google Scholar]
- Gorfe, A. A., R. Pellarin, and A. Caflisch. 2004. Membrane localization and flexibility of a lipidated Ras peptide studied by molecular dynamics simulations. J. Am. Chem. Soc. 126:15277–15286. [DOI] [PubMed] [Google Scholar]
- Hess, B., H. Bekker, H. J. C. Berendsen, and J. G. E. M. Fraaije. 1997. Lincs: A linear constraint solver for molecular simulations. J. Comput. Chem. 18:1463–1472. [Google Scholar]
- Hilty, C., C. Fernandez, G. Wider, and K. Wüthrich. 2002. Side chain NMR assignments in the membrane protein OmpX reconstituted in DHPC micelles. J. Biomol. NMR. 23:289–301. [DOI] [PubMed] [Google Scholar]
- Hilty, C., G. Wider, C. Fernandez, and K. Wüthrich. 2004. Membrane protein-lipid interactions in mixed micelles studied by NMR spectroscopy with the use of paramagnetic reagents. ChemBioChem. 5:467–473. [DOI] [PubMed] [Google Scholar]
- Hopkins, A. L., and C. R. Groom. 2002. The druggable genome. Nat. Rev. Drug Discov. 1:727–730. [DOI] [PubMed] [Google Scholar]
- Jeannin, P., T. Renno, L. Goetsch, I. Miconnet, J. P. Aubry, Y. Delneste, N. Herbault, T. Baussant, G. Magistrelli, C. Soulas, P. Romero, J. C. Cerottini, and J. Y. Bonnefoy. 2000. OmpA targets dendritic cells, induces their maturation and delivers antigen into the MHC class I presentation pathway. Nat. Immunol. 1:502–509. [DOI] [PubMed] [Google Scholar]
- Jensen, M. O., O. G. Mouritsen, and G. H. Peters. 2004. Simulations of a membrane-anchored peptide: Structure, dynamics, and influence on bilayer properties. Biophys. J. 86:3556–3575. [DOI] [PMC free article] [PubMed] [Google Scholar]
- Jorgensen, W. L., J. Chandrasekhar, and J. D. Madura. 1983. Comparison of simple potential functions for simulating liquid water. J. Chem. Phys. 79:926–935. [Google Scholar]
- Kaminski, G., R. A. Friesner, J. Tirado-Rives, and W. L. Jorgensen. 2001. Evaluation and reparametrization of the OPLS-AA force field for proteins via comparison with accurate quantum chemical calculations on peptides. J. Phys. Chem. B. 105:6474–6487. [Google Scholar]
- Khademi, S., J. O'Connell, J. Remis, Y. Robles-Colmenares, L. J. W. Miercke, and R. M. Stroud. 2004. Mechanism of ammonia transport by Amt/MEP/Rh: Structure of AmtB at 1.35 Å. Science. 305:1587–1594. [DOI] [PubMed] [Google Scholar]
- Kleinschmidt, J. H. 2003. Membrane protein folding on the example of outer membrane protein A of Escherichia coli. Cell. Mol. Life Sci. 60:1547–1558. [DOI] [PMC free article] [PubMed] [Google Scholar]
- Kleinschmidt, J. H., M. C. Wiener, and L. K. Tamm. 1999. Outer membrane protein A of E. coli folds into detergent micelles, but not in the presence of monomeric detergent. Protein Sci. 8:2065–2071. [DOI] [PMC free article] [PubMed] [Google Scholar]
- Koebnik, R., K. P. Locher, and P. V. Gelder. 2000. Structure and function of bacterial outer membrane proteins: barrels in a nutshell. Mol. Microbiol. 37:239–253. [DOI] [PubMed] [Google Scholar]
- Lauterwein, J., C. Bösch, I. R. Brown, and K. Wüthrich. 1979. Physicochemical studies of the protein-lipid interactions in melittin-containing micelles. Biochim. Biophys. Acta. 556:244–264. [DOI] [PubMed] [Google Scholar]
- Lee, A. G. 2003. Lipid-protein interactions in biological membranes: a structural perspective. Biochim. Biophys. Acta. 1612:1–40. [DOI] [PubMed] [Google Scholar]
- le Maire, M., P. Champeil, and J. V. Moller. 2000. Interaction of membrane proteins and lipids with solubilizing detergents. Biochim. Biophys. Acta. 1508:86–111. [DOI] [PubMed] [Google Scholar]
- Lin, T. L., S. H. Chen, N. E. Gabriel, and M. F. Roberts. 1986. The use of small-angle neutron scattering to determine the structure and interaction of dihexanoylphosphatidylcholine micelles. J. Am. Chem. Soc. 108:3499–3507. [Google Scholar]
- Lindahl, E., B. Hess, and D. van der Spoel. 2001. GROMACS 3.0: A package for molecular simulation and trajectory analysis. J. Mol. Model. 7:306–317. [Google Scholar]
- Maisnier-Patin, K., M. Malissard, P. Jeannin, J.-F. Haeuw, J.-C. Corbiere, G. Hoeffel, J.-F. Gauchat, T. Nguyen, J. M. Saez, and Y. Delneste. 2003. The outer membrane protein X from Escherichia coli exhibits immune properties. Vaccine. 21:3765–3774. [DOI] [PubMed] [Google Scholar]
- Marassi, F. M., and S. J. Opella. 1998. NMR structural studies of membrane proteins. Curr. Opin. Struct. Biol. 8:640–648. [DOI] [PMC free article] [PubMed] [Google Scholar]
- Marrink, S. J., E. Lindahl, O. Edholm, and A. E. Mark. 2001. Simulation of spontaneous aggregation of phospholipids into bilayers. J. Am. Chem. Soc. 123:8638–8639. [DOI] [PubMed] [Google Scholar]
- Marrink, S. J., D. P. Tieleman, and A. E. Mark. 2000. Molecular dynamics simulation of the kinetics of spontaneous micelle formation. J. Phys. Chem. B. 104:12165–12173. [Google Scholar]
- Marsh, D., and T. Pali. 2004. The protein-lipid interface: perspectives from magnetic resonance and crystal structures. Biochim. Biophys. Acta. 1666:118–141. [DOI] [PubMed] [Google Scholar]
- Merritt, E. A., and D. J. Bacon. 1997. Raster3D: photorealistic molecular graphics. Methods Enzymol. 277:505–524. [DOI] [PubMed] [Google Scholar]
- Miyamoto, S., and P. A. Kollman. 1992. Settle: an analytical version of the shake and rattle algorithm for rigid water models. J. Comput. Chem. 13:952–962. [Google Scholar]
- Opella, S. J. 1997. NMR and membrane proteins. Nat. Struct. Biol. 4:845–848. [PubMed] [Google Scholar]
- Palczewski, K., T. Kumasaka, T. Hori, C. A. Behnke, H. Motoshima, B. A. Fox, I. L. Trong, D. C. Teller, T. Okada, R. E. Stenkamp, M. Yamamoto, and M. Miyano. 2000. Crystal structure of rhodopsin: A G protein-coupled receptor. Science. 289:739–745. [DOI] [PubMed] [Google Scholar]
- Pandit, S. A., D. Bostick, and M. L. Berkowitz. 2003. Molecular dynamics simulation of a dipalmitoylphosphatidylcholine bilayer with NaCl. Biophys. J. 84:3743–3750. [DOI] [PMC free article] [PubMed] [Google Scholar]
- Pautsch, A., and G. E. Schulz. 1998. Structure of the outer membrane protein A transmembrane domain. Nat. Struct. Biol. 5:1013–1017. [DOI] [PubMed] [Google Scholar]
- Pautsch, A., and G. E. Schulz. 2000. High-resolution structure of the OmpA membrane domain. J. Mol. Biol. 298:273–282. [DOI] [PubMed] [Google Scholar]
- Sanders, C. R., A. Kuhn Hoffmann, D. N. Gray, M. H. Keyes, and C. D. Ellis. 2004. French swimwear for membrane proteins. ChemBioChem. 5:423–426. [DOI] [PubMed] [Google Scholar]
- Sanders, C. R., and J. K. Myers. 2004. Disease-related misassembly of membrane proteins. Annu. Rev. Biophys. Biomol. Struct. 33:25–51. [DOI] [PubMed] [Google Scholar]
- Schulz, G. E. 2002. The structure of bacterial outer membrane proteins. Biochim. Biophys. Acta. 1565:308–317. [DOI] [PubMed] [Google Scholar]
- Shivanna, B. D., and E. S. Rowe. 1997. Preservation of the native structure and function of Ca2+-ATPase from sarcoplasmic reticulum. Biochem. J. 325:533–542. [DOI] [PMC free article] [PubMed] [Google Scholar]
- Smart, O. S., J. G. Neduvelil, X. Wang, B. A. Wallace, and M. S. P. Sansom. 1996. HOLE: a program for the analysis of the pore dimensions of ion channel structural models. J. Mol. Graph. 14:354–360. [DOI] [PubMed] [Google Scholar]
- Sui, H. X., B. G. Han, J. K. Lee, P. Walian, and B. K. Jap. 2001. Structural basis of water-specific transport through the AQP1 water channel. Nature. 414:872–878. [DOI] [PubMed] [Google Scholar]
- Tajkhorshid, E., P. Nollert, M. O. Jensen, L. J. W. Miercke, J. O'Connell, R. M. Stroud, and K. Schulten. 2002. Control of the selectivity of the aquaporin water channel family by global orientational tuning. Science. 296:525–530. [DOI] [PubMed] [Google Scholar]
- Tanford, C., and J. A. Reynolds. 1976. Characterization of membrane proteins in detergent solutions. Biochim. Biophys. Acta. 457:133–170. [DOI] [PubMed] [Google Scholar]
- Tausk, R. J. M., J. V. Esch, J. Karmiggelt, G. Voordouw, and J. T. G. Overbeek. 1974a. Physical chemical studies of short-chain lecithin homologues. II: Micellar weights of dihexanoyl- and diheptanoyllecithin. Biophys. Chem. 1:184–203. [DOI] [PubMed] [Google Scholar]
- Tausk, R. J. M., J. Karmiggelt, C. Oudshorn, and J. T. G. Overbeek. 1974b. Physical chemical studies of short-chain lecithin homologues. I: Influence of the chain length of the fatty acid ester and of electrolytes on the critical micelle concentration. Biophys. Chem. 1:175–183. [DOI] [PubMed] [Google Scholar]
- Vogt, J., and G. E. Schulz. 1999. The structure of the outer membrane protein OmpX from Escherichia coli reveals possible mechanisms of virulence. Structure. 7:1301–1309. [DOI] [PubMed] [Google Scholar]