

Abstract
We have used molecular dynamics simulations to investigate the effect of phosphorylation and mutation on the cytoplasmic domain of phospholamban (PLB), a 52-residue protein that regulates the calcium pump in cardiac muscle. Simulations were carried out in explicit water systems at 300 K for three peptides spanning the first 25 residues of PLB: wild-type (PLB1–25), PLB1–25 phosphorylated at Ser16 and PLB1–25 with the R9C mutation, which is known to cause human heart disease. The unphosphorylated peptide maintains a helical conformation from 3 to 15 throughout a 26-ns simulation, in agreement with spectroscopic data. Comparison with simulations of a fourth peptide truncated at Pro21 showed the importance of the region from 17 to 21 in preventing local unfolding of the helix. The results suggest that residues 11–16 are more likely to unfold when specific capping motifs are not present. It is proposed that protein kinase A exploits the intrinsic flexibility of the 11–21 region when binding PLB. In agreement with available CD and NMR data, the simulations show a decrease in the helical content upon phosphorylation. The phosphorylated peptide is characterized by helix spanning residues 3–11, followed by a turn that optimizes the salt-bridge interaction between the side chains of the phosphorylated Ser-16 and Arg-13. Replacing Arg-9 with Cys results in unfolding of the helix from C9 and an overall decrease of the helical conformation. The simulations show that initiation of unfolding is due to increased solvent accessibility of the backbone atoms near the smaller Cys. It is proposed that the loss of inhibitory potency upon Ser-16 phosphorylation or R9C mutation of PLB is due to a similar mechanism, in which the partial unfolding of the cytoplasmic helix of PLB results in a conformation that interacts with the cytoplasmic domain of the calcium pump to relieve its inhibition.
INTRODUCTION
The 52-mer protein phospholamban (PLB) regulates calcium stores by inhibiting the sarcoplasmic reticulum Ca-ATPase (SERCA), a membrane-bound enzymatic calcium pump that triggers cardiac relaxation by lowering cytosolic Ca2+ concentrations. Phosphorylation of PLB relieves the inhibition, resulting in a return of Ca2+ into the sarcoplasmic reticulum and the start of a new cardiac cycle (MacLennan and Kranias, 2003).
Phospholamban (shown schematically in Fig. 1) regulates SERCA by binding to both membrane and cytosolic regions of the enzyme. The transmembrane domain inhibits SERCA at submicromolar [Ca2+], whereas phosphorylation of the cytoplasmic domain at Ser-16 relieves this inhibition. The interaction mode has recently been modeled by docking the NMR-derived structure of PLB (Mortishire-Smith et al., 1995; Pollesello et al., 1999; Lamberth et al., 2000; Zamoon et al., 2003) to the x-ray structure of SERCA-1A in its thapsigargin-bound, calcium-free state (Toyoshima et al., 2003). According to this model, the transmembrane helix of PLB fits into a groove formed by helices M2, M4, M6, and M9 of SERCA. In the cytosol, residue K3 of PLB reaches near residue K400 of SERCA, whereas the loop domain (residues 17–21) interacts with residues in loop 67 of the pump (Asahi et al., 2000). The model could not clearly define the interaction of domain IA with SERCA because of a poor fit between SERCA and the NMR-derived structure of PLB in this region. Satisfactory docking was achieved after unfolding the domain I helix observed by NMR. It was proposed that unfolding was a necessary step before phosphorylation at Ser16 by protein kinase A (PKA) (Toyoshima et al., 2003).
FIGURE 1.

Schematic representation of the PLB sequence. Horizontal lines denote the membrane boundaries and amino acids are shown in circles using their one-letter code. The arrow points to the Ser-16 phosphorylation site. (Domain IA) Short amphiphilic helix (residues 2–16). (Loop domain) Hinge region (residues 17–21). (Domain IB) Hydrophilic residues of the transmembrane helix. (Domain II) Hydrophobic residues of the transmembrane helix (residues 31–52). Domain boundaries are defined as in Metcalfe et al. (2004).
Recent studies have suggested that domain IA maintains a helical structure when bound to SERCA-1A, whereas the loop domain undergoes conformational changes responsible for PKA recognition (Chen et al., 2003). The importance of structural and/or chemical integrity of domain IA for recognition by the pump is further shown by the effect of mutations in this region. Mutation of Arg-9 to Cys severely diminishes PLB inhibitory activity in vitro and blocks wild-type PLB phosphorylation, resulting in dilated cardiomyopathy in dominant phenotypes (Schmitt et al., 2003). An extensive site-directed mutagenesis study has shown that region IA is highly sensitive to side-chain replacement, as single point mutations of 13 out of 20 residues either reduce or abolish PLB's inhibitory potency (Toyofuku et al., 1994).
Domain IA of PLB experiences environments of very different polarities. As an isolated monomer, it lies on the membrane surface (Mascioni et al., 2002; Zamoon et al., 2003; Karim et al., 2004), but it is in the cytosol when interacting with SERCA (Toyoshima et al., 2003; Kirby et al., 2004). Experimental studies have shown that the helical order of domain IA of PLB is highly sensitive to the chemical environment (Karim et al., 2004), suggesting that the helix/coil equilibrium of this region is the key for understanding both the interaction with the pump and its recognition by PKA. Studies of PLB obtained in low-polarity media generally agree on the helical structure of membrane-spanning domain. However, the helical content of domain IA decreases in polar solvents and upon phosphorylation. Circular dichroism (CD) spectra of PLB1–25 show 60% helical content in 30% TFE (Mortishire-Smith et al., 1998) but only 17% in water (Lockwood et al., 2003). NMR spectra of PLB1–25 in TFE have shown a shortening of the domain IA helix down to residues 2–12 upon phosphorylation (Mortishire-Smith et al., 1995; Pollesello and Annila, 2002). The structural details of domain IA also vary with solvent. In TFE, the domain IA helix spans residues 3–18, followed by a β-III turn from residue 19 to 21 (Pollesello et al., 1999). The domain IA helix is shorter in a CH4/CHCl3 mixture, spanning residues 4–16, whereas residues 17–20 form a short hinge before the start of the domain II helix at Pro-21 (Lamberth et al., 2000). In DPC micelles, domain IA is helical from residue 2–16, whereas residues 17–21 form a β-IV turn of five amino acids, (Zamoon et al., 2003).
Molecular dynamics (MD) simulations have successfully studied the relative stability of the helical conformation in short peptides (Levy et al., 2001; Bystroff and Garde, 2003). The effect of phosphorylation as a function of sequence position has been studied using Monte Carlo/stochastic dynamics simulations (Smart and McCammon, 1999) and applications of a modified Lifson-Roig helix-coil model (Andrew et al., 2002). In this study, we have used simulations to obtain atomic-level insight into the mechanism of peptide dynamics of domain I of PLB and the effect of phosphorylation and mutation on the helix. The peptides used in the study were PLB1–25, PLB1–25 phosphorylated at S16 (P16-PLB1–25), and a mutant in which ARG-9 is replaced with cysteine (R9C-PLB1–25). Peptides PLB1–25 and P16-PLB1–25 were chosen for comparison with experimental results (Mortishire-Smith et al., 1995, 1998; Lockwood et al., 2003). A shorter peptide capped at Pro-21, PLB1–21, was used to study unfolding from an ideal α-helical conformation and to rationalize the differences in helical content observed in various solvents. Comparison of the helical propensity of wild-type versus the R9C mutant provided a mechanistic explanation for the observed inactivity of the mutant (Schmitt et al., 2003).
METHODS
Molecular dynamics simulations
Simulations were carried out using the GROMACS 3.1.4 package (Lindhal et al., 2001) with the GROMOS96 force field (van Gunsteren et al., 1996) and the simple point charge (SPC) water model (Berendsen et al., 1981). The simulation protocol consisted of immersing the solute into an equilibrated water box containing 4927 water molecules and applying periodic boundary conditions. Long-range electrostatic interactions were calculated using particle-mesh Ewald (PME). The total charge of the system was set to zero by adding chlorine ions. Systems were first energy-minimized using a steepest descent algorithm for 1000 steps and a convergence cutoff of 2000 kJ × mol−1 × nm−1. Equilibration was reached by first performing a short simulation under NVT conditions were positional constraints on the peptide were gradually lowered from 1000 kJ × mol−1 × nm−2 to zero. Simulations were then continued under NPT conditions until the indicated time. Temperature and pressure were kept at 300 K and 1 bar, respectively, using the Berendsen algorithm (Berendsen et al., 1984) with τT = 0.1 and τP = 0.5.
Simulations of PLB1–25 made use of the average NMR structure in DPC micelles (Zamoon et al., 2003) by removing the additional first residue (Ala in the NMR structure), truncating the peptide at residue 25, and adding charged N- and C-termini. Therefore, the peptide sequence was identical to the uncapped peptide examined by CD (Mortishire-Smith et al., 1995). For simulations of R9C- and P16-PLB1–25, the Arg-9 and Ser-16 side chains were replaced with Cys and phosphoserine, respectively. Phosphoserine parameters were used as provided by the GROMOS96 force field. The starting conformation of PLB1–21 was an ideal α-helix (φ = −65°, ψ = −40°), capped at the C-end with an N′-methyl group.
Analyses of the MD trajectories were performed using the utilities of the GROMACS software package (Lindhal et al., 2001). Hydrogen bonds were computed using a 2.5 Å distance cutoff (hydrogen-acceptor distance) and a 60° angle cutoff (donor-hydrogen-acceptor angle).
RESULTS
Molecular dynamics simulations
PLB1–25
Simulations used the average NMR structure observed in DPC micelles (Zamoon et al., 2003). This structure is an α-helix from residue 2–16, followed by β-IV type turn from 17 to 21. Residues 22–25 form the beginning of the domain IB helix. The NMR structure is characterized by several side chain-side chain and side chain-backbone hydrogen bonds. These occur between the side chains of R9 and both E2 and Q5, between S10 and R13, and between the backbone atoms of T8 and A10 with the side chains of V4 and R14, respectively. In region IB, the side chains of residues Q22, Q23, and R25 hydrogen bond to those of R13, R14, and E19, respectively.
During simulations, the peptide structure departs from the NMR-based structure (Fig. 2 A), largely because of unfolding of the C-terminal 22–25 region. Residues 3–15 are in a helical conformation ∼70% of the time, giving an overall helicity close to 40%, as calculated from the last 23 ns of the MD trajectory (Fig. 3 A). The backbone dihedral angles of T17, M20, and P21 confine to similar regions of the Ramachandran plot as the NMR structures (Zamoon et al., 2003) (Fig. 4). The largest changes occur for Ile-18 and Glu-19, and consist mainly of a 180° flip of the peptide plane between these two residues. The conformational change gives rise to new hydrophobic interactions between the side chains of A15, I18, and M20 (Fig. 5 A). These three residues form a hydrophobic cap that connects to the hydrophobic face of the α-helix spanning residues 3–15. The carboxyl and amide groups of A15, I18, and M20 cluster together with the side chains of S16, T17, and E19 and produce a polar face which connects to the hydrophilic face of the α-helix.
FIGURE 2.

RMS deviation of backbone atoms during MD trajectories. (A) PLB1–25; (B) PLB1–21; (C) P16-PLB1–25; and (D) R9C-PLB1–25.
FIGURE 3.

Plot of percent time spent in the helical conformation by each residue in four PLB peptides. (A) PLB1–25; (B) PLB1–21; (C) P16-PLB1–25; and (D) R9C-PLB1–25.
FIGURE 4.

(φ, ψ) Ramachandran plots of residues in the C-terminal region of PLB1–25. White circles indicate values observed in the NMR structure (Zamoon et al., 2003).
FIGURE 5.
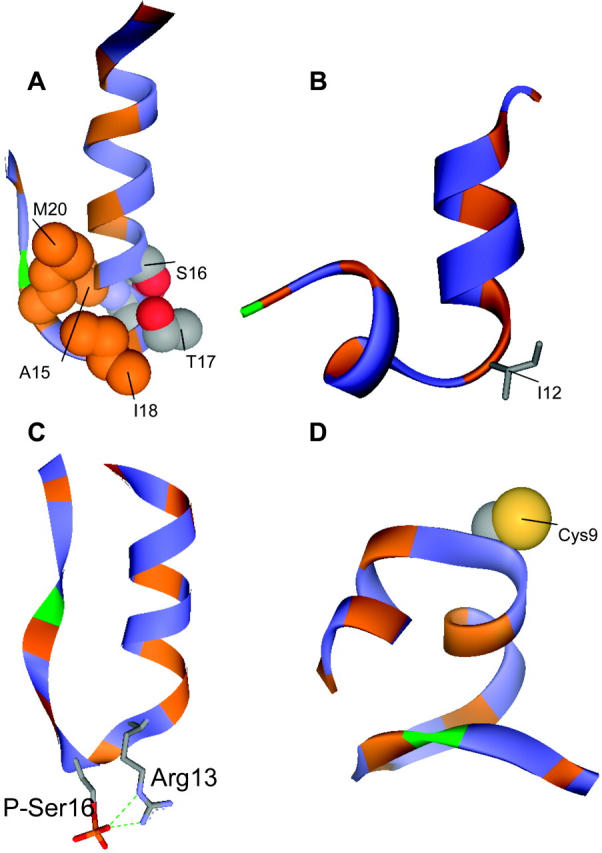
Ribbon representation of the PLB peptides. Hydrophobic residues are shown in orange and polar residues in blue. Proline 21 is shown in green. (A) Snapshot of PLB1–25 at 20 ns. Residues A15, S16, T17, I18, and M20 are shown in CPK to illustrate side-chain interactions in the turn region. (B) Snapshot of PLB1–21 at 24 ns. (C) Snapshot of P16-PLB1–25 at 13 ns, showing hydrogen bond between P-Ser-16 and Arg-13. (D) Snapshot at 24 ns of R9C-PLB1–25.
Hydrogen bond contributions from sidechains of residues in the α-helix are negligible throughout the 26-ns trajectory. In particular, hydrogen bonds between Arg-9 and neighboring residues, such as with Glu-2 and Gln-5, are present in 6% of the trajectory. Hydrogen bonds between the polar Thr-8 side chain and the backbone carbonyl of either Val-4 or Gln-5 occur 5% of the time.
PLB1–21
Simulations started with PLB1–21 in an ideal α-helical conformation. The helix rapidly unfolds from the C-terminal end by ∼5 residues in the first five ns of simulation (Fig. 2 B). Up to 12 ns residues 11 and 12 are in a helical conformation 20% of the time. Plot of total helicity per residue (Fig. 3 B) shows local unfolding of residues A11 and L12, whereas region 13–15 remains confined to the α-region 50% of the time. A snapshot of the simulation at 24 ns (Fig. 5 B) shows the conformation to be a N-terminal helix up to residue 10 capped by a turn at residues 11 and 12, followed by one helical turn from residue 13 to 16.
P16-PLB1–25
Partial unfolding occurs after only 5 ns (Fig. 2 C) from the C-terminus end up to residue 12. The shorter helix spans residues 2–∼11 and it is stable to 22 ns, followed by further unfolding to residue R9. Over the last 13 ns of the simulation, ∼35% of the residues are in a helical conformation 70% of the time, thus giving total helix content of ∼25% (Fig. 3 C). The phosphorylated peptide adopts a new conformation characterized by a salt-bridge between the phosphoserine and Arg-13 side chains, as shown in Fig. 5 C. Further unfolding of the helix to residue 9 results in a salt-bridge of the phosphate with both Arg-13 and Arg-14. The backbone region from residue 13 to 17 undergoes a conformational switch at ∼5 ns characterized by dihedral angles change at R13 and S16 from the α- to the β-region of the Ramachandran plot (Fig. 6). The conformation from R13 to S16 resembles a β-I type turn. The Cα-Cα distance between these two residues is <7 Å and the φ/ψ angles of R14 and A15 are in the range of those observed for β-I turns (Hutchinson and Thornton, 1994). However, the R13 carboxyl and the S16 NH are not hydrogen bonded. The turn creates hydrophobic interactions between I12 and I18 on one side and a clustering of the charged residues P-Ser-16, R13, E19, and R14 on the opposite face of the peptide.
FIGURE 6.

(φ, ψ) Ramachandran plots of residues 11–22 of P16-PLB1–25.
R9C-PLB1–25
Two separate simulations were carried out for a total of 45 ns. The plot of the helicity per residue (Fig. 3 D), averaged over the two simulations, clearly shows a decrease in the time spent in the helical conformation compared to the wild-type peptide (Fig. 3 A). The behavior of the C-terminal residues from 17 to 25 is similar to that of the wild-type peptide. The snapshot of the peptide taken at 24 ns (Fig. 5 D) shows a helix break caused by local unfolding from Cys-9.
DISCUSSION
Comparison with experimental data on phosphorylation of PLB
CD experiments on PLB1–25 in aqueous solution have shown the presence of a small amount (∼20%) of helical structure (Mortishire-Smith et al., 1995; Lockwood et al., 2003). However, in the presence of 30% TFE, the α-helical population was 60%, whereas phosphorylation at Ser-16 reduced it to 27% (Mortishire-Smith et al., 1995). Under similar conditions, NMR structural data on PLB1–25 (Mortishire-Smith et al., 1995) and PLB1–36 (Pollesello and Annila, 2002) indicated decreased helical content upon phosphorylation in Ser-16. A fluorescence energy transfer study suggested a decrease in the width of the distance distribution between ends of the PLB cytoplasmic domain upon phosphorylation, but this provided no direct information about helical content (Li et al., 2003). In line with the NMR and CD data, we find a decrease in the α-helical fraction upon phosphorylation. Quantitative comparison of the helical fraction depends on various factors, such as intrinsic accuracy of the CD technique (5–10% accuracy limit, Lockwood, personal communication), the SPC water model used in this study, and the length of the simulation. The SPC water model underestimates the bulk dielectric permittivity by ∼20% (van der Spoel et al., 1998). By comparison, the dielectric permittivity of a 30% TFE solution is ∼60, similar to that of SPC water (van der Spoel et al., 1998). Simulations conducted using different dielectric values have shown that the helical fraction increases sixfold when the dielectric constant changes from 80 to 40 (Vila et al., 2000). Therefore, the difference between our computed fraction and the experimental results may be explained by the smaller dielectric permittivity of SPC water compared to bulk water. The extent of the helical conformation, from residue 3 to residue 16 for PLB1–25 and from 3 to 10 for P16-PLB1–25 is also in agreement with the NMR data in TFE (Mortishire-Smith et al., 1995). The computed trend in helical content between the wild-type and the phosphorylated peptide (∼50% reduction) is also quantitatively similar to that observed ratio. A complete study of the helix-coil equilibrium of domain IA, sampling both the folded and unfolded states (Snow et al., 2002) may improve the accuracy of the calculated helical fraction. However, the agreement with the experimental results suggests that the simulations are representative of the most populated structures.
Phosphorylation at Ser-16 decreases the helical content, but results in a well-defined structure in region 3–17 (Fig. 5 C). The extent of the helix, mainly from residues 3 to 11, is in good agreement with experiments. The NMR data of phosphorylated PLB1–36 showed a helical conformation up to I12 (Pollesello and Annila, 2002), but measured chemical shifts indicated a loss of helical structure starting at residue R9. A hydrogen bond was also observed between the phosphorylated S16 and Arg-13. The MD simulations shows that when the helix extends to residue 11, the salt-bridge is between P-Ser-16 and Arg-13, whereas unfolding to residue 9 allows for interaction of Ser-16 with both Arg-13 and Arg-14. Steric and ionic interactions between the phosphate group and R13 and R14 probably drive the conformational switch from R13 to S16 to optimize the salt-bridge between S16 and R13. The conformational switch consists of a movement of residues R13 and P-S16 from the α- to the β-region of the Ramachandran plot. Backbone angles of R14 and A15 are characterized by smaller φ values and higher ψ values than those of a standard helix (Fig. 6).
A previous study of CD and titration data on model peptides using a modified Lifson-Roig theory has shown that phosphorylation in the helix interior destabilizes the helix by 1.2 kcal/mol relative to serine (Andrew et al., 2002) consistent with our conclusion that phosphorylation destabilizes the helix in domain IA of PLB. Thus the effect of PLB phosphorylation on FRET (Li et al., 2003), decreasing the range of end-to-end distances in PLB, is probably not due to an increase in the helical content, but to the creation of a turn conformation stabilized by the salt-bridge between P-Ser-16 and Arg-13 side chains.
Interactions stabilizing the helix
Hydrophobic side-chain interactions at the C-end cap the helix (Fig. 5 A), thus preventing unfolding. The simulated structures are characterized by hydrophobic interactions between the side chains of A15, I18, and M20. This cluster connects with the nonpolar face formed by V4, A11, and I12 (Fig. 5 A), thus dividing the peptide into two distinct polar and nonpolar faces. Specific side chain-side chain hydrogen bonds between domain IA and the loop domain or domain IB were not observed, suggesting that local interactions at the C-cap are sufficient to prevent unfolding from this end. The conformation of the loop domain differs from the NMR structure (Zamoon et al., 2003) mainly at residues I18 and E19, where the peptide plane between these two residues undergoes a 180° flip. As a result, Met-20 side chain faces the interior of the loops, although it is exposed to the solvent in the NMR structure. In contrast to the simulation results, the NMR-derived structures show that capping is mostly through backbone hydrogen bonds (Zamoon et al., 2003). The backbone dihedral angles φ and ψ of residues A15 and S16 are in the α-helical region of the Ramachandran plot but have large deviations from the mean values of −64 ± 7° and −41 ± 7°, respectively (Aurora and Rose, 1998). The result is a tightening of the helix at this end and the carboxyl of R13 is within hydrogen bond distance of the amide of three residues, S16, T17, and I18. Therefore, the transition from the domain IA helix to the loop domain occurs mainly through these three backbone hydrogen bonds in the NMR structures in lipid micelles, whereas it is through hydrophobic interactions in simulations of the shorter peptide in aqueous solution.
The sequence of the cytoplasmic domain of PLB determines its intrinsic helical propensity. In particular, Pro at position 21 could function as either an N-cap for the membrane-spanning helix or a C-cap for the domain 1A helix. The NMR-derived structure shows Pro-21 to be an N-cap, whereas the preceding three residues (Ile-18 to Met-20) are unfolded. The MD simulations of PLB1–21 may offer an explanation for the observed structural behavior of this region. When PLB1–21 is in an ideal α-helical conformation, fraying occurs up to the Thr-17 carboxyl because of the missing amide hydrogen at Pro-21. This unfolding transition is seen during the first 5 ns of the simulation (Fig. 2 B). Structures between 5 and 11 ns are characterized by partial local unfolding at 11 and 12, whereas residues 13–16 form one helical turn 50% of the time. The helix break allows the formation of new side chain-side chain and side chain-main chain hydrogen bonds that persist throughout the simulations and likely prevent further unfolding of the N-terminal helix. Such behavior where fraying from the C-end is followed by the appearance of kinks and unfolding/refolding of shorter helical spans, is similar to that observed in previous MD simulations of model α-helical peptides (Daggett and Levitt, 1992).
Dynamic equilibrium between folded and unfolded structures
The lack of helical structure from residues 17 to 20 observed experimentally in all solvents is probably due to fraying from Pro-21. Differences in helical content observed in solvents of different polarities are probably due to differences in the folding/unfolding equilibrium of shorter helical spans in the 11–16 region. EPR spectra of PLB in lipid bilayers have detected two well-resolved conformational states in the cytoplasmic domain (Karim et al., 2004). A TOAC spin label at position 11 identified an ordered component consistent with a stable α-helical conformation. A second component indicated nearly isotropic nanosecond disorder, implying a locally unfolded intermediate, as suggested by the results of this study. Phosphorylation at S16 shifts the conformational equilibrium substantially toward the unfolded state (C. Karim, University of Minesota, personal communication, 2004), again in agreement with simulations (Fig. 3 C).
X-ray structures of model peptides bound to protein kinases (Johnson et al., 1998) do not show secondary structure for the six residues preceding the phosphorylation site. However, the secondary structure of peptides before phosphorylation may be a poor predictor of the conformation observed when bound to PKA (Kreegipuu et al., 1998). Apparently, conformational flexibility may be more important than the specific secondary structure before binding. The MD simulations show that the C-terminus of the domain A is more likely to unfold if capping interactions are not present to stabilize the domain 1A helix after fraying from Pro-21. It is likely that PKA takes advantage of the intrinsic flexibility in the 11–16 region for molecular recognition. Local unfolding may also facilitate interaction of the N-terminal helical region with SERCA, as first suggested by Toyoshima et al. (2003). In their docking study, Arg-13 and Arg-14 unwind from the helical conformation, are exposed to solvent, and are available for PKA binding. This model is supported experimentally by EPR and NMR data showing that SERCA binds preferentially to an extended conformation of PLB in which the cytoplasmic domain is partially unfolded (Kirby et al., 2004; Zamoon et al., 2005). It is probably this partially unfolded conformation of PLB, stabilized by phosphorylation that binds to the cytoplasmic domain of SERCA and relieves the inhibition caused by the transmembrane domain.
The R9C-mutation
Simulations of R9C-PLB1–25 show decreased helicity with respect to the wild-type peptide (Fig. 3). The loss of helical conformation is caused by an initial local distortion near Cys-9, already observed during the first 100 ps of simulations, as shown in the snapshot in Fig. 7. The distortion then gives rise to a helix break and further unfolding from C9 to both ends. Mutation of Arg to Cys replaces a large and charged side chain with one that is smaller and hydrophobic. Possible effects due to side-chain replacement are changes in the electrostatic interactions with the other side chains, changes in the side-chain packing, and changes in water accessibility. Previous studies (Vila et al., 2000; Garcia and Sanbonmatsu, 2002) have shown that large polar side chains restrict solvent accessibility of the backbone atoms of nearby residues, thus favoring helix stabilization, whereas the opposite is true for smaller side chains.
FIGURE 7.
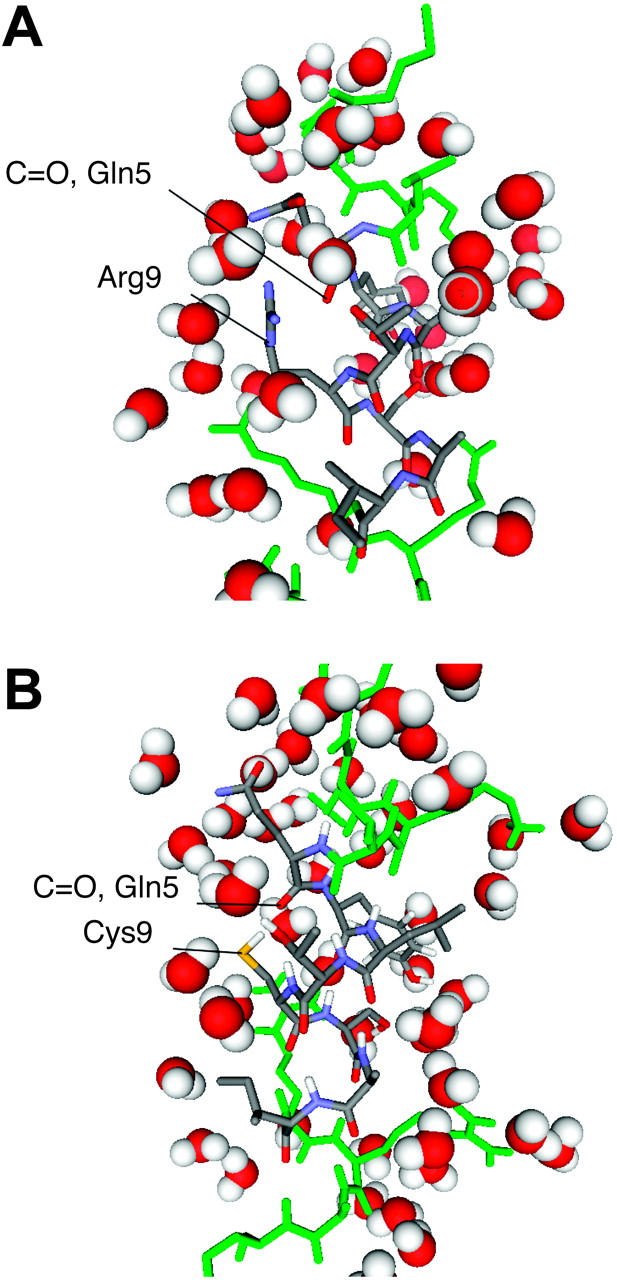
Snapshots of PLB1–25 and R9C-PLB1–25 taken at 100 ps. Atoms of residues 5–9 are colored by CPK; all others are colored green. (A) Shielding of backbone atoms of Gln-5 by the Arg-9 side chain. (B) Solvation of Gln-5 backbone after replacement of Arg-9 with Cys.
The comparison of the accessibility area between R9C and wild-type peptide explains how the R9C mutation decreases the helical propensity. Atomic accessibility areas were calculated for backbone atoms (N-Cα-C-O) and averaged over the first 100 ps of the simulations (Fig. 8). In PLB1–25, the lowest values are observed at Arg-9 and Arg-13, whereas the largest values are observed for the smallest side chains, Ser-10 and Ala-11. The R9C mutant peptide, on the other hand, shows increased accessibility at Cys-9, due to its smaller side chain. In addition, the accessibility of Gln-5 has also increased. Inspection of Fig. 7 shows a weakening of the backbone hydrogen bond between Cys-9 and Gln-5 due to increased water accessibility with water competing with the intrachain hydrogen bonds of the α-helix. An additional increase in accessibility is also seen at Ser-10 and Ala-11. Accessibility of Tyr-6 backbone is smaller than in PLB1–25, due to the proximity of its Cα atom to the sulfur atom of Cys-9. Overall, mutation to a smaller side chain at position 9 affects the accessibility of the backbone atoms at positions 5, 6, 10, and 11. The smaller Cys side chain allows local opening because of increased competition for hydrogen bonding between water and backbone donors. Water accessibility to R9C-PLB could also affect the helical structure of the monomeric protein lying on the membrane surface. NMR-derived proton/deuterium exchange factors in lipid micelles show that Arg-9 is exposed to the bulk water (Zamoon et al., 2003).
FIGURE 8.

Solvent accessibility area for the backbone atoms (N, Cα, C, and O) of PLB1–25 (solid line) and R9C-PLB1–25 (dashed line).
The simulation results of R9C-PLB1–25 suggest that the loss of inhibitory activity observed for the R9C mutant in vitro (Schmitt et al., 2003) is not due to the loss of specific interactions between Arg-9 on PLB and SERCA, but to an overall change in the shape and dynamics of region IA, producing a partially unfolded structure that mimics phosphorylated PLB and thus relieves SERCA inhibition.
CONCLUSIONS
We have used MD simulations to study the effect of phosphorylation and mutation on the helical conformation of the cytoplasmic region of phospholamban. The results satisfactorily reproduce the behavior of the wild-type and phosphorylated peptides previously observed by CD and NMR. The results further show that the degree of unfolding of helix IA from the C terminus depends upon fraying from Pro-21 and subsequent formation of capping motifs. Local unfolded intermediates, from residue 11 to residue 16, are observed when capping interactions are not present. We propose that phosphorylation at Ser-16 by PKA is facilitated by the intrinsic higher flexibility of the peptide in the 11–16 region. The phosphorylated peptide is characterized by a shortened helix, containing a salt-bridge between the phosphorylated Ser-16 and Arg-13. The region from residues 3 to 11 remains in the helical conformation after phosphorylation. Mutation of Arg-9 to cysteine increases the solvent accessibility of backbone atoms in neighboring residues thus weakening the backbone hydrogen bond between position 9 and position 5, because of competition with the surrounding water molecules. The local distortion functions as a nucleation site for the unfolding of the helix. We propose that the loss of inhibitory PLB potency is due to a similar molecular mechanism for both S16 phosphorylation and the R9C mutation: reduced helical stability in domain 1A of PLB produces a more dynamic conformational state, which interacts with SERCA to relieve its inhibition.
References
- Andrew, C. D., J. Warwicker, G. R. Jones, and A. J. Doig. 2002. Effect of phosphorylation on alpha-helix stability as a function of position. Biochemistry. 41:1897–1905. [DOI] [PubMed] [Google Scholar]
- Asahi, M., E. McKenna, K. Kurzydlowski, M. Tada, and D. H. MacLennan. 2000. Physical interactions between phospholamban and sarco(endo)plasmic reticulum Ca2+-ATPases are dissociated by elevated Ca2+, but not by phospholamban phosphorylation, vanadate, or thapsigargin, and are enhanced by ATP. J. Biol. Chem. 275:15034–15038. [DOI] [PubMed] [Google Scholar]
- Aurora, R., and G. D. Rose. 1998. Helix capping. Protein Sci. 7:21–38. [DOI] [PMC free article] [PubMed] [Google Scholar]
- Berendsen, H. J. C., J. P. M. Postma, and W. F. van Gunsteren. 1984. Molecular dynamics with coupling to an external bath. J. Chem. Phys. 81:3684–3690. [Google Scholar]
- Berendsen, H. J. C., J. P. M. Postma, W. F. van Gunsteren, and J. Hermans. 1981. Interaction models for water in relation to protein hydration. In Intermolecular Forces. B. Pullman, editor. Reidel Publishing, Dordrecht, The Netherlands. 331–42.
- Bystroff, C., and S. Garde. 2003. Helix propensities of short peptides: molecular dynamics versus bioinformatics. Proteins. 50:552–562. [DOI] [PubMed] [Google Scholar]
- Chen, Z., D. L. Stokes, W. J. Rice, and L. R. Jones. 2003. Spatial and dynamic interactions between phospholamban and the canine cardiac Ca2+ pump revealed with use of heterobifunctional cross-linking agents. J. Biol. Chem. 278:48348–48356. [DOI] [PubMed] [Google Scholar]
- Daggett, V., and M. Levitt. 1992. Molecular dynamics simulations of helix denaturation. J. Mol. Biol. 223:1121–1138. [DOI] [PubMed] [Google Scholar]
- Garcia, A. E., and K. Y. Sanbonmatsu. 2002. Alpha-helical stabilization by side chain shielding of backbone hydrogen bonds. Proc. Natl. Acad. Sci. USA. 99:2782–2787. [DOI] [PMC free article] [PubMed] [Google Scholar]
- Hutchinson, E. G., and J. M. Thornton. 1994. A revised set of potentials for beta-turn formation in proteins. Protein Sci. 3:2207–2216. [DOI] [PMC free article] [PubMed] [Google Scholar]
- Johnson, L. N., E. D. Lowe, M. E. Noble, and D. J. Owen. 1998. The Eleventh Datta Lecture. The structural basis for substrate recognition and control by protein kinases. FEBS Lett. 430:1–11. [DOI] [PubMed] [Google Scholar]
- Karim, C. B., T. L. Kirby, Z. Zhang, Y. Nesmelov, and D. D. Thomas. 2004. Phospholamban structural dynamics in lipid bilayers probed by a spin label rigidly coupled to the peptide backbone. Proc. Natl. Acad. Sci. USA. 101:14437–14442. [DOI] [PMC free article] [PubMed] [Google Scholar]
- Kirby, T., C. B. Karim, and D. D. Thomas. 2004. Electron paramagnetic resonance reveals a large-scale conformational change in the cytoplasmic domain of phospholamban upon binding to the sarcoplasmic reticulum Ca-ATPase. Biochemistry. 42:5842–5852. [DOI] [PubMed] [Google Scholar]
- Kreegipuu, A., N. Blom, S. Brunak, and J. Jarv. 1998. Statistical analysis of protein kinase specificity determinants. FEBS Lett. 430:45–50. [DOI] [PubMed] [Google Scholar]
- Lamberth, S., H. Schmid, M. Muenchbach, T. Vorherr, J. Krebs, E. Carafoli, and C. Griensinger. 2000. NMR solution structure of phospholamban. Helv. Chim. Acta. 83:2141–2152. [Google Scholar]
- Levy, Y., E. Hanan, B. Solomon, and O. M. Becker. 2001. Helix-coil transition of PrP106–126: molecular dynamic study. Proteins. 45:382–396. [DOI] [PubMed] [Google Scholar]
- Li, J., D. J. Bigelow, and T. C. Squier. 2003. Phosphorylation by cAMP-dependent protein kinase modulates the structural coupling between the transmembrane and the cytosolic domains of phospholamban. Biochemistry. 42:10674–10682. [DOI] [PubMed] [Google Scholar]
- Lindhal, E., B. Hess, and D. van der Spoel. 2001. GROMACS 3.0. A package for molecular simulation and trajectory analysis. J. Mol. Model. 7:306–317. [Google Scholar]
- Lockwood, N. A., R. S. Tu, Z. Zhang, M. V. Tirrell, D. D. Thomas, and C. B. Karim. 2003. Structure and function of integral membrane protein domains resolved by peptide-amphiphiles: application to phospholamban. Biopolymers. 69:283–292. [DOI] [PubMed] [Google Scholar]
- MacLennan, D. H., and E. G. Kranias. 2003. Phospholamban: a crucial regulator of cardiac contractility. Nat. Rev. Mol. Cell Biol. 4:566–577. [DOI] [PubMed] [Google Scholar]
- Mascioni, A., C. B. Karim, J. Zamoon, D. D. Thomas, and G. Veglia. 2002. Solid-state NMR and rigid body molecular dynamics to determine domain orientations of monomeric phospholamban. J. Am. Chem. Soc. 124:9404–9411. [DOI] [PubMed] [Google Scholar]
- Metcalfe, E. E., J. Zamoon, D. D. Thomas, and G. Veglia. 2004. 1H/15N Heteronuclear NMR spectroscopy shows four dynamic domains for phospholamban reconstituted in dodecylphosphocholine micelles. Biophys. J. 87:1205–1214. [DOI] [PMC free article] [PubMed] [Google Scholar]
- Mortishire-Smith, R. J., H. Broughton, V. M. Garsky, E. J. Mayer, and R. G. Johnson, Jr. 1998. Structural studies on phospholamban and implications for regulation of the Ca(2+)-ATPase. Ann. N. Y. Acad. Sci. 853:63–78. [DOI] [PubMed] [Google Scholar]
- Mortishire-Smith, R. J., S. M. Pitzenberger, C. J. Burke, C. R. Middaugh, V. M. Garsky, and R. G. Johnson. 1995. Solution structure of the cytoplasmic domain of phopholamban: phosphorylation leads to a local perturbation in secondary structure. Biochemistry. 34:7603–7613. [DOI] [PubMed] [Google Scholar]
- Pollesello, P., and A. Annila. 2002. Structure of the 1–36 N-terminal fragment of human phospholamban phosphorylated at Ser-16 and Thr-17. Biophys. J. 83:484–490. [DOI] [PMC free article] [PubMed] [Google Scholar]
- Pollesello, P., A. Annila, and M. Ovaska. 1999. Structure of the 1–36 amino-terminal fragment of human phospholamban by nuclear magnetic resonance and modeling of the phospholamban pentamer. Biophys. J. 76:1784–1795. [DOI] [PMC free article] [PubMed] [Google Scholar]
- Schmitt, J. P., M. Kamisago, M. Asahi, G. H. Li, F. Ahmad, U. Mende, E. G. Kranias, D. H. MacLennan, J. G. Seidman, and C. E. Seidman. 2003. Dilated cardiomyopathy and heart failure caused by a mutation in phospholamban. Science. 299:1410–1413. [DOI] [PubMed] [Google Scholar]
- Smart, J. L., and J. A. McCammon. 1999. Phosphorylation stabilizes the N-termini of alpha-helices. Biopolymers. 49:225–233. [DOI] [PubMed] [Google Scholar]
- Snow, C. D., H. Nguyen, V. S. Pande, and M. Gruebele. 2002. Absolute comparison of simulated and experimental protein-folding dynamics. Nature. 420:102–106. [DOI] [PubMed] [Google Scholar]
- Toyofuku, T., K. Kurzydlowski, M. Tada, and D. H. MacLennan. 1994. Amino acids Glu2 to Ile18 in the cytoplasmic domain of phospholamban are essential for functional association with the Ca(2+)-ATPase of sarcoplasmic reticulum. J. Biol. Chem. 269:3088–3094. [PubMed] [Google Scholar]
- Toyoshima, C., M. Asahi, Y. Sugita, R. Khanna, T. Tsuda, and D. H. MacLennan. 2003. Modeling of the inhibitory interaction of phospholamban with the Ca2+ ATPase. Proc. Natl. Acad. Sci. USA. 100:467–472. [DOI] [PMC free article] [PubMed] [Google Scholar]
- van der Spoel, S., P. J. van Maaren, and H. J. C. Berendsen. 1998. A systematic study of water models for molecular simulation. J. Chem. Phys. 108:10220–10230. [Google Scholar]
- van Gunsteren, W. F., S. R. Billeter, A. A. Eising, P. H. Hunemberger, P. Kruger, A. E. Mark, W. R. P. Scott, and I. G. Tironi. 1996. Biomolecular Simulation: The GROMOS96 Manual and User Guide. Hochschulverlag AG an der ETH Zürich, Zürich, Switzerland.
- Vila, J. A., D. R. Ripoll, and H. A. Scheraga. 2000. Physical reasons for the unusual alpha-helix stabilization afforded by charged or neutral polar residues in alanine-rich peptides. Proc. Natl. Acad. Sci. USA. 97:13075–13079. [DOI] [PMC free article] [PubMed] [Google Scholar]
- Zamoon, J., A. Mascioni, D. D. Thomas, and G. Veglia. 2003. NMR solution structure and topological orientation of monomeric phospholamban in dodecylphosphocholine micelles. Biophys. J. 85:2589–2598. [DOI] [PMC free article] [PubMed] [Google Scholar]
- Zamoon, J., F. Nitu, C. Karim, D. D. Thomas, and G. Veglia. 2005. Mapping the interaction surface of an integral membrane protein: unveiling the conformational switch in phospholamban regulation of SERCA. Proc. Natl. Acad. Sci. USA. 102:4747–4752. [DOI] [PMC free article] [PubMed] [Google Scholar]