

Abstract
We have developed a homology model of the GABAA receptor, using the subunit combination of α1β2γ2, the most prevalent type in the mammalian brain. The model is produced in two parts: the membrane-embedded channel domain and the extracellular N-terminal domain. The pentameric transmembrane domain model is built by modeling each subunit by homology with the equivalent subunit of the heteropentameric acetylcholine receptor transmembrane domain. This segment is then joined with the extracellular domain built by homology with the acetylcholine binding protein. The all-atom model forms a wide extracellular vestibule that is connected to an oval chamber near the external surface of the membrane. A narrow, cylindrical transmembrane channel links the outer segment of the pore to a shallow intracellular vestibule. The physiological properties of the model so constructed are examined using electrostatic calculations and Brownian dynamics simulations. A deep energy well of ∼80 kT accommodates three Cl− ions in the narrow transmembrane channel and seven Cl− ions in the external vestibule. Inward permeation takes place when one of the ions queued in the external vestibule enters the narrow segment and ejects the innermost ion. The model, when incorporated into Brownian dynamics, reproduces key experimental features, such as the single-channel current-voltage-concentration profiles. Finally, we simulate the γ2 K289M epilepsy inducing mutation and examine Cl− ion permeation through the mutant receptor.
INTRODUCTION
The anion-selective γ-aminobutyric acid (GABA) receptor is a member of the highly conserved Cys-loop superfamily of ligand-gated ion channels, which includes the cation-selective nicotinic acetylcholine receptor (nAChR) and the anionic glycine and 5-hydroxyltryptamine receptors. All members of the superfamily share the same pentameric quaternary structure (Noda et al., 1983; Schofield et al., 1987; Grenningloh et al., 1987; Langosch et al., 1988; Maricq et al., 1991). Each subunit has an N-terminal half that forms an extracellular domain responsible for ligand binding and a C-terminal half containing four transmembrane regions, M1–M4, that form the ion-selective channel domain (Eisele et al., 1993). The α-helical M2 region lines the pore and forms the selectivity filter (Imoto et al., 1986, 1988; Giraudat et al., 1986; Akabas et al., 1994; Xu and Akabas, 1996). So far, eight major subunit types have been identified across the family of GABAA receptors, some of which can be further divided into classes, based on the degree of sequence homology (Hevers and Lueddens, 1998). The formation of functional GABAA receptors requires the coexpression of a least two subunit types, the α- and β-subunits, with both of these subunits contributing to the GABA binding site (Smith and Olsen, 1995).
The neurotransmitters GABA and glycine are the primary mediators of inhibitory synaptic transmission in the nervous system, through their activation of anion-selective ligand-gated ion channels in the postsynaptic membrane. This generates an outwardly directed current that opposes activation of the postsynaptic neuron. Inhibitory neurotransmission evoked by these two neurotransmitters is essential for reflex responses, voluntary motor control, and the processing of sensory signals in the mammalian nervous system. Disruption of inhibitory pathways, by the convulsive agent strychnine, inherited genetic disorders (Rajendra et al., 1995) or other means, can result in abnormal reflexes, loss of muscle control, epileptic fits, and death. There are many inheritable mutations in the glycine and GABA receptor subunits that are linked to diseases such as hereditary hyperekplexia, an autosomal-dominant neurological disorder characterized by an exaggerated startle reflex (Langosch et al., 1994), and familial epilepsy syndrome caused by mutations in the γ2 subunit of the GABA receptor (Wallace et al., 2001; Baulac et al., 2001).
No high-resolution structure has yet been determined for any of the Cys-loop ligand-gated ion channels. However, recent developments have provided reasonable templates for homology modeling of both the extracellular ligand-binding domain and the transmembrane domain of all members of the superfamily. Brejc et al. (2001) elucidated the crystal structure of an acetylcholine binding protein (AChBP). Although this protein shares only weak sequence homology with the ligand-binding domain of the nAChR, it appears to be a reasonable structural and functional model for the ligand-binding domain of Cys-loop ligand-gated ion channels (Brejc et al., 2001; Grutter and Changeux, 2001; Trudell, 2002; Cromer et al., 2002; Lester et al., 2004), a concept spectacularly confirmed by Bouzat et al. (2004). More recently, an electron microscopy image of the closed-state transmembrane domain of the nAChR has been resolved to 4 Å (Miyazawa et al., 2003), allowing an atomic model to be built for the first time. Making use of this newly unveiled structural information, together with the known general topology of the nAChR (Unwin, 1993; Lester, 1992), we have constructed a homology model of the GABAA receptor transmembrane domain and combined this with our earlier model of the ligand-binding domain (Cromer et al., 2002) to produce a homology model of the GABAA receptor. This model, consisting of two α1, two β2, and one γ2 subunit, maps the majority of the native receptor, with the exception of the intracellular vestibule. Our initial model is then molded in a series of molecular dynamics simulations to produce a set of conducting channel candidates.
Electrostatic calculations and Brownian dynamics simulations are carried out to determine which of the models best replicates the physiological properties of the native receptors. Firstly, we construct the potential energy profiles experienced by an ion as it traverses the channel under various conditions. These profiles reveal equilibrium positions, the effects of charges on ionizable residues required for the channel to conduct, and the rate-limiting steps for ion passing through the channel. To further quantify the properties of the open-state model channel, we perform Brownian dynamics simulations, employing various findings from atomic-detail molecular dynamics calculations. By carrying out these simulations, we observe the effects of the radius of the selectivity filter and charge distributions on channel conductance. This information is used to select the model that can most closely replicate the current-voltage-concentration profiles observed experimentally. Finally, we carry out a theoretical site-directed mutagenesis simulation and observe the effects of the mutations on the conductance properties, which can be tested experimentally.
METHODS
Constructing the homology model
A homology model of the extracellular domain of the GABAA receptor is constructed, based on the crystal structure of snail acetylcholine binding protein (Protein Data Bank (PDB) entry 1I9B; Brejc et al., 2001). A detailed method is outlined in Cromer et al. (2002). In brief, the ligand-binding domain of GABAA receptor subunits are aligned with acetylcholine binding protein (AChBP) using ClustalW (Thompson et al., 1994). As they share only ∼18% identity, the reliability of the alignment is enhanced by creating a multiple alignment with several other Cys-loop ligand-gated ion channels, taking the secondary structure predictions into account. After the alignment, each subunit is modeled independently using SwissModel (Guex and Peitsch, 1997). Loop regions that correspond to gaps in the alignment are modeled by fitting structures from a loop database.
The independently produced monomer models are assembled into the characteristic pentamer, using the AChBP structure as a scaffold. The subunits are arranged in the pentamer in an order that fits with the known biochemical data. For example, residues implicated in GABA-binding map to opposite faces of α1 and β2 subunit models. Bringing these faces together defines a GABA-binding dimer. As the kinetic data indicate that there are two GABA-binding sites, two of these dimers are incorporated into the pentamer, with the fifth position filled by the γ2 subunit. The position of the γ2 subunit brings together residues from the α1 and γ2 subunit that are implicated in benzodiazepine binding (Sigel and Buhr, 1997), lending support to the modeled subunit arrangement. The assembled pentamer is energy minimized using INSIGHT DISCOVER (Accelrys, San Diego, CA) to eliminate any obvious problems such as steric clashes. In the resulting pentamer, 95% of residues have a backbone geometry falling in favorable regions of the Ramachandran plot. Superimposing the ligand-binding domain of the homology model onto the acetylcholine binding protein gives an average root-mean-square deviation of 1.2 Å for α-carbons. When the consensus sites for N-glycosylation are mapped onto the pentameric model, they are all found to be appropriately located on the solvent accessible surface. The available evidence (Unwin et al., 2002; Celie et al., 2004) indicates that the conformation of the extracellular domain model best represents the agonist-bound state.
SwissModel (Guex and Peitsch, 1997) is used to build the homology models. The channel domain of each subunit is built by homology with the “equivalent” subunit of the heteropentameric nAChR using the most recently resolved structure (PDB entry 1OED). Subunit equivalence is based on having homologous residues involved in ligand binding. Thus GABAA β2 corresponds to nAChR α, GABAA α1 to both nAChR γ and δ, and GABAA γ2 to nAChR β. Reassuringly, this equivalence gives the same subunit arrangement as the extracellular domain model. Unfortunately the 1OED structural data are only resolved to 4 Å, a relatively low resolution. As a consequence of this, the coordinates are considered to be preliminary data and not highly reliable. The sequence homology between GABAA receptor and nAChR subunits in the channel domain is high enough to make alignment straightforward for M1–M3, although a mismatch (by one residue) in the number of residues in loops M1–M2 and M2–M3 means that portions of these loops must be fitted from a loop database. The alignment in M4 is less reliable, but this region is also less important for channel function.
The resulting pentameric models of the GABAA receptor transmembrane domain and the extracellular ligand-binding domain are spatially aligned in three dimensions, so that they share the same axis of symmetry. The coordinates of each domain are matched so that the last residue of each subunit in the extracellular domain overlaps its identical residue (first residue) of each subunit in the channel domain as much as possible. The deviation for each of these residues is <2 Å, supporting our spatial alignment of the two domains. The last residue of each subunit in the extracellular domain is deleted and the new C-terminus is ligated to the N-terminus of the channel domain. The resulting overall model is then energy minimized, bringing the region around each ligation to a reasonable geometry and resolving any clashes at the interface between the extracellular and channel domains. Although structurally reasonable, the packing of loops at this interface can be considered uncertain at best. The final model is made up of two α1 subunits (chains A and D), two β2 subunits (chains C and E), and one γ2 subunit (chain B). The model does not include the large intracellular loop between M3 and M4, so does not include any predictions about the nature of a potentially larger intracellular vestibule.
The minimum diameter of the transmembrane channel in the model is just under 4 Å (Fig. 2 A, solid line). This is consistent with the model being based on the nAChR closed state, whereas the open-channel diameter inferred from permeation experiments is between 5 and 6 Å (Bormann et al., 1987). To open the channel, we gently enlarge the pore, using the CHARMM (Brooks et al., 1983) molecular dynamics program (version c28b1), utilizing version 19 extended-atom parameters for protein. During the expansion, all atoms of the transmembrane helices are lightly restrained with harmonic forces of 5 kcal/mol/Å2 (≈8 kT/Å2), whereas all atoms outside the membrane region are fixed. A cylindrical CHARMM MMFP force field (axis aligned with the pore) is applied to all nonfixed atoms, such that atoms inside the MMFP cylinder are pushed radially outwards with a force of 50 kcal/mol/Å2 (≈80 kT/Å2), calculated relative to the cylinder surface. Atoms are moved through a process of 200 steps of steepest-descent energy minimization and the radius of the MMFP cylinder is set to 6 Å, determined empirically. After expansion the minimum pore diameter is ∼5.5 Å (Fig. 2 A, dotted line), within the experimentally determined range. The resulting overall model represents an agonist-bound open-channel conformation.
FIGURE 2.

To determine the open state of the homology model, the experimental minimum pore diameter was restored by gently expanding the pore. (A) The pore radius of the closed-state homology model (dotted line) is compared to the pore radius of the expanded channel (solid line). (B) A cross-sectional view of the pre- (blue line ribbon) and postexpansion (gray solid ribbon) channel models and 2′ residues (stick models) taken from the intracellular aspect. The total root-mean-squared deviation in the transmembrane region of the pore is 0.1 Å. (C) A side view of the transmembrane region of two subunits (one α1 and one β2) of the superimposed structures. The preexpansion structure is shaded blue and the postexpansion structure is gray. Residues from the M2 domain and M2–M3 linker region are shown as stick models. In this and all subsequent figures of the receptor model, the extracellular boundary is on the right and the cytoplasmic boundary is on the left.
A comparison of the pre- and postexpansion homology models shows a backbone root-mean-squared deviation of 0.09 Å for the entire receptor (see Supplementary Material). Comparison of the transmembrane (M1–M4) domain alone gives a backbone root-mean-squared deviation of 0.10 Å, indicating that no significant structural changes are incurred through this expansion. The largest root-mean-squared deviation for the motion of the individual side-chain atoms is 0.922 Å for the Val-257 (Val-2′) carbon G1 in the α1 subunits. To illustrate this more effectively, we superimpose the pre- (blue line ribbon) and postexpansion (gray solid ribbon) structures and show the cross-sectional view of the channel, taken from the intracellular perspective in Fig. 2 B. The side chains of the five 2′ residues from the M2 domain of each structure are illustrated as stick models. It is clear from Fig. 2 B that this motion of 0.922 Å in the Val-2′ side chain constitutes a minor rearrangement of the side-chain position, rather than a significant structural change. To illustrate this more effectively, Fig. 2 C shows the side profile of the postexpansion structural model (gray) of two nonadjacent subunits: α1 and β2, with the preexpansion model (blue) for each subunit superimposed. In each case, the side chains of all residues in the M2 domain and M2–M3 linker region (from 0′ to 27′) are shown as stick models. As expected, Fig. 2 C shows no visible deviation in the backbone structure, indicating the expansion does not induce any significant structural changes in the model GABAA receptor. Thus the widening of the pore does not constitute a significant structural change in the homology model, but represents a cumulative effect from the slight rearrangement of each amino acid side chain, the largest rearrangement of which is for Val 2′ in the α1 subunits.
Solution of Poisson's equation
We solve Poisson's equation using a finite difference method (Moy et al., 2000) to calculate the electric forces acting on ions in or around the channel. The channel and aqueous solution are represented as continuous dielectric regions with dielectric constants ɛp = 2 for the protein, ɛw = 80 for the bulk water outside of the channel, and ɛc = 60 for the interior of the pore. The justifications for using these ɛ-values are given in Chung et al. (2002) and Corry et al. (2004).
To calculate the potential energy profile encountered by a single ion as it traverses the pore, we move an ion along the center of the pore in 1-Å steps and use the solution of Poisson's equation to determine the potential energy at each position. To visualize the shape of the energy profile a Cl− ion encounters as it attempts to enter a pore that is already occupied by multiple resident ions, we construct multiion energy profiles. We move one of the ions from the extracellular space into the channel in 1-Å steps, holding it fixed at each step, while allowing the resident ions, which are initially placed at the binding sites, to adjust their positions so that the force on them will be zero, thus minimizing the total energy of the system. As we bring an additional ion into the channel, the minimization is performed at each step and the positions of the resident ions and the total energy are recorded. This energy corresponds to the total electrostatic energy required to bring in the charge on the ions from an infinite distance in infinitesimal amounts. Energy minimizations are carried out using a modified version of the steepest descent algorithm (Press et al., 1989; Chung et al., 1999).
Brownian dynamics simulations
The energy profiles provide only a qualitative picture of the permeation dynamics, because the random motion of ions and Coulomb interactions between the ions in the assembly are not taken into account. To deduce the conductance of ions through the channel, we carry out three-dimensional Brownian dynamics simulations. In these simulations, we place between 38 and 50 pairs of Na+ and Cl− ions in cylindrical reservoirs of radius 35 Å at each end of the channel to mimic the extracellular or intracellular space. We fix the concentration of the solutions in the reservoirs by adjusting the height of the cylinder. We then trace the motion of these ions under the influence of electric and random forces using the Langevin equation:
 |
(1) |
where mi, qi, and vi are the mass, charge, and velocity of the ith ion. In the simulations, the water molecules are not treated explicitly. Instead, the effects of the water molecules are represented in Eq. 1 by the stochastic force, FR and the average frictional force, with frictional coefficient miγi. The stochastic force arises from collisions between the water molecules and ions, whereas the frictional force comes from the retardation of the ion's motion due to the viscosity of the water. Because they arise from the same source, the two forces are not independent but related through the fluctuation-dissipation theorem (Reif, 1965; Zwanzig, 2001). Thus, the knowledge of the friction coefficient (or the diffusion coefficient D, because D = kT/mγ from the Einstein relation) is sufficient to determine these two forces. The random force is sampled from a Gaussian probability distribution with a zero mean, and it is assumed to be Markovian. The last two terms in Eq. 1 are the electric field and short-range forces acting on the ion, respectively. We calculate the total force acting on each and every ion in the assembly and then calculate new positions for the ions a short time later. A multiple time-step algorithm is used, where a time step of Δt = 100 fs is employed in the reservoirs and 2 fs in the channel where the forces change more rapidly.
Poisson's equation is solved to give the electric field at the position of the ion. Calculating the electric forces at every step in the simulation is very time consuming, so we store precalculated electric fields and potentials in a system of lookup tables (Hoyles et al., 1998). To do this the electric potential is broken into four components:
 |
(2) |
where the sum over j runs over all the other ions in the system. The symbols in Eq. 2 assume the following significance: φX,i is the external potential due to the applied field, fixed charges in the protein wall, and charges induced by these; φS,i is the self-potential due to the surface charges induced by the ion i on the channel boundary; φI,ij is the image potential felt by ion i due to the charges induced by ion j; and φC,ij is the direct interaction between ions i and j. The first three potential terms in Eq. 2 are calculated using a finite difference solution of Poisson's equation as described above. The first term is stored in a three-dimensional table to save time and storage space, whereas the second and third term are stored in two- and five-dimensional tables. The ion-ion interactions include the Coulomb term and an oscillating short-range potential derived from molecular dynamics simulations as described previously (Corry et al., 2001), and are calculated on the fly during the simulation. The short-range forces include these short-range ion-ion interactions as well as those between ions and the channel walls.
The Langevin equation is solved with the algorithm of van Gunsteren and Berendsen (1982), using the techniques described by Li et al. (1998). Bulk ionic diffusion coefficients of 1.33 × 10⁻⁹ m2s−1 for Na+ and 2.03 × 10⁻⁹ m2s−1 for Cl− ions are employed in the reservoirs and vestibules. These values are reduced to 50% of the bulk values in the pore, as determined by molecular dynamics studies (Allen et al., 2000). Simulations under various conditions, each lasting usually 5–10 μs, are performed with symmetric ionic concentrations in the two reservoirs. The current is computed from the number of ions that pass through an imaginary plane near the end of the channel during a simulation period. For further technical details of the Brownian dynamics simulation method, see Chung et al. (1998, 1999, 2002).
RESULTS
Channel topology, pore lining, and ionizable residues
We constructed the extracellular domain model based on weak homology to AChBP (Brejc et al., 2001). Despite the weak sequence homology, AChBP is a good structural and functional model for the extracellular domain of Cys-loop ligand-gated ion channels (Bouzat et al., 2004) and our model fits well with experimental data (Cromer et al., 2002). The transmembrane domain model is based on homology to the nAChR transmembrane channel structure (Miyazawa et al., 2003). Examination of the structure shows the orientation of the transmembrane helices to the membrane and each other is clearly discernible, supporting the tertiary geometry of our transmembrane domain model. Although the sequence homology between the GABA and nACh receptor transmembrane domains is good, the limited resolution (4 Å) of the nAChR data means the accuracy of the template model is questionable, certainly in terms of side-chain position (Miyazawa et al., 2003) and possibly in terms of fitting of the protein sequence to the electron density map.
The pentameric extracellular domain and channel domain models are joined by overlapping one residue in each subunit that is common to both models. Reassuringly the spacing of these residues is approximately equal in the two domains. Because no information about the conformation of the extracellular domain loops that interface with the channel domain is available, we have not attempted to place any constraints on them in the modeling process other than simple energy minimization to prevent steric clashes. Consequently the interface region including the extracellular domain loops and the M2–M3 loop from the channel domain is the least certain part of the model.
The combined GABA receptor model spans 120 Å along its axis of symmetry (z axis), extending from −60 to 60 Å. At this offset, the point z = 0 is slightly external to the outer surface of the membrane. In Fig. 1 A, we illustrate the central pore formed by the surrounding protein model. To reveal the pore, we removed two subunits, one α and one β, leaving only three subunits. The atoms from the remaining β-, γ-, and α-subunits are shown in purple, cyan and lilac, respectively. The dielectric interface between protein and water is determined by assigning the protein atoms their Born radius (Nina et al., 1997) and tracing the channel pore with a water molecule sphere of radius 1.4 Å. The profile obtained forms the minimum boundary radius at each axial position. It is rotated around the channel axis by 360° to generate a three-dimensional pore, 120 Å in length. This axially symmetrical pore shape is superimposed on the protein structure in Fig. 1 A. The GABAA receptor transmembrane domain extends from z = −60 to z = −10 Å and forms the narrow transmembrane channel, which acts as the selectivity filter of the pore. It is connected to a small oval chamber, located just exterior to the surface of the membrane, which in turn opens into the funnel-shaped extracellular vestibule that spans the region between z = 10 Å and z = 60 Å.
FIGURE 1.

The homology model of GABAA receptor and the outline of the channel pore. (A) Two subunits of the homology model of GABAA receptor, one α1 and one β2 subunit, are removed to show the location of the pore. The semitransparent pore outline is superimposed on the three remaining α1 (bottom), γ2 (middle), and β2 (top) subunits, shown in lilac, blue, and purple, respectively. The location of the cell membrane is shown in beige. (B) The pore-lining acidic and basic residues from these three subunits are shown as solid atoms whereas two of the subunits (one α1 and one β2) are represented in ribbon form. Acidic residues are shaded green and basic residues are shaded purple. The pore itself is divided into three sections: the transmembrane channel, which extends from −60 to −10 Å; the oval chamber, located just exterior to the surface of the membrane and extends from −10 to 10 Å; and the extracellular vestibule that extends from 10 to 60 Å.
As illustrated in Fig. 1 B, the majority of the pore-lining ionizable residues are located in the ligand-binding domain, which forms the extracellular vestibule and oval chamber. Interspersed between the basic arginine and lysine residues (shown in purple) are several groups of acidic glutamate and aspartate residues (shown in green). Of all the 90 ionizable residues located along the ion-conducting pathway, 52 residues are lysines and arginines and 38 residues are aspartate and glutamates. The protein as a whole has 22 net positive charges. The list of the acidic and basic residues that are lining the pore, together with their approximate z-coordinates, is given in Table 1. We use the CHARMM19 extended atom residue topology file (Neria et al., 1996) to allocate charges to each residue, assigning a charge of +e to all basic residues and −e to all acidic residues (where e = 1.602 × 10⁻²¹ Coulombs).
TABLE 1.
The location of the pore-lining ionizable residues from each subunit in the homology model GABAA receptor
| z-coordinate | α1 subunits | β2 subunits | γ2 subunit |
|---|---|---|---|
| −45 Å | R255 | R250 | R265 |
| – | E250 | D245 | D260 |
| −17 Å | R274 | R269 | R284 |
| −15 Å | – | E270 | K285 |
| −8 Å | K279 | K274 | K289 |
| −1 Å | D57 | E52 | – |
| 6 Å | E59 | D56 | E71 |
| 7 Å | R136 | – | K117 |
| 18 Å | K106 | K103 | K118 |
| 28 Å | K117 | R114 | R129 |
| 35 Å | – | D89 | – |
| 40 Å | R29 | R26 | K41 |
| – | K93 | R71 | K105 |
| 41 Å | D27 | D24 | – |
| 45 Å | – | – | D39 |
| 50 Å | K78 | – | – |
| – | R21 | R21 | – |
| – | R17 | R18 | – |
| – | – | K13 | – |
| 50 Å | D20 | E14 | E36 |
| – | D24 | D17 | – |
Next we examine how well the details of the transmembrane channel model conform to the existing experimental data. A solvent accessible surface is generated for the homology model using a water sphere of radius 1.4 Å and the pore-lining residues in the model transmembrane domain are compared to those identified by substituted cysteine accessibility method (SCAM) experiments on the α1 subunit (Xu and Akabas, 1996). To aid in the comparison of M2 residues in each subunit, we use the conventional M2 indexing system whereby the 0′ position refers to the conserved basic residue at the start of M2: α1 Arg-255, β2 Arg-250, and γ2 Arg-265 (see Table 2). We find that the solvent-accessible residues of the homology model GABAA receptor M2 domain correspond to those identified by the SCAM investigations of Xu and Akabas (1996), with the exception of Thr-7′, which is buried in our model but partly accessible by SCAM (Xu and Akabas, 1996). However, the very slow reaction rate at the 7′ position (Goren et al., 2004) supports this residue being largely buried. Other residues at 8′, 14′, and 15′ positions that face away from the channel in our model have been found to be accessible by SCAM (Goren et al., 2004). This is most likely due to the presence of a separate water-filled cavity behind the M2 helix, implicated as the anesthetic binding site (Lobo et al., 2004).
TABLE 2.
Comparative sequence alignment of the M2 domain and M2–M3 linker region of each subunit
| 0′ | 10′ | ||||||||||||||||
|---|---|---|---|---|---|---|---|---|---|---|---|---|---|---|---|---|---|
| α1 | 251 | S | V | P | A | R | T | V | F | G | V | T | T | V | L | T | M |
| β2 | 246 | A | S | A | A | R | V | A | L | G | I | T | T | V | L | T | M |
| γ2 | 261 | A | V | P | A | R | T | S | L | G | I | T | T | V | L | T | M |
| 13′ | 19′ | ||||||||||||||||
| α1 | 267 | T | T | L | S | I | S | A | R | N | S | L | P | K | V | A | Y |
| β2 | 262 | T | T | I | N | T | H | L | R | G | T | L | P | K | I | P | Y |
| γ2 | 277 | T | T | L | S | T | I | A | R | K | S | L | P | K | V | S | Y |
The top row of numbers gives the universal indexing system, whereas the number on the left of each row is the subunit-specific number of the first residue of each aligned sequence. The pore-lining residues of the homology model are underlined, whereas the experimentally determined pore-lining residues identified by Xu and Akabas (1996) and Bera et al. (2002) are in bold text.
Conventionally the M2 helix is believed to be bounded at each end by two of the three characteristic rings of charged residues, the Asp-5′ ring at z = −45 Å and the Arg-19′ ring at z = −17 Å, shown in Fig. 3, A and B. Bera et al. (2002) used SCAM to deduce that the M2 α-helix extends approximately two helical turns beyond the 20′ position, with residues Asn-20′, Ser-21′, Lys-24′, and Tyr-27′ contributing to the pore lining in the α1 subunit. Our model is consistent with these findings: although the M2 helix kinks outwards around the 22′ position, the helix extends to the 28′ position and the residues identified by Bera et al. (2002) form the solvent accessible surface lining the pore of the α1 and γ2 subunits. In the β2 subunit, the equivalent residues all contribute to the pore lining, with the exception of the conserved Tyr-27′, the side chain of which faces away from the pore and is not accessible to solvation.
FIGURE 3.

Location of the polar residues lining the GABAA transmembrane channel. (A) The location of the narrow, transmembrane region of the channel is circled. (B) An expanded view of the transmembrane channel shows the pore-lining acidic and basic residues shown in green and purple, respectively. The polar residues from the M2 domain are shown as the cyan ball-and-stick residues. These are flanked by rings of acidic and basic residues, which traditionally mark each end of the M2 helix.
We find that ions are unable to permeate across the narrowest region of the channel in our model, consistent with this region being modeled on the structure of the closed nAChR, whereas the extracellular domain best represents the agonist-bound conformation (Unwin et al., 2002; Celie et al., 2004). The conformational change in the transmembrane domain that opens the channel is thought to involve a small rotation of M2 helix (Unwin, 1995), but as this is based on 9-Å resolution data, with only one bent transmembrane helix resolved, the exact detail of this rotation is far from clear. SCAM data indicate that there is little change in the helical face that is accessible with channel opening (Akabas et al., 1994; Xu and Akabas, 1996; Pascual and Karlin, 1998), suggesting that any rotation is quite small. Rather than making a guess at the magnitude and direction of such a rotation, we create an open-state conformation of the channel by simply increasing the diameter of the transmembrane segment of the pore slightly, thus maintaining the channel lining in a manner that is consistent with the experimental data.
Energy profiles
When the charges on the ionizable and polar residues lining the pore are neutralized, an anion or cation navigating across the pore encounters an energy barrier of 15 kT, effectively barring its passage through the channel. This energy barrier, shown in Fig. 4 A (dashed line), is transformed into an energy well 67 kT in depth (solid line) when the CHARMM19 extended atom charges are placed on all acidic, basic, and polar residues. The nadir of the energy well is located at −12 Å, centered in the transmembrane segment of the channel. The energy profile of the fully charged GABAA channel shows an energy barrier in the oval cavity, in the region flanked by a ring of glutamate and aspartate residues. These residues—one glutamate residue from each of the two α1 subunits (Glu-59) and the single γ2 subunit (Glu-71) and one aspartate residue from each of the β2 subunits (Asp-56)—are part of the loop between β-strands 1 and 2 of the extracellular domain of each subunit. When these residues are close to the pore, anions permeate deeply into the channel from both reservoirs, but cannot cross the central energy barrier created by the proximity of these residues to the pore. Thus, no Cl− ions can permeate through the region between z = 4.5 Å and z = 11 Å, the part of the pore flanked by the N-terminal loop regions.
FIGURE 4.

Energy profiles across the GABAA receptor. The upper inset gives the location of the pore-lining ionizable residues. Acidic residues are shaded green and basic residues are shaded purple. The asterisks give the location of three of the five acidic residues carrying a reduced charge of −0.6 e. (A) The dashed line shows the potential energy profile for a Cl− ion moving across the pore when the charges on the ionizable residues are neutralized. The ion encounters a barrier whose height is 15 kT. With the ionizable residue fully charged, an ion encounters an energy well of 67 kT deep (solid line). The energy barrier on the extracellular side of the nadir results from a ring of five negatively charged residues in the N-terminal loop region. (B) Decreasing the charge from −e to −0.6 e on all five of the residues indicated by the asterisks further increases the depth of the energy well and alleviates the energy barrier in the region between z = 0 and 20 Å (solid line). The solid curve in panel A is reproduced as a dotted line for comparison.
The profiles demonstrate that, for the GABAA channel to conduct ions, these acidic residues must be further away from the pore or be partially neutralized due to altered pKa, thus reducing the effective electrostatic barrier. As these residues are in part of the most uncertain region of our model, we cannot be confident about their precise position or protonation state. Consequently, we took a minimal disruption approach and reduced the electrostatic barrier by reducing the charge on each of the five acidic residues systematically, until ions could permeate through this section of the pore. Normal permeation was restored when each residue carried a charge of −0.6 e. Fig. 4 B shows the energy profile encountered by a Cl− when each of the five residues carries a charge of −0.6 e (solid line), in comparison to the profile obtained when each of the five acidic residues carries a full electron charge (dotted line). When these residues carry partial charges of −0.6 e, rather than the full electronic charge, the depth of the energy well is increased by further 15 kT, alleviating the energy barrier.
Ions in the channel
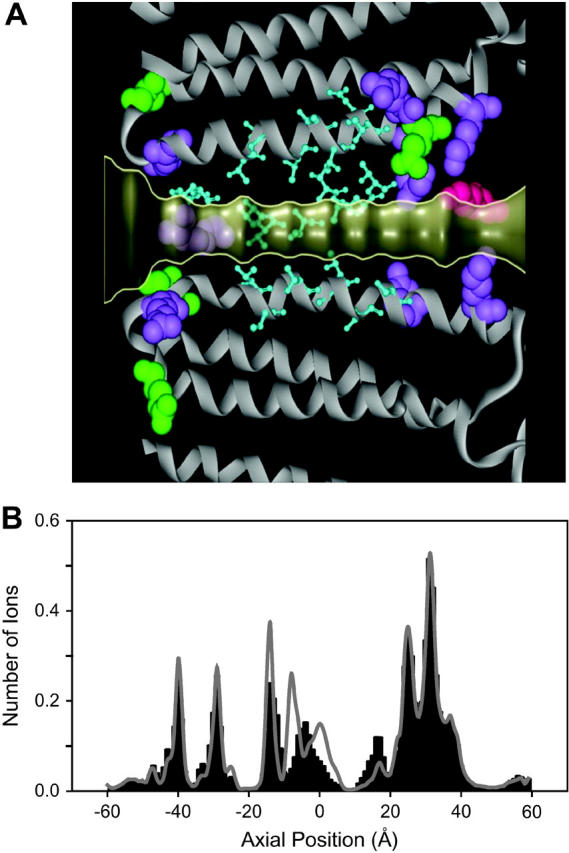
Fig. 5 A shows that the energy profile across the channel contains a broad energy well, 82 kT deep, attracting many Cl− ions into the channel. By constructing multiion energy profiles, it is possible to deduce how many ions dwell in this deep energy well created by the charged and polar residues. We place seven Cl− ions at 10-Å intervals in the oval chamber and extracellular vestibule of the pore, between z = −10 and +60 Å. In this configuration, the ions exist in a stable equilibrium. The charges carried by the resident ions nearly eliminate the energy well in the vestibule. If more than seven ions are placed in this region of the pore flanked by the ligand-binding domain and its N-terminal loops, then the stable equilibrium is disrupted and the additional ion moves into the narrow transmembrane channel. To determine the energy profile of a Cl− ion entering the empty transmembrane channel region, we place these seven Cl− ions at their binding sites in the extracellular vestibule and move an incoming Cl− ion across the transmembrane region of the pore in 1-Å steps, entering from the intracellular reservoir. The resultant energy profile across the selectivity filter, given by the dashed line in Fig. 5 (A), shows the incoming Cl− ion experiences an energy well 35-kT deep. This deep energy well is created by the surplus of polar residues lining the selectivity filter, as illustrated by the cyan ball-and-stick residues in Fig. 3 B. The energy well is centered at z = −28 Å, at the binding site created by the hydroxyl groups of two of the rings of pore-lining threonine residues (Thr-10′ and Thr-13′) from the M2 helix. The energy well across the transmembrane domain is deep enough to hold three ions in a stable configuration, in addition to the seven ions in the extracellular regions of the channel.
FIGURE 5.

Multiion energy profile and the dwell histogram. (A) The energy well seen by a single ion (solid line) is largely reduced when seven Cl− ions are placed in the extracellular vestibule and oval chamber. A single Cl− ion entering the selectivity filter of the channel, with seven ions already in the extracellular vestibule, experiences an energy well 35-kT deep (dashed line). (B) To determine the regions where the resident ions reside preferentially, the channel is divided into thin sections and the average number of ions in each section during a Brownian dynamics simulation period of 0.5 μs is counted. The resulting dwell histogram shows many prominent peaks and troughs, representing binding sites in the channel. The histogram show that the channel contains an average of 10.5 Cl− ions, where 3.4 of these are located in the selectivity filter. For reference, the ring of gating Leu-9′ residues is located at approximately z = −33 Å.
The potential energy profiles give a qualitative picture of ion permeation across the GABAA receptor, but a more rigorous study of the mechanism of ion permeation requires the use of Brownian dynamics simulations. To confirm the number of ions the pore can accommodate, we divide the channel up into 120 sections, 1 Å in thickness, and record the average number of ions in each section during a 0.5 μs simulation period in the presence of a −60 mV applied potential. Fig. 5 B illustrates the resulting mean dwell histogram for Cl− ions. Integrating across the mean dwell histogram gives an average of 10.6 Cl− ions in the channel at any time, with 3.4 Cl− ions in the transmembrane channel, confirming our electrostatic calculations of a 10-ion stable configuration. This configuration is disrupted when an eleventh ion enters the channel from the cytoplasmic vestibule. With the energy well across the channel almost completely screened by the charges carried by the 10 resident ions, the Coulomb repulsion arising from the incoming ion causes a knock-on effect. This initiates ion conduction, resulting in the outermost ion being expelled from the pore, thus restoring the stable 10-ion equilibrium. This process has been noticed in previous Brownian dynamics simulations using all-atom and electrostatic models of other channels (Corry et al., 2004; O'Mara et al., 2003).
The distinct peaks in Fig. 5 B show the binding sites for Cl− ions inside the GABAA receptor pore. The residues forming the binding sites at each axial position are easily identifiable: the peaks at z = −40, −17, and −8 Å correspond to the binding sites formed by the rings of charged arginine residues at the 0′, 19′, and 24′ positions of the M2 domain and M2–M3 linker region, respectively, whereas the ionic binding site at z = −30 Å is stabilized by two rings of pore-lining threonine residues from the M2 helix, T10′ and T13′. In the extracellular vestibule, ion binding sites are formed predominantly by the rings of positively charged residues at z = 18, 28, 35, and 40 Å, but the exact location of the ionic binding sites are perturbed slightly by the nonuniform pore shape in the extracellular vestibule. The small, broad peak at z = 0 Å arises from a number of polar residues that line the oval chamber, creating a hospitable environment for anions.
Despite the wide extracellular and cytoplasmic vestibules that provide sufficient room for a cation to move around resident Cl− ions, and the Coulomb attraction they would experience from the large number of resident ions, very few cations enter the pore. On average, there are only 0.3 Na+ ions in the channel at any point in time. Brownian dynamics simulations also show that these Na+ ions are only present in the outer region of the extracellular vestibule. They cannot permeate deeper than 30 Å into the vestibule, even in the presence of a −60 mV driving force. By constructing a potential energy profile for an incoming Na+ ion with 10 Cl− ions residing in the channel, we find that an incoming Na+ ion experiences a very slight electrostatic repulsion of ∼2 kT at the entrance to the extracellular vestibule. As the Na+ ion moves deeper into the channel, the electrostatic repulsion from the positively charged residues in the protein dominate over the Coulomb attraction of the Cl− ions, preventing the Na+ ion permeating through the GABAA receptor channel. These results concur with previous investigations of an electrostatic model of the wild-type α1 glycine receptor, where extended Brownian dynamics simulations using asymmetric concentrations of NaCl did not reveal any permeation of cations, despite the recovery of the experimental reversal potential (O'Mara et al., 2003).
Isolating the conduction mechanism
During a Brownian dynamics simulation, the axial position of every ion in the channel is recorded. By examining these positions at discrete time intervals, we can build up a series of snapshots illustrating the movement of ions through the channel. The configuration of ions in the channel throughout a Brownian dynamics simulation and the frequency of each configuration is used to construct a probability distribution for each ion configuration. This distribution fits the Boltzmann probability distribution, which gives the relationship between the probability of ions occurring in a particular configuration and the free energy of the configuration. This means that stable ionic configurations occur when the ions are at their lowest energy states: when the ions in the channel reside in the localized potential energy wells that form the ion binding sites. The distribution of ions in the channel is reflected by the prominent peaks and troughs in the mean dwell histogram, illustrated in Fig. 5 B. As ions traverse the channel, they tend to move from one localized energy minima to the next, forming relatively discrete ion configurations inside the channel. To construct a dynamic picture of the conductance mechanism, we determine the most probable ion configurations and identify the energy states for each configuration. We extend this picture by analyzing the transitions between each configuration to determine the most energetically favorable transitions. During a conduction event, ions move through a particular pattern of configuration states, allowing us to determine the mechanism of ion conduction.
To provide a more tangible interpretation of our results, we consider the ion configuration in each section of the channel: the transmembrane channel, which extends from z = −60 to −10 Å; the oval chamber; and the extracellular vestibule, extending from z = 10 Å to z = 60 Å. At both positive and negative voltages, the most stable configuration of ions occurs when the resident ions have a [3, 2, 5] distribution inside the channel, with three ions in the innermost transmembrane section, two ions in the central section, and five ions in the outer section, as illustrated in Fig. 6. With an applied potential of 60 mV, ions spend ∼55% of their time in this configuration. In this scenario, the most probable route by which conduction will occur is for an eleventh Cl− ion to enter the channel from the extracellular vestibule, giving a [3, 2, 6] configuration state, in which the ions spend ∼12% of their time.
FIGURE 6.

The conduction mechanism in the GABAA receptor is isolated by examining the axial position of every ion in the channel at discrete time intervals to build up a probability distribution for the stable ion configurations inside the channel. To simplify our calculations, we divide the channel into three regions. The boundary of each section is marked by the dashed lines. For the most commonly occurring ion configuration of the conducting channel, the pore contains 10 resident Cl− ions, dwelling in a [3, 2, 5] configuration, where three ions occupy the transmembrane channel, two ions occupy the oval chamber, and five dwell in the extracellular vestibule. At an applied potential of +60 mV, the resident ions reside in this configuration 55% of the time, until an additional ion enters the channel and triggers a conduction event.
Once an eleventh ion with sufficient kinetic energy has entered the channel, the Coulomb repulsion between the incoming ion and outermost resident ion increases the force on the outermost resident ion, pushing it out of its binding site and deeper into the channel. The Coulomb repulsion between the six resident ions in the extracellular vestibule eventually forces one of these ions into the oval chamber, initiating a domino or knock-on effect, where the innermost ion in the oval chamber moves almost instantaneously into the transmembrane channel, giving a [4, 2, 5] configuration. The probability of finding 11 resident ions in the [4, 2, 5] configuration is quite high, again ∼12% of the time. Once the [4, 2, 5] configuration has been achieved, the innermost resident ion can gather sufficient kinetic energy from the electrostatic repulsion of the other resident ions to leave its binding site and move out of the channel, restoring the ion configuration to the [3, 2, 5] lowest energy configuration.
When the applied potential is reversed to −60 mV, the most probable, and energetically favorable state is again the [3, 2, 5] configuration, with the ions residing in this configuration for 50% of the time. As an eleventh ion enters the channel from the cytoplasmic reservoir, the resident ions move into a [4, 2, 5] configuration, in which they can be found ∼22% of the time. Once an ion with enough kinetic energy enters the channel, it displaces the innermost resident ion from its binding site, initiating conduction via a knock-on effect and the ions move into a [3, 2, 6] configuration inside the channel. Again, the transition from these two states is almost instantaneous. Once the channel is in the [3, 2, 6] configuration state, it spends ∼12% of its time in this state before the outermost ion moves out of the channel, reverting to the [3, 2, 5] steady state.
Current-voltage-concentration profiles
We study the conductance properties of the GABAA receptor under various conditions by performing Brownian dynamics simulations. To construct the current-voltage relationship, shown in Fig. 7 A, we run Brownian dynamics simulations at 20 mV intervals and compare it to the experimental main conductance level current-voltage relationship of the single-channel data (open circles) reported by Bormann et al. (1987). The chord conductance, derived by fitting a linear regression through the data points is 30.0 ± 2.0 pS, compared to the experimental value of 29.6 pS. The simulated data points are in excellent agreement with the experimental data, although the channel diameter and charge on acidic residues have been adjusted to get the simulated conductance in the right range.
FIGURE 7.

The current-voltage and conductance-concentration relationships. (A) The current measured at various applied potentials is obtained with symmetrical solutions of 155 mM NaCl in both reservoirs. A data point (solid circle) represents the average of 50 sets of simulations, each set lasting 1 × 10⁶ time steps (or 0.1 μs). Error bars have a length of 1 mean ± SE. Superimposed on the simulated data are the experimental measurements obtained by Bormann et al. (1987), shown as open circles. (B) To construct the concentration-conductance curve, the outward currents are obtained with symmetrical solutions of NaCl of varying concentrations, under an applied potential of +60 mV. The data points are fitted by solid lines using the Michaelis-Menten equation. The experimental single-channel measurements obtained by Bormann et al. (1987) at −70 mV is shown in the inset.
The current-concentration relationship of a single channel reveals important information about the underlying permeation mechanism. Here we provide the results of our simulations on the GABAA channel. Experimentally, the current, I, across many channels first increases with an increasing ionic concentration [Cl] and then saturates, leading to a current-concentration relationship of the Michaelis-Menten form: I = Imax/(1 + Cls/[Cl]). Thus, the current approaches the saturation current, Imax, when [Cl] ≫ Cls. This kind of relationship arises when the mechanism of ion permeation through the channel is a multistep process containing both concentration-dependent steps and concentration-independent step. In this case we expect that the time spent waiting for an eleventh ion to enter the channel will decrease as concentration is increased, whereas the time it takes for an ion to leave the channel will remain unchanged. In Fig. 7 B, the currents obtained from Brownian dynamics simulations in the GABAA receptor, under the applied potential of 60 mV, are plotted against the Cl− activity (in mM). The single-channel experimental data obtained by Bormann et al. (1987) using an applied potential of −70 mV is shown in the inset. The calculated fit of the Michaelis-Menten equation for each relationship is plotted as a solid line. The half-saturation point Cls of the simulated data, determined from the fitted curve is 150 mM, compared to the experimental value obtained by Bormann et al. (1987) of 155 mM. Other concentration-conductance relationships described in the literature were for whole-cell patch clamps and the half-saturation point at positive voltages was much higher than at negative voltages (Fatima-Shad and Barry, 1993). As these experimental measurements were made on native receptors of unknown subunit composition, it is unclear how directly comparable they are to our simulations using a model α1β2γ2 receptor.
γ2 K289M mutation
An epilepsy-associated point mutation of the Lys-289 (Lys-24′) residue to methionine in the γ2 subunit was recently described by Baulac et al. (2001) as causing a marked decrease in whole-cell current at −60 mV. In contrast, subsequent investigations by Bianchi et al. (2002) have indicated that this mutation has no effect on the single-channel conductance. As γ2 Lys-289 is a channel-lining residue near the external membrane surface in our model, shown by the magenta residue in Fig. 8, its mutation could be expected to affect channel conductance in our simulations. As such, it can be considered a reasonable test of the model. We incorporated the γ2 K289M mutation into our model and performed Brownian dynamics simulations with an applied potential of +60 mV. In the K289M mutant, we obtained a current of 1.53 ± 0.16 pA during a 5.0-μs simulation period, compared to 1.77 ± 0.14 pA in the wild-type GABAA receptor in the same period of time. Our results give a qualitative agreement with Bianchi et al. (2002), showing little effect on conductance despite this residue being part of the channel lining in the model.
FIGURE 8.
The K289 mutation. (A) The location of the γ2 Lys-289 residue is shown in magenta in an expanded view of the selectivity filter. (B) The dwell histograms are obtained before (shaded lines) and after (solid bars) the Lys-289 residue is mutated to methionine. The mutation of this positively charged residue to a neutral residue decreases the strength of the ionic binding sites in the region between z = −20 Å and z = 0 Å.
The mutation of a positively charged residue to a neutral residue affects the potential energy profile an ion experiences as it moves through the pore. This is best illustrated by examining the effect of the K289M mutation on the individual binding sites of the resident ions. To do this, we divide the channel into 120 sections and examine the average number of ions in each section during an entire Brownian dynamics simulation period. Fig. 8 B shows the mean dwell histogram for the K289M mutation (solid bars). The original GABAA mean dwell histogram is superimposed as a shaded line. Comparison of the two histograms shows that the K289M mutation significantly decreases the strength of the ion binding site located at z = −8 Å. Integrating the K289M mean dwell histogram shows that the mutant GABA receptor contains an average of 9.6 resident ions, compared to the average of 10.6 resident ions in the original GABAA. Although the number of ions in the channel is decreased by one, the mechanism of ion conduction is essentially unaltered—in this case a tenth ion initiates conduction via a knock-on effect. This effect has been noticed in previous investigations of a theoretical mutation in a ClC-0 channel homology model (Corry et al., 2004).
DISCUSSION
We have presented simulations of ion permeation through a model GABAA receptor comprised of a previously described extracellular domain model and a channel domain model based on the recent atomic model of the nAChR channel (Miyazawa et al., 2003). The purpose of such simulations is to improve our understanding of ion permeation through physical ion channels so it is important that the model is as realistic as possible. The extracellular domain creates a vestibule that contributes to the ion permeation properties but the transmembrane region of the channel, which acts as the selectivity filter, is the major determinant of ion permeation. The work of Miyazawa et al. (2003) has been an important step forward in understanding the structure of this region and has allowed us to build a model with realistic tertiary geometry although some of the molecular details remain uncertain. Earlier models have simply included a helical M2 (Sansom et al., 1998) or built a channel domain using unrelated structures as a template (Ortells and Lunt, 1996). More recently Trudell and his colleagues (Trudell, 2002; Trudell and Bertacinni, 2004) have used unrelated proteins as templates for modeling the GABAA receptor transmembrane domain as a four-helix bundle with a similar arrangement of helices to the data of Miyazawa et al. (2003), but with a clearly distinct tertiary geometry. They have carefully incorporated biochemical constraints into their model, particularly constraints arising from engineered disulfides linking the 24′ residue in the M2–M3 loop to the extracellular domain (Kash et al., 2003) and, very recently, linking the 15′ residue to an M3 residue (Lobo et al., 2004). These constraints, particularly the latter, are not well satisfied in our model but could potentially be met by relatively small modifications of the model at the domain interface. Such iterative improvement and evaluation of models in the light of biochemical constraints is an ongoing process that should lead to more realistic models, particularly at the interface between the channel and extracellular domains.
The nAChR structure used as the template for the transmembrane domain homology model represents the nAChR receptor in a closed state, exhibiting a smaller minimum pore diameter than the equivalent open-state model would have. The initial homology model of the GABAA receptor has a minimum pore diameter of just under 4 Å, compared to the experimentally determined value of between 5 and 6 Å. Simulations on the narrower pore model showed that ions are unable to permeate across the constricted region of the channel in our model, consistent with this region being modeled on the structure of the closed nAChR (Unwin et al., 2002).
In building the homology model, we initially assume the closed state of nAChR and GABAA are the same and is the state in which the ligand is not bound to the receptor. However, the orientation of the transmembrane domain appears to be different for nAChR and GABAA. Miyazawa et al. (2003) proposed that a 15° rotation of the nAChR transmembrane domain would open the channel, allowing cation permeation. This proposition has been supported by Brownian dynamics simulations on a crude all-atom model of the acetylcholine receptor (Corry, 2004). Our own studies have shown that expanding the pore diameter of the nAChR transmembrane domain by as much as 3 Å without the proposed rotation does not allow the nAChR channel to conduct cations.
It is of interest to compare our homology model to the study carried out by Horenstein et al. (2001), who used cysteine mutagenesis and disulfide bond trapping to probe the protein mobility of the α1β1 GABAA receptor M2 domain at the 6′, 17′, and 20′ positions. They conclude that channel opening indices a conformational change involving an asymmetrical rotation of the N-terminal M2 domains, allowing two of the adjacent β1 subunits to rotate toward each other at the 6′ location. The disulfide trapping results indicate that the combined rotational motion of the two subunits is ∼120°, allowing the adjacent 6′ α-carbons to move close enough for disulfide bond formation, ∼5.6 Å apart (Horenstein et al., 2001). In our α1β2γ2 homology model, the average separation between adjacent 6′ α-carbons is ∼8.26 Å in both the open and closed states. If we were to artificially and asymmetrically rotate each M2 domain to move the adjacent 6′ α-carbons closer together, any one M2 domain could be rotated by as much as 120°. A rotation of only 100° is sufficient to change the entire distribution of the pore-lining residues along the M2 domain. As the pore-lining residues in both the open- and closed-state homology model M2 domain and M2–M3 linker region match the experimentally determined pore-lining residues (Xu and Akabas, 1996; Bera et al., 2002), and the exact nature of this asymmetrical rotation is currently unknown, we are reluctant to adopt this approach.
Rather than arbitrarily rotating the transmembrane domain of the GABAA receptor model to induce an open state, we use an alternative approach. We find that restoring the experimental minimum pore diameter and placing a partial charge of −0.6 e on a ring of five negatively charged residues (two α Glu-59, γ Glu-71, and two β Asp-56) is sufficient to open the channel. These five residues are located on the pore-lining N-terminal loops of the ligand-binding domain, which represents the most uncertain region of our model. Comparison of the open- and closed-state homology models gives a maximum backbone root-mean-squared deviation of ≤0.1 Å, indicating that our method of restoring the minimum pore diameter does not induce any structural changes in the homology model and simply represents a slight reorientation of the pore-lining amino acid side chains. Until structural images of the open- and closed-state GABAA receptor have been determined, we have no way of knowing if the mechanism of opening the GABAA receptor is the same as the proposed mechanism for the acetylcholine receptor. The strongest support for our proposed mechanism of channel opening is the ability to accurately reproduce the experimental results.
The close agreement between the results of simulations and experimental observations is not contrived by judiciously adjusting free parameters. The friction coefficient, miγi, that features in the Langevin equation, has not been experimentally evaluated. The frictional coefficient is related to the diffusion coefficient, D, by the Einstein relation. Allen et al. (2000) obtained estimates of diffusion coefficients of Na+, K+, and Cl− ions in various segments of the KcsA potassium channel and schematic channels using molecular dynamics. The diffusion coefficients of all three ionic species are reduced to ∼38% of bulk diffusion value in the hydrophobic chamber of the KcsA channel. Throughout this study, we reduce the diffusion coefficients in the pore to 50% of the bulk values. Unlike simulations performed using Poisson-Nernst-Planck theory, where conductance scales linearly with the assumed diffusion coefficient D, the conductance deduced from Brownian dynamics simulations is less sensitive to this parameter. The outward and inward currents across the potassium channel are reduced only slightly as DK is reduced from the bulk value to 10% of this (Chung et al., 1999). To solve Poisson's equation we use dielectric constants of 2, 60, and 80 for the protein, channel, and reservoir. We have justified and consistently used these values in all our studies, including this one. For further discussion on this issue, see Burykin et al. (2002, 2003), Chung et al. (2002), and Corry et al. (2004).
By performing Brownian dynamics simulations with the all-atom homology model of the GABAA receptor, we have successfully matched the single-channel current-voltage and conductance-concentration data, as well as reproducing the current behavior exhibited by the K289M epilepsy-inducing mutant GABAA receptor. Furthermore, we have been able to provide a detailed picture of permeation dynamics taking place in the pore that cannot be revealed experimentally. The channel cradles 10 Cl− ions, each occupying a preferred binding site. The stable equilibrium established by the resident ion is disrupted when an additional ion under the influence of an applied potential or chemical gradient enters the pore. As in the KcsA potassium channel, conduction across the anionic channel occurs as a knock-on effect, each resident ion shuffling to the next binding site. The rate-limiting step in conduction is the time it takes for the interloper ion to dislodge the outermost ion from its binding site.
We find that the model is sensitive to departures from the chosen structure. For example, unless the charges carried by the acidic residues near the oval cavity are reduced, Cl− ions are unable to surmount the energy barrier created by them. Similarly, when the radius of the selectivity filter is made larger or smaller than the dimension we adopt, the linear current-voltage curve with the correct cord conductance cannot be obtained. In studying this important class of the ligand-gated ion channel, there now can be a fruitful interaction between theory and experiment, the former making testable predictions and the latter providing clues for further refinements of the model.
SUPPLEMENTARY MATERIAL
An online supplement to this article can be found by visiting BJ Online at http://www.biophysj.org.
Supplementary Material
Acknowledgments
We thank Dr. Craig J. Mortimer for his assistance in producing the homology model and Dr. David K. Bisset for his assistance in creating an expanded pore structure of the GABAA receptor. The calculations upon which this work is based were carried out using the Compaq AlphaServer SC system (Palo Alto, CA) of the Australian National University Supercomputer Facility.
This work was supported by grants from the Australian Research Council and the National Health and Medical Research Council of Australia.
References
- Akabas, M. H., C. Kaufmann, P. Archdeacon, and A. Karlin. 1994. Identification of acetylcholine receptor channel-lining residues in the entire M2 segment of the alpha subunit. Neuron. 13:919–927. [DOI] [PubMed] [Google Scholar]
- Allen, T. W., S. Kuyucak, and S. H. Chung. 2000. Molecular dynamics estimates of ion diffusion in model hydrophobic and KcsA potassium channels. Biophys. Chem. 86:1–14. [DOI] [PubMed] [Google Scholar]
- Baulac, S., G. Huberfeld, I. Gourfinkel-An, G. Mitropoulou, A. Beranger, J. P. Prud'homme, M. Baulac, A. Brice, R. Bruzzone, and E. Le Guern. 2001. First genetic evidence of GABA receptor dysfunction in epilepsy: a mutation in the 2-subunit gene. Nat. Genet. 28:46–48. [DOI] [PubMed] [Google Scholar]
- Bera, A. K., M. Chatav, and M. H. Akabas. 2002. GABAA receptor M2–M3 loop secondary structure and changes in accessibility during channel gating. J. Biol. Chem. 277:43002–43010. [DOI] [PubMed] [Google Scholar]
- Bianchi, M. T., L. Song, H. Zhang, and R. L. Macdonald. 2002. Two different mechanisms of disinhibition produced by GABAA receptor mutations linked to epilepsy in humans. J. Neurosci. 22:5321–5327. [DOI] [PMC free article] [PubMed] [Google Scholar]
- Bormann, J., O. P. Hamill, and B. Sakmann. 1987. Mechanism of anion permeation through channels gated by glycine and γ-aminobutyric acid in mouse cultured spinal neurons. J. Physiol. 385:243–286. [DOI] [PMC free article] [PubMed] [Google Scholar]
- Bouzat, C., F. Gumilar, G. Spitzmaul, H. L. Wang, D. Rayes, S. B. Hansen, P. Taylor, and S. M. Sine. 2004. Coupling of agonist binding to channel gating in an ACh-binding protein linked to an ion channel. Nature. 430:896–900. [DOI] [PubMed] [Google Scholar]
- Brejc, K., W. J. van Dijk, R. V. Klaassen, M. Schuurmans, J. van der Oost, A. B. Smit, and T. K. Sixma. 2001. Crystal structure of an ACh-binding protein reveals the ligand-binding domain of nicotinic receptors. Nature. 411:269–276. [DOI] [PubMed] [Google Scholar]
- Brooks, B. R., R. E. Bruccoleri, B. D. Olafson, D. J. States, S. Swaminathan, and M. Karplus. 1983. CHARMM: a program for macromolecular energy, minimization, and dynamics calculations. J. Comput. Chem. 4:187–217. [Google Scholar]
- Burykin, A., M. Kato, and A. Warshel. 2003. Exploring the origin of the ion selectivity of the KcsA potassium channel. Proteins. 52:412–426. [DOI] [PubMed] [Google Scholar]
- Burykin, A., C. N. Schutz, J. Villa, and A. Warshel. 2002. Simulations of ion current in realistic models of ion channels: the KcsA potassium channel. Proteins. 47:265–280. [DOI] [PubMed] [Google Scholar]
- Celie, P. H., S. E. van Rossum-Fikkert, W. J. van Dkjk, K. Brejc, A. B. Smit, and T. K. Sixma. 2004. Nicotine and carbamylcholine binding to nicotinic acetylcholine receptors as studied in AChBP crystal structures. Neuron. 41:907–914. [DOI] [PubMed] [Google Scholar]
- Chung, S. H., T. W. Allen, M. Hoyles, and S. Kuyucak. 1999. Permeation of ions across the potassium channel: Brownian dynamics studies. Biophys. J. 77:2517–2533. [DOI] [PMC free article] [PubMed] [Google Scholar]
- Chung, S. H., T. W. Allen, and S. Kuyucak. 2002. Conducting-state properties of the KcsA potassium channel from molecular and Brownian dynamics simulations. Biophys. J. 82:628–645. [DOI] [PMC free article] [PubMed] [Google Scholar]
- Chung, S. H., M. Hoyles, T. W. Allen, and S. Kuyucak. 1998. Study of ionic currents across a model membrane channel using Brownian dynamics. Biophys. J. 75:793–809. [DOI] [PMC free article] [PubMed] [Google Scholar]
- Corry, B. 2004. Theoretical confirmation of the closed and open states of the acetylcholine receptor channel. Biochim. Biophys. Acta. 1163:2–5. [DOI] [PubMed] [Google Scholar]
- Corry, B., T. W. Allen, S. Kuyucak, and S. H. Chung. 2001. Mechanisms of permeation and selectivity in calcium channels. Biophys. J. 80:195–214. [DOI] [PMC free article] [PubMed] [Google Scholar]
- Corry, B., M. O'Mara, and S. H. Chung. 2004. Conduction mechanisms of chloride ions in ClC-type channels. Biophys. J. 86:846–860. [DOI] [PMC free article] [PubMed] [Google Scholar]
- Cromer, B. A., C. J. Morton, and M. W. Parker. 2002. Anxiety over GABAA receptor relieved by AChBP. TIBS. 27:280–287. [DOI] [PubMed] [Google Scholar]
- Eisele, J. L., S. Bertrand, J. L. Galzi, T. A. Devillers, J. P. Changeux, and D. Bertrand. 1993. Chimaeric nicotinic-serotonergic receptor combines distinct ligand binding and channel specificities. Nature. 366:479–483. [DOI] [PubMed] [Google Scholar]
- Fatima-Shad, K., and P. H. Barry. 1993. Anion permeation in GABA- and glycine-gated channels of mammalian cultured hippocampal neurons. Proc. R. Soc. Lond. B. Biol. Sci. 253:69–75. [DOI] [PubMed] [Google Scholar]
- Giraudat, J., M. Dennis, T. Heidmann, J. Y. Chang, and J. P. Changeux. 1986. Structure of the high-affinity binding site for noncompetitive blockers of the acetylcholine receptor: serine-262 of the δ subunit is labeled by [3H] chlorpromazine. Proc. Natl. Acad. Sci. USA. 83:2719–2723. [DOI] [PMC free article] [PubMed] [Google Scholar]
- Goren, E. N., D. C. Reeves, and M. H. Akabas. 2004. Loose protein packing around the extracellular half of the GABAA receptor β1 subunit M2 channel-lining segment. J. Biol. Chem. 279:11198–11206. [DOI] [PubMed] [Google Scholar]
- Grenningloh, G., A. Rienitz, B. Schmitt, C. Methfessel, M. Zensen, K. Beyreuther, E. D. Gundelfinger, and H. Betz. 1987. The strychnine-binding subunit of the glycine receptor shows homology with nicotinic acetylcholine receptor. Nature. 328:215–220. [DOI] [PubMed] [Google Scholar]
- Grutter, T., and J. P. Changeux. 2001. Nicotinic receptors in wonderland. TIBS. 26:459–463. [DOI] [PubMed] [Google Scholar]
- Guex, N., and M. C. Peitsch. 1997. SWISS-MODEL and the Swiss-PdbViewer: an environment for comparative protein modelling. Electrophoresis. 18:2714–2723. [DOI] [PubMed] [Google Scholar]
- Hevers, W., and H. Lueddens. 1998. The diversity of GABAA receptors: pharmacological and electrophysiological properties of GABAA channel subtypes. Mol. Neurobiol. 18:35–86. [DOI] [PubMed] [Google Scholar]
- Horenstein, J., D. A. Wagner, C. Czajkowski, and M. H. Akabas. 2001. Protein mobility and GABA-induced conformational changes in GABAA receptor pore-lining M2 segment. Nat. Neurosci. 4:477–485. [DOI] [PubMed] [Google Scholar]
- Hoyles, M., S. Kuyucak, and S. H. Chung. 1998. Solutions of Poisson's equation in channel-like geometries. Comput. Phys. Commun. 115:45–68. [Google Scholar]
- Imoto, K., C. Busch, B. Sakmann, M. Mishina, T. Konno, J. Nakai, H. Bujo, Y. Mori, K. Fukuda, and S. Numa. 1988. Rings of negatively charged amino acids determine the acetylcholine receptor channel conductance. Nature. 335:645–648. [DOI] [PubMed] [Google Scholar]
- Imoto K., C. Methfessel, B. Sakmann, M. Mishina, Y. Mori, T. Konno, K. Fukuda, M. Kurasaki, H. Bujo, Y. Fujita, and S. Numa. 1986. Location of a δ-subunit region determining ion transport through the acetylcholine receptor channel. Nature. 324:670–4. [DOI] [PubMed] [Google Scholar]
- Kash, T. L., A. Jenkins, J. C. Kelley, J. R. Trudell, and N. L. Harrison. 2003. Coupling of agonist binding to channel gating in the GABAA receptor. Nature. 421:272–275. [DOI] [PubMed] [Google Scholar]
- Langosch, D., B. Laube, N. Rundstrom, V. Schmieden, J. Bormann, and H. Betz. 1994. Decreased agonist affinity and chloride conductance of mutant glycine receptors associated with human hereditary hyperekplexia. EMBO J. 13:4223–4228. [DOI] [PMC free article] [PubMed] [Google Scholar]
- Langosch, D., L. Thomas, and H. Betz. 1988. Conserved quaternary structure of ligand-gated ion channels: the postsynaptic glycine receptor is a pentamer. Proc. Natl. Acad. Sci. USA. 85:7394–7398. [DOI] [PMC free article] [PubMed] [Google Scholar]
- Lester, H. J. 1992. The permeation pathway of neurotransmitter-gated ion channels. Annu. Rev. Biophys. Biomol. Struct. 21:267–292. [DOI] [PubMed] [Google Scholar]
- Lester, H. A., M. I. Dibas, D. S. Dahan, J. F. Leite, and D. A. Dougherty. 2004. Cys-loop receptors: new twists and turns. Trends Neurosci. 27:329–336. [DOI] [PubMed] [Google Scholar]
- Li, S. C., M. Hoyles, S. Kuyucak, and S. H. Chung. 1998. Brownian dynamics study of ion transport in the vestibule of membrane channels. Biophys. J. 74:37–47. [DOI] [PMC free article] [PubMed] [Google Scholar]
- Lobo, I. A., J. R. Trudell, and R. A. Harris. 2004. Cross-linking of glycine receptor transmembrane segments two and three alters coupling of ligand binding with channel opening. J. Neurochem. 90:962–969. [DOI] [PubMed] [Google Scholar]
- Maricq, A. V., A. S. Peterson, A. J. Brake, R. M. Myers, and D. Julius. 1991. Primary structure and functional expression of the 5HT3 receptor, a serotonin-gated ion channel. Science. 254:432–437. [DOI] [PubMed] [Google Scholar]
- Miyazawa, A., Y. Fujiyoshi, and N. Unwin. 2003. Structure and gating mechanism of the acetylcholine receptor pore. Nature. 423:949–955. [DOI] [PubMed] [Google Scholar]
- Moy, G., B. Corry, S. Kuyucak, and S. H. Chung. 2000. Tests of continuum theories as models of ion channels. I. Poisson-Boltzmann theory versus Brownian dynamics. Biophys. J. 78:2349–2363. [DOI] [PMC free article] [PubMed] [Google Scholar]
- Neria, E., S. Fischer, and M. Karplus. 1996. Simulation of activation free energies in molecular systems. J. Chem. Phys. 105:1902–1921. [Google Scholar]
- Nina, M., D. Beglov, and B. Roux. 1997. Atomic radii for continuum electrostatic calculations based on molecular dynamics free energy simulations. J. Phys. Chem. B. 101:5239–5248. [Google Scholar]
- Noda, M., H. Takahashi, T. Tanabe, M. Toyosata, S. Kikyotani, Y. Furutani, T. Hirose, H. Takashima, S. Inayama, T. Miyata, and S. Numa. 1983. Structural homology of Torpedo california acetylcholine receptor subunits. Nature. 302:528–532. [DOI] [PubMed] [Google Scholar]
- O'Mara, M., P. H. Barry, and S. H. Chung. 2003. A model of the glycine receptor deduced from Brownian dynamics studies. Proc. Natl. Acad. Sci. USA. 100:4310–4315. [DOI] [PMC free article] [PubMed] [Google Scholar]
- Ortells, M. O., and G. G. Lunt. 1996. A mixed helix-beta-sheet model of the transmembrane region of the nicotinic acetylcholine receptor. Protein. Eng. 9:51–59. [DOI] [PubMed] [Google Scholar]
- Pascual, J. M., and A. Karlin. 1998. State-dependent accessibility and electrostatic potential in the channel of the acetylcholine receptor. Inferences from rates of reaction of thiosulfonates with substituted cysteines in the M2 segment of the alpha subunit. J. Gen. Physiol. 111:717–739. [DOI] [PMC free article] [PubMed] [Google Scholar]
- Press, W. H., B. P. Flannery, S. A. Teukolsky, and W. T. Vetterling. 1989. Numerical Recipes. Cambridge University Press, Cambridge, UK.
- Rajendra, S., R. J. Vandenberg, K. D. Pierce, A. M. Cunningham, P. W. French, P. H. Barry, and P. R. Schofield. 1995. The unique extracellular disulfide loop of the glycine receptor is a principal ligand binding element. EMBO J. 14:2987–2998. [DOI] [PMC free article] [PubMed] [Google Scholar]
- Reif, F. 1965. Fundamentals of Statistical and Thermal Physics. McGraw-Hill, New York, NY.
- Sansom, M. S. P., C. Adcock, and G. R. Smith. 1998. Modeling and simulation of ion channels: applications to the nicotinic acetylcholine receptor. J. Struct. Biol. 121:246–262. [DOI] [PubMed] [Google Scholar]
- Schofield, P. R., G. M. Darlison, N. Fujita, D. R. Burt, F. A. Stephenson, H. Rodriguez, L. M. Rhee, J. Ramachandran, V. Reale, T. A. Glencorse, P. H. Seeburg, and E. A. Barnard. 1987. Sequence and functional expression of the GABAA receptor show a ligand-gated receptor subfamily. Nature. 328:221–227. [DOI] [PubMed] [Google Scholar]
- Sigel, E., and A. Buhr. 1997. The benzodiazepine binding site of GABAA receptors. Trends Pharmacol. Sci. 18:425–429. [DOI] [PubMed] [Google Scholar]
- Smith, G. B., and R. W. Olsen. 1995. Functional domains of GABAA receptors. Trends Pharmacol. Sci. 16:162–168. [DOI] [PubMed] [Google Scholar]
- Thompson, J. D., D. J. Higgins, and T. J. Gibson. 1994. CLUSTAL W: improving the sensitivity of progressive multiple sequence alignment through sequence weighting, position-specific gap penalties and weight matrix choice. Nucleic Acids Res. 22:4673–4680. [DOI] [PMC free article] [PubMed] [Google Scholar]
- Trudell, J. 2002. Unique assignment of inter-subunit association in GABAA α1β3γ2 receptors determined by molecular modeling. Biochim. Biophys. Acta. 1565:91–96. [DOI] [PubMed] [Google Scholar]
- Trudell, J. R., and E. Bertacinni. 2004. Comparative modeling of a GABAA α1 receptor using three crystal structures as templates. J. Mol. Graph. Model. 23:39–49. [DOI] [PubMed] [Google Scholar]
- van Gunsteren, W. F., and H. J. C. Berendsen. 1982. Algorithms for Brownian dynamics. Mol. Phys. 45:637–647. [Google Scholar]
- Wallace, R. H., C. Marini, S. Petrou, L. A. Harkin, D. N. Bowser, R. G. Panchal, D. A. Williams, G. R. Sutherland, J. C. Mulley, I. E. Scheffer, and S. F. Berkovic. 2001. Mutant GABAA receptor γ2-subunit in childhood absence epilepsy and febrile seizures. Nat. Genet. 28:49–52. [DOI] [PubMed] [Google Scholar]
- Unwin, N. 1993. Neurotransmitter action: opening of ligand-gated ion channels. Cell. 72(Suppl.):31–41. [DOI] [PubMed] [Google Scholar]
- Unwin, N. 1995. Acetylcholine receptor channel imaged in the open state. Nature. 373:37–43. [DOI] [PubMed] [Google Scholar]
- Unwin, N., A. Miyazawa, J. Li, and Y. Fujiyoshi. 2002. Activation of the nicotinic acetylcholine receptor involves a switch in conformation of the alpha subunits. J. Mol. Biol. 319:1165–1176. [DOI] [PubMed] [Google Scholar]
- Xu, M., and M. H. Akabas. 1996. Identification of channel-lining residues in the M2 membrane-spanning segment of the GABAA receptor α1 subunit. J. Gen. Physiol. 107:195–205. [DOI] [PMC free article] [PubMed] [Google Scholar]
- Zwanzig, R. 2001. Nonequilibrium Statistical Mechanics. Oxford University Press, Oxford, UK.
Associated Data
This section collects any data citations, data availability statements, or supplementary materials included in this article.