

Abstract
We have conducted extensive molecular dynamics (MD) simulations together with differential scanning calorimetry (DSC) and nuclear magnetic resonance (NMR) experiments to quantify the influence of free 1,6-diphenyl-1,3,5-hexatriene (DPH) fluorescent probes on the structure and dynamics of a dipalmitoylphosphatidylcholine bilayer. Atomistic MD simulations show that in the membrane-water interface the influence of DPH is minor, whereas in the acyl-chain region DPH gives rise to major perturbations. In the latter case, DPH is found to influence a wide range of membrane properties, such as the packing and ordering of hydrocarbon tails and the lateral diffusion of lipid molecules. The effects are prominent but of local nature, i.e., the changes observed in the properties of lipid molecules are significant in the vicinity of DPH, but reduce rapidly as the distance from the probe increases. Long-range perturbations due to DPH are hence not expected. Detailed DSC and 2H NMR measurements support this view. DSC shows only subtle perturbation to the cooperative behavior of the membrane system in the presence of DPH, and 2H NMR shows that DPH gives rise to a slight increase in the lipid chain order, in agreement with MD simulations. Potential effects of other probes such as pyrene are briefly discussed.
INTRODUCTION
Biological membranes are an excellent example of soft interfaces characterized by dynamic heterogeneity and the formation of small-scale domains, where numerous biological functions take place (Bloom et al., 1991; Gennis, 1989; Katsaras and Gutberlet, 2001; Mayor and Rao, 2004; Simons and Ikonen, 1997). They are complex molecular assemblies characterized by a variety of different length and timescales (Bloom et al., 1991; Gennis, 1989; Lipowsky and Sackmann, 1995), which renders experimental studies of membrane systems an inspiring challenge.
A particularly popular approach to study the structure and dynamics of lipid membranes and the effects of molecules embedded in lipid bilayers is based on the use of fluorescent probes (Abrams and London, 1993; Chattopadhyay and London, 1987; Epand et al., 1996; Lakowicz, 1983; Lentz, 1989, 1993; Maier et al., 2002; Somerharju, 2002). Depending on the type of probe used, one can gauge properties of different membrane regions surrounding the probe employed. Charged probes such as trimethylamino-diphenylhexatriene (Lentz, 1993), polar fluorophores such as nitrobenzoxadiazole (NBD) (Chattopadhyay, 1990), and probes including a short acyl chain such as 6-propionyl-2-dimethylaminoaphthalene (prodan) (Krasnowska et al., 1998) tend to sense the membrane-water interface, thus providing information regarding the polar headgroup. Meanwhile, various hydrophobic probes such as diphenylhexatriene (DPH), pyrene (Somerharju, 2002), and trans-parinaric acid (trans-PA) (Lentz, 1993; Maier et al., 2002; Yashar et al., 1987) are commonly employed to explore the membrane hydrocarbon chain region. DPH, in particular, is readily soluble in the hydrocarbon tail region. It is consequently often used in measurements of fluorescence anisotropy to monitor the rotational motion of DPH, which in turn can provide insight into membrane fluidity and lipid ordering (Holopainen et al., 1998; Lentz, 1993; Repáková et al., 2004).
Although fluorescent probes can provide valuable insight into the structure and dynamics of biomembranes, there is reason to emphasize that the use of fluorescent probes is subject to certain nontrivial problems that are difficult to quantify. Of particular concern are possible perturbations induced by the probes (Lentz, 1989, 1993; Somerharju, 2002). This matter is of concern in all cases commonly used in experiments, i.e., when probes are embedded freely in membranes, or when they are linked to lipids or other molecules under study. Commonly, it is assumed that when used in small concentrations, fluorescent probes do not interfere with membrane properties in a significant fashion. In practice, however, several experimental studies have indicated that probes do affect membrane systems (Koivusalo et al., 2004; Lentz, 1989, 1993; Leonard-Latour et al., 1996; Parente and Lentz, 1985; Somerharju et al., 1985; Yashar et al., 1987).
In pioneering studies by Lentz and his co-workers (Lentz, 1989, 1993; Lentz et al., 1978; Parente and Lentz, 1985), the authors found through calorimetric studies that fluorescent probes may slightly change the main phase transition temperature (Tm) of phosphatidylcholine bilayers. The changes were small, on the order of 0.1–0.2°C, but seemed systematic. Similar findings by differential scanning calorimetry (DSC) have been made by Ben Yashar and co-workers, who also reported that fluorescent probes may alter the nuclear magnetic resonance (NMR) spectra of choline protons of dimyristoylphosphatidylcholine (DMPC) unilamellar vesicles (Yashar et al., 1987). As for packing, Somerharju and his co-workers studied neat pyrene phospholipid monolayers spread on an argon-water interface and compared the results with those of dipalmitoylphosphatidylcholine (DPPC) (Somerharju et al., 1985). They concluded that the surface area occupied by a pyrene derivative was larger than that of the alkyl chain lipids. More recently, Leonard-Latour and co-workers found that free pyrene embedded in dimyristoylphosphatidic acid (DMPA)/DMPC monolayers modifies the isotherm shape in the liquid-expanded phase and leads to a substantial increase in the area per molecule (Leonard-Latour et al., 1996). When the pyrene moiety was covalently linked to a phospholipid (1-hexadecanoyl-2-(1-pyrenyldecanoyl)-sn-glycero-3-phosphocholine, PyC10PPC), surface pressure-area isotherms indicated a similar increase in the area per molecule, and the effects were enhanced for an increasing PyC10PPC concentration. Huster and co-workers have identified changes in the orientational ordering of lipid hydrocarbon tails of NBD-labeled lipids (Huster et al., 2001; Vogel et al., 2003). Finally, recent studies by Koivusalo and her collaborators have indicated that the partitioning of pyrene-labeled phospholipids between fluidlike and gel-like domains depends on the length of the labeled acyl chain (Koivusalo et al., 2004), confirming the idea that probe-linked lipids have intrinsic properties different from their native molecules.
The above examples highlight the common assumption that both free and lipid-linked probes inevitably perturb the membrane to some extent (Lentz, 1993; Somerharju, 2002). The question is, how significant are the perturbations, and are the effects short- or long-ranged? Experimental studies of this issue would be desired, but in many cases are limited by resolution. Atomistic simulations, however, provide a unique means to complement experimental observations of lipid membrane systems (Feller, 2000; Saiz and Klein, 2002; Scott, 2002; Vattulainen and Karttunen, 2005). Most importantly, they allow one to gain insight into the nature of atomic-scale phenomena with a level of detail missing from experimental observations.
Given the additional information available from simulations, it is surprising how little this approach has been used to elucidate the behavior of fluorescent probes in membrane systems. Most attempts to date (Cascales et al., 1997; van der Heide and Levine, 1994) have shed some light on the structure and dynamics of probes, but the studies have been limited to very short times (<1 ns) and have thus also been limited in scope. More recently, Repáková et al. (2004) conducted a more thorough study employing atomistic molecular dynamics (MD) simulations to clarify the location and orientational distribution of free DPH molecules embedded in a DPPC bilayer above Tm. DPH was found to be located in the hydrocarbon core, where it favored the middle region of the hydrocarbon tails rather than the center of the bilayer where the free volume is largest. Its orientation in turn was observed to favor the case where the principal axis of DPH is aligned with the membrane normal, thus reflecting the order of the acyl chains. In many respects, the work in Repáková et al. (2004) clarified the long-standing uncertainty about the DPH location and orientation, and the results provided support for the continued use of DPH as a probe of chain order.
In this article, we extend our previous work (Repáková et al., 2004), with an objective to characterize the influence of free DPH on membrane structure and dynamics. To this end, we combine atomic-scale MD simulation studies with experiments. We extend previous DPH/DPPC simulations to longer times, thus allowing us to conduct a detailed analysis of the perturbations induced by DPH. In this manner, we have access to DPH-induced large-scale effects manifested through changes in, e.g., the membrane thickness and the area per molecule. Moreover, the simulation data allows us to gauge changes in membrane properties in the vicinity of the DPH probe, thus providing insight into the range of perturbations induced by the probe. Furthermore, to characterize changes on macroscopic scales where observations reflect average properties, we carry out DSC and 2H NMR experiments for a DPH/DPPC system. DSC is employed to monitor the influence of DPH on phase behavior around the main phase transition temperature, and 2H NMR is used to characterize DPH-induced changes in average lipid chain ordering over a wide temperature range.
We find through MD simulations that the perturbations induced by free DPH are very pronounced in its vicinity. For example, the ordering of DPPC hydrocarbon tails neighboring DPH is enhanced by ∼40% compared to lipids in a pure DPPC bilayer, and the lateral diffusion of lipids surrounding DPH is suppressed substantially. When the analysis is extended to all lipids in a system, providing a global average comparable to experiments, the effects due to DPH are found to be much smaller, of the order of a few percent. This demonstrates why perturbations due to fluorescent probes are difficult to quantify in experiments, and further illustrates the local range of perturbations induced by DPH. The results of DSC and 2H NMR measurements support this view. Close to Tm, DSC scans indicate only subtle perturbation to the cooperative thermotropic behavior of DPPC in the presence of DPH, and 2H NMR shows lipid chain ordering to be enhanced by DPH. However, the changes due to DPH are slight, in agreement with the present MD simulations.
EXPERIMENTAL AND COMPUTATIONAL METHODS
Materials and methods in experiments
For DSC measurements, DPPC was purchased from Coatsome (Amagasaki, Hyogo, Japan) and DPH from Molecular Probes (Eugene, OR). The purity of DPPC was verified by thin-layer chromatography on silicic acid-coated plates (Merck, Darmstadt, Germany) using chloroform/methanol/water (65:25:4, v/v/v) as a solvent system. Examination of the plate after iodine staining revealed no impurities. The purity of fluorescent DPH was checked by thin-layer chromatography under UV-illumination. Concentration of DPPC was determined gravimetrically using a high precision electrobalance (Cahn, Cerritos, CA) and that of DPH spectrophotometrically using 91,000 cm−1 at 354 nm as the respective molar extinction coefficient.
Differential heat capacity scans were recorded at a lipid concentration of 5 mM and at a heating rate of 0.5°C/min. The samples were hydrated at 65°C in purified water for 30 min, whereafter the samples were sonicated for 2 min in a bath type ultrasonicator (NEY Ultrasonik 104H, Yucaipa, CA). Water was freshly deionized in a Milli RO-Milli Q (Millipore, Billerica, MA) filtering system. Before their loading into precooled DSC cuvettes the samples were equilibrated on ice for ∼24 h and were thereafter degassed at low pressure. The calorimeter (VP-DSC, MicroCal, Northampton, MA) was interfaced to a PC and data were analyzed using the routines of the software provided with the instrument. The samples were heated from 10 to 80°C. All experiments were done in triplicates.
For NMR observations, DPPC-d62 was purchased from Avanti Polar Lipids (Alabaster, AL) and used without further purification. DPH was purchased from Molecular Probes (Eugene, OR). An NMR sample containing 2.3 mol % DPH in DPPC-d62 was prepared by co-dissolving the lipid and DPH in chloroform/methanol which was then removed by rotary evaporation and followed by overnight evacuation. For consistency, a similar protocol was used for the sample containing only DPPC-d62. The dried samples, containing ∼20 mg of perdeuterated lipid, were hydrated in ∼300 μl of potassium phosphate monobasic buffer (pH = 6.9–7) by gently rotating a flask containing the buffer and sample for ∼1 h in a bath warmed above the DPPC bilayer main transition temperature. Hydrated samples were sealed in 400 μl NMR tubes.
Deuterium NMR spectroscopy was done using a 9.4 T superconducting magnet and a locally constructed wideline spectrometer. Spectra were acquired using a quadrupole echo sequence (Davis et al., 1976) having 5.5 μs π/2 pulses separated by 35 μs. Each spectrum was obtained by averaging 2000 transients. These were collected with a repetition time of 0.9 s. Oversampling (Prosser et al., 1991) was used to achieve effective data acquisition dwell times of 4 μs for samples in the liquid crystalline phase and 2 μs for gel phase samples. Including times for equilibration (20 min) and collecting transients for a given spectrum, the effective cooling rate was 1°/h within 3° of the main transition temperature and 2°/h otherwise.
For fast, axially symmetric chain reorientation, the orientational order parameter for lipid chain deuterons is defined as
 |
(1) |
where θCD is the angle between the carbon-deuterium bond and the motional symmetry axis and where the average is over accessible chain conformations. The splitting between the prominent edges of the doublet spectrum corresponding to a given chain deuteron in an unoriented liquid crystalline bilayer sample is related to its orientational order parameter by
 |
(2) |
where e2qQ/h = 167 kHz is the quadrupole coupling constant for carbon-deuterium bonds. Powder spectra resulting from the multilamellar vesicle organization of these samples were transformed to spectra that would correspond to oriented samples by using a fast Fourier-transform “de-Pake-ing” algorithm (McCabe and Wassall, 1995). Orientational order parameter profiles for DPPC methylene deuterons were then approximated by integrating the methylene portions of de-Paked spectra and inverting the result to obtain deuteron quadrupole splitting, and thus |SCD|, as a function of normalized integrated spectra intensity (Brown et al., 2004).
Computational model and simulation details
The present model system, including force fields and other simulation details, have been described in a previous article (Repáková et al., 2004), where we also validated the model. Thus, here we discuss only those practical points that are relevant to the present work.
We consider a lipid membrane system comprised of DPPC, water, and DPH (see Fig. 1). The lipid bilayer of 128 DPPC molecules is surrounded by 3655 water molecules, corresponding to a fully hydrated lipid membrane. The molecular composition of the two leaflets is symmetric, the number of DPPC molecules in both leaflets being 64. As the bilayer is aligned to lie in the x,y plane, the bilayer normal is parallel to the z axis.
FIGURE 1.

Structures of (a) DPPC and (b) DPH molecules used in the present study. For DPH, partial charges used in 1DPH-qm and 3DPH-qm simulations are also shown in the figure.
Fluorescent DPH probes (see Fig. 1) were inserted randomly into the hydrophobic tail region of the bilayer without any attachment to lipid molecules. The DPH molecules are not linked to the hydrocarbon tails of lipids but they are treated as free probes. The concentration of DPH embedded in the membrane was chosen to range from 0.8 mol % (1:128) to 2.3 mol % (3:128), thus reflecting experimental conditions where the DPH/lipid ratio ranges typically from 1:500 to 1:100 (Kintanar et al., 1986; Mitchell and Litman, 1998). For comparison, an MD simulation of a pure DPPC bilayer was also performed.
Since the treatment of electrostatics is particularly important in lipid membrane systems (Patra et al., 2003, 2004), we paid considerable attention to this issue. Hence, for DPH, we employed two descriptions of partial charges. In the first case we considered no charges at all. In the second approach, charges were derived from ab initio quantum mechanical calculations using Gaussian98 (Frisch et al., 1998) with the Hartree-Fock method and 6-31G basis set. For details, see Repáková et al. (2004). As found elsewhere (Repáková et al., 2004), the two approaches provide results largely consistent with another, thus showing that the partial charge distribution of nonpolar probes embedded in the hydrophobic region of a membrane does not have significant influence on the system. To compute forces due to long-range electrostatic interactions, we used the particle-mesh Ewald technique (Essman et al., 1995).
The present description of DPPC is almost identical with the one discussed elsewhere (Falck et al., 2004; Patra et al., 2003, 2004). The only difference is the cutoff distance of Lennard-Jones interactions which, in our case, is 0.9 nm instead of the 1.0 nm used in previous works (Falck et al., 2004; Patra et al., 2003, 2004). Although this has a minor effect on the area per molecule, the conclusions with regard to DPH-induced effects are not affected.
All MD simulations were carried out using the GROMACS simulation package (Ver. 3.0) (Lindahl et al., 2001) under the conditions of constant pressure, constant temperature, and constant particle number (NpT ensemble). The temperatures of DPPC, DPH, and water molecules were set separately to 325 K, which is above the main phase transition temperature (Tm ≈ 314 K).
The goal of this work is to study the influence of DPH probes on the structure and dynamics of lipids in a DPPC bilayer. Although probes are expected to perturb the bilayer, the main question concerns the range and impact of these perturbations. Thus, when appropriate, we have evaluated not only global properties averaged over all lipid molecules in a bilayer, but also local quantities averaged over those few molecules in the vicinity of the probe. As a criterion to determine whether a given lipid molecule is close to the probe, we used the radial distribution function between the center-of-mass (CM) positions of DPPC and DPH molecules. The radial distribution function showed that the first minimum after the leading peak was at 0.5 nm. Consequently, if the distance between the CM positions of DPPC and DPH molecules was found to be <0.5 nm, they were considered to be close to each other, and hence nearest neighbors for which we calculated local properties. Although more precise estimates could certainly be developed, we feel that the present simple criterion serves its purpose well enough.
To summarize, in addition to the pure DPPC bilayer, we studied DPPC bilayers with two DPH concentrations (1:128 and 3:128) using two different sets of partial charges for DPH. The abbreviations for different DPH/DPPC systems discussed in the text are given in Table 1. In every case, the MD simulations were performed over a timescale of 100 ns. As shown in previous work (Repáková et al., 2004), the equilibration is completed in ∼10 ns, thus the remaining 90 ns of data is used here for analysis. In some cases where we analyze local quantities close to DPH, the results discussed below are presented as an average of all four simulations to reduce the noise in the data. On the basis of our previous study (Repáková et al., 2004), this approach is justified.
TABLE 1.
DPH/DPPC systems studied in the present work
| Number of DPH molecules | Description of DPH charges | Abbreviation |
|---|---|---|
| 0 | — | pure DPPC |
| 1 | None | 1DPH-0 |
| 1 | Quantum mechanical | 1DPH-qm |
| 3 | None | 3DPH-0 |
| 3 | Quantum mechanical | 3DPH-qm |
The only difference between the DPH systems is the description of partial charges: either without them, or using a description where partial charges were derived from ab initio calculations (see Fig. 1 and text for details). The abbreviation in the third column is used throughout in the discussion.
RESULTS AND DISCUSSION
To provide a thorough view of DPH-induced changes in the DPPC bilayer, we first discuss experimental data based on DSC and 2H NMR. Having done that, we look at the system from a different perspective and discuss the atomistic simulation results, which provide more insight into the local changes due to DPH.
Differential scanning calorimetry
Representative DSC upscans for pure DPPC and mixed DPPC/DPH are illustrated in Fig. 2, A and B. Neat DPPC showed three transitions, a subtransition at Ts = 16.81 ± 0.17°C, a pretransition at Tp = 35.00 ± 0.05°C, and a main transition at Tm = 41.31 ± 0.01°C, in agreement with previously published data (Silvius, 1982). Inclusion of DPH into DPPC multilamellar vesicles (MLVs) did not affect the shape of the main transition peak and no new peaks emerged as DPH was included into the MLVs (see Fig. 2 B). At 0.8 mol % (1:128) and 2.3 mol % (3:128), Ts increased marginally to 17.09 ± 0.67°C and 17.10 ± 0.34°C, respectively (Fig. 3). Likewise, Tp increased to 35.04 ± 0.05°C at 0.8 mol % DPH and 35.09 ± 0.01°C at 2.3 mol % DPH. For the main phase transition there was no change in Tm at 0.8 mol % DPH. Subsequently, a decrease in Tm was observed reaching 41.26 ± 0.01°C at 2.3 mol % DPH (Fig. 3). Simultaneously, increasing the concentration of DPH had no effect on the temperature width at half-maximum (Fig. 4). The enthalpy of the main phase transition peak decreased upon increasing the content of DPH (Fig. 4).
FIGURE 2.

Representative DSC upscans for DPPC/DPH multilamellar vesicles for the three DPH concentrations studied. Temperature is given in units of °C, and excess heat capacity in units of kcal/mol/°C. Results in A over a wide temperature range are better illustrated in B close to the main transition temperature.
FIGURE 3.

Results obtained from DSC measurements for the temperatures of the main phase transition (A), pretransition (B), and subtransition (C), denoted by Tm, Tp, and Ts, correspondingly. Temperatures are given in units of °C.
FIGURE 4.

The enthalpy (A) of the main phase transition in units of kcal/mol/°C, together with the half width at half-maximum (B) in units of °C.
The above results for DPH-induced effects are essentially in line with previous published data, although the observed changes due to the presence of DPH have been found to be minor and sometimes even opposite in the different studies (Lentz, 1993; Lentz et al., 1978; Yashar et al., 1987). For example, Lentz and co-workers found for DPPC dispersions through DSC that 0.2 mol % of DPH decreased Tm from 41.3°C to 40.8°C (Lentz, 1993; Lentz et al., 1978), whereas, in a DSC study by Ben Yashar et al. (1987), 1.5 mol % of DPH in MLVs lead to an increase from 41.69°C to 41.7°C. For comparison, 2 mol % of 1-palmitoyl-2-[4-(6-phenyl-trans-1,3,5-hexatrienyl)-phenyl]ethyl]carboxyl]3-sn-phosphatidylcholine decreased the main transition temperature by 0.1–0.2°C (Parente and Lentz, 1985). In any case, the very slight changes in the thermodynamic behavior close to transition temperatures are in favor of minor perturbing effects due to DPH.
In conclusion, including up to 2.3 mol % of DPH into DPPC MLVs has a surprisingly small effect on the thermotropic behavior of DPPC, with a slight decrease in Tm, increase in Tp, and decrease in the enthalpy of the main phase transition peak.
2H NMR
Deuterium NMR spectra of DPPC-d62 bilayers and DPPC-d62 bilayers containing 2.3 mol % DPH, acquired at selected temperatures from 46°C to 28°C, are shown in Fig. 5, A and B, respectively. For temperatures above 36°C, the spectra are superpositions of powder doublets characteristic of fast, axially symmetric chain motion in the liquid crystalline phase. The distribution of doublet splittings reflects the dependence of the orientational order parameter on position along the chain. The largest doublet splittings correspond to deuterons on chain segments nearest to the bilayer surface where amplitudes of chain motion are most constrained and chain order is highest.
FIGURE 5.
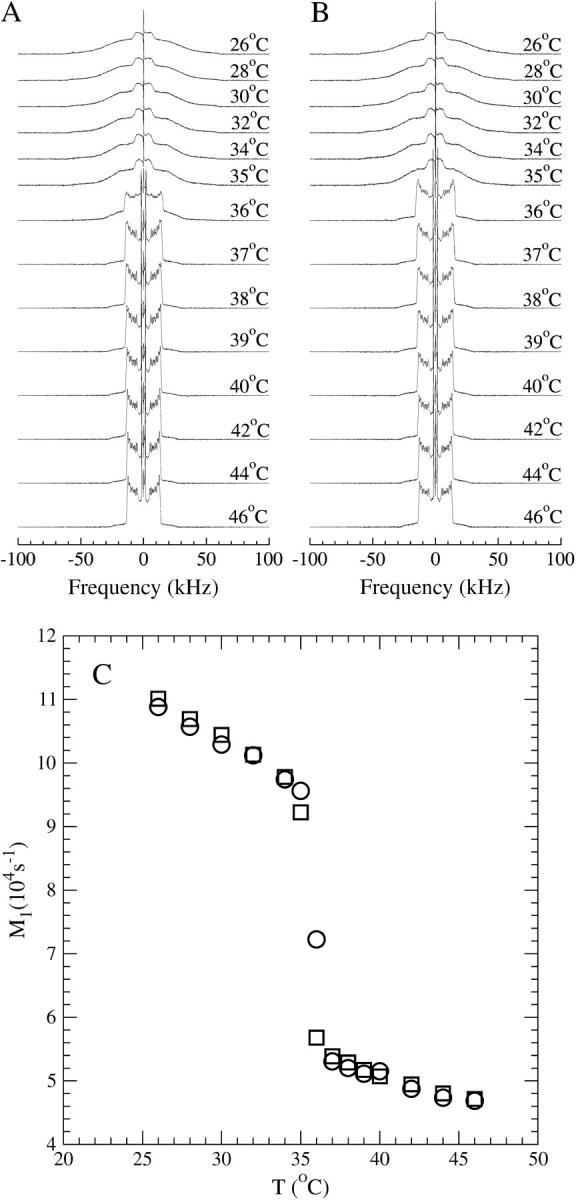
(A) Temperature dependence of 2H NMR spectra for bilayers of DPPC-d62. (B) Temperature dependence of 2H NMR spectra for bilayers of DPPC-d62 containing 2.3 mol % DPH. (C) Temperature dependence of first spectral moments for bilayers of DPPC-d62 (circles) and bilayers of DPPC-d62 containing 2.3 mol % DPH (squares).
Below 36°C, the bilayer is in the more ordered gel phase, and the spectra are characteristic of chains undergoing reorientation that are not axially symmetric on the ∼10−5 s timescale of the deuterium NMR experiment. The liquid crystal-to-gel transition temperature is lowered by per-deuteration of the DPPC-d62 chains. In line with the above DSC results, the effect of DPH is to reduce the transition temperature slightly further but the spectra for the two samples are otherwise very similar.
The first spectral moment, M1, is proportional to average chain orientational order. Fig. 5 C compares the temperature dependences of M1 for the two series of spectra. The 2H NMR spectra reflect averages of lipid chain orientational order over the ∼10−5 s timescale of the deuterium NMR experiment. For a lateral diffusion coefficient of ∼2 × 10⁻⁷ cm2/s, which is typical for pure fluid bilayers of saturated or monounsaturated lipids (Filippov et al., 2003), the area sampled by a diffusing lipid during the characteristic 2H NMR timescale is of the order of 1000 times the phospholipid headgroup area. Along with diffusion of the DPH itself, this ensures that any local perturbation of chain order by DPH will only be apparent as an average over the entire lipid population. Nevertheless, in the liquid crystalline phase, the first moments for the sample containing DPH are slightly higher than those for the sample containing DPPC-d62 alone.
Fig. 6 shows a more detailed comparison of spectra for the samples with and without DPH at 42°C. From the powder spectra in Fig. 6 A it is difficult to distinguish differences in splittings between the two samples. Fig. 6 B compares spectra that would be obtained for corresponding oriented samples. These are obtained by transforming the powder spectra using a de-Pake-ing algorithm (McCabe and Wassall, 1995). The right halves of each de-Paked spectrum are shown and vertical lines have been superimposed to aid in comparing the spectra. This comparison shows that splittings from the DPH-containing sample are slightly larger than corresponding splittings from the sample containing DPPC-d62 alone. Fig. 6 C shows corresponding plots of splitting, transformed to orientational order parameter, versus normalized integrated intensity for methylene deuterons in the two samples. Assuming a correspondence of integrated intensity with deuteron position along the chain, these plots provide a way to approximate orientational order parameter profiles without having to judge the partitioning of intensity between adjacent methylene groups. Comparison of the resulting profiles at 42°C suggests that any additional ordering of the chains by DPH is most apparent in the plateau region near the headgroup ends of the chains.
FIGURE 6.
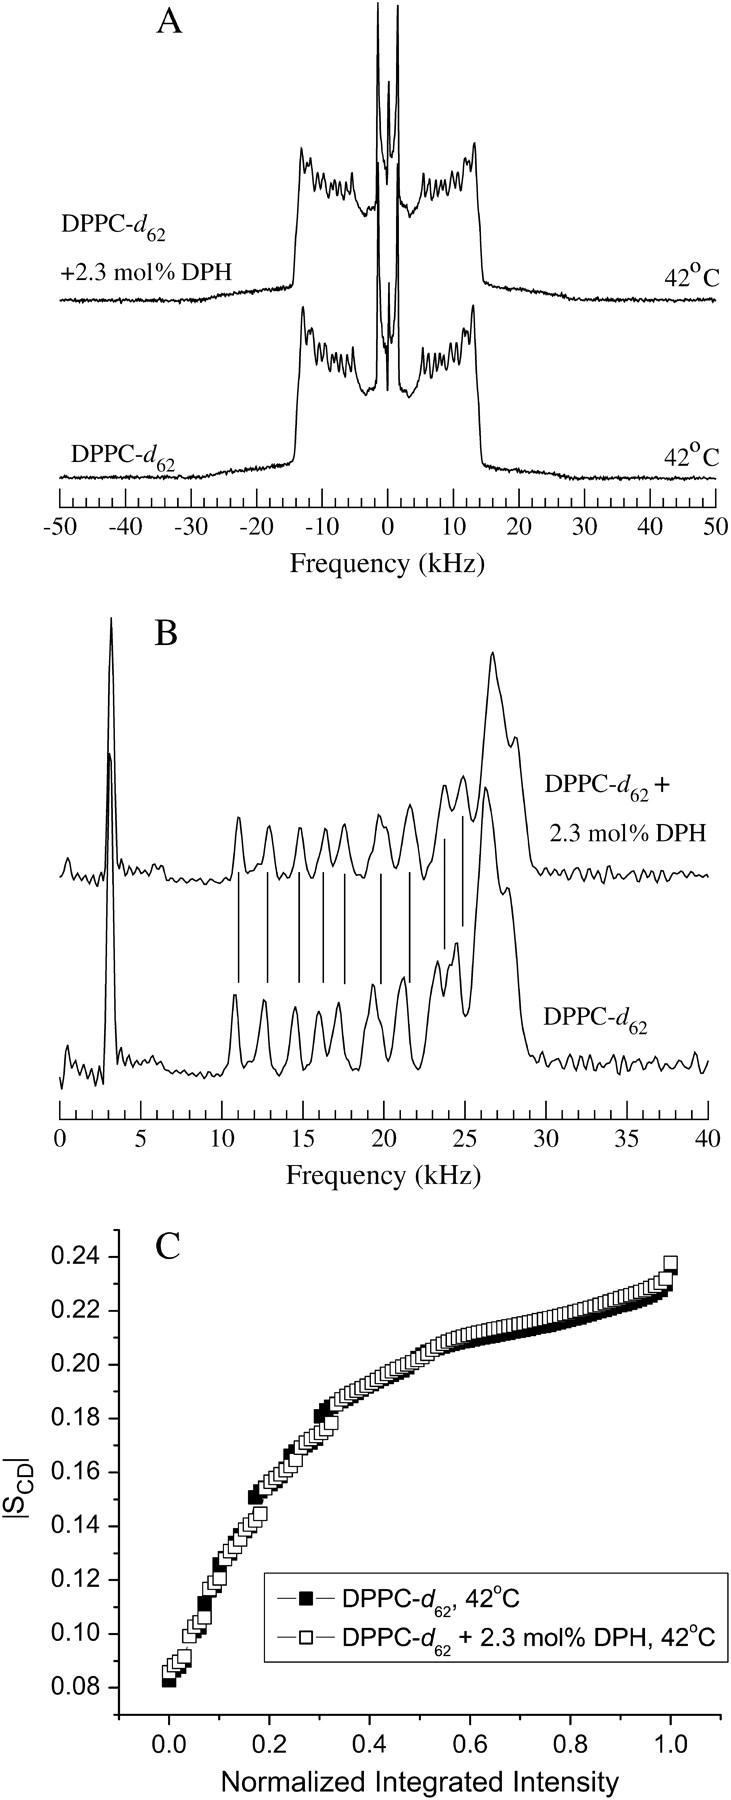
(A) Powder 2H NMR spectra at 42°C for bilayers of DPPC-d62 (lower) and bilayers of DPPC-d62 containing 2.3 mol % DPH (upper). (B) Right halves of de-Paked spectra at 42°C for bilayers of DPPC-d62 (lower) and bilayers of DPPC-d62 containing 2.3 mol % DPH (upper). Vertical lines are aligned with peaks for spectrum of the DPH-containing sample. (C) Orientational order parameter versus normalized integrated intensity across the methylene region of the de-Paked spectra for bilayers of DPPC-d62 (solid squares) and bilayers of DPPC-d62 containing 2.3 mol % DPH (open squares).
Order parameters through MD simulations
The above results have concerned experiments. From now on, we discuss the results and the view obtained through atomic-scale MD simulations.
Let us first discuss the deuterium order parameter SCD, which is one of the most common quantities measured from lipid membranes. Obtained from 2H NMR experiments, as above, it provides a measure of the average orientational order of the lipid hydrocarbon tails. In simulations, SCD is obtained via the order parameter tensor (Falck et al., 2004)
 |
(3) |
where α, β = x, y, z, and θα is the angle between the αth molecular axis and the bilayer normal (z axis). Due to symmetry, the relevant order parameter is the diagonal element Szz, which yields SCD = −Szz/2 (Falck et al., 2004). To allow comparison with experimental data, we present our results in terms of |SCD|.
The results for the order parameter |SCD| along the hydrocarbon chains are summarized in Fig. 7. As for the pure DPPC system, our results are in good agreement with experimental data obtained from deuterium NMR spectroscopy (Brown et al., 1979; Petrache et al., 2000) as well as with the results from previous simulations (Hofsäß et al., 2003, Patra et al., 2003).
FIGURE 7.

Orientational ordering of the sn-1 chain of DPPC illustrated by the deuterium order parameter |SCD|. Here, R is the distance from the CM of DPPC to the CM of nearest DPH molecule in the same leaflet. Error bars are largest at small R, ∼5%, and smallest (∼1%) for a pure DPPC system.
Concerning the influence of DPH, we consider how the distance from a probe affects the ordering of DPPC tails. To this end, we define R as a distance from the center of mass of a given DPPC molecule to the center of mass of a nearest DPH. Fig. 7 illustrates that there is a major ordering effect in the vicinity of DPH. We find that the lipids standing near DPH (R ≤ 1.0 nm) are substantially more ordered than the lipids in a pure DPPC bilayer. The increase is striking, since for the intermediate carbons in the middle of the hydrocarbon chains the increase in |SCD| due to DPH is of the order of 30–50%.
Further analysis reveals that the influence of DPH on acyl-chain ordering is suppressed rather rapidly as the distance from the probe is increased. This is demonstrated by the results depicted in Fig. 7. When R is between 1.0 and 1.5 nm, the excess ordering due to DPH is still substantial, but for R > 1.5 nm the perturbation is almost negligible. Clearly, the correlation length of perturbations induced by DPH is ∼1.5 nm. Roughly speaking, this range corresponds to two molecular diameters in the plane of the membrane.
When the order parameter is computed over all lipids in a system, we find that the effect of DPH is slight but notable. For intermediate carbons, the |SCD| values are ∼5% larger than corresponding values in a pure DPPC bilayer system (see Fig. 7), in line with the 2H NMR results discussed above.
To our knowledge, except for the results presented in this work, the influence of free DPH on |SCD| has not been characterized through experiments. However, recent studies of lipid-attached doxyl electron paramagnetic resonance spin labels have indicated that they increase the ordering of acyl chains. The increase is of the order of 10% and extends rather uniformly over the entire membrane leaflet where they are distributed (Vogel et al., 2003). On the other hand, the presence of NBD covalently attached to the sn-2 chains of phosphatidylcholine molecules has been found to decrease the ordering of acyl chains (Huster et al., 2001). The latter finding may be due to the distribution of NBD, which has a maximum in the membrane-water interface, characterized by a backfolding of the sn-2 chain toward the aqueous phase (Huster et al., 2003).
The above results highlight the fact that DPH does perturb the membrane. However, the perturbation is local rather than of long range. For comparison, it is interesting to observe that cholesterol has been reported to have similar local effects: for small cholesterol concentrations, atomic-scale simulations have shown that the |SCD| values of DPPC tails in the vicinity of cholesterol are increased by ∼50% compared to a pure lipid bilayer (E. Falck, M. Patra, M. Karttunen, M. T. Hyvönen, and I. Vattulainen, unpublished results; Jedlovszky and Mezei, 2003). As both DPH and cholesterol are relatively rigid molecules, both standing in the fluid phase approximately in the upright position along the membrane normal, the similarity of their influence is understandable. This idea is further supported by the fact that in the fluid phase cholesterol decreases 〈A〉, just like DPH (see below), and it also increases the thickness of the membrane (Falck et al., 2004; Hofsäß et al., 2003).
At first sight, it may appear that the MD simulation results are contradictory to the DSC results above. In general, an increase in the order parameter can be expected to increase Tm. However, this view is oversimplified since Tm reflects the cooperative melting of semicrystalline acyl-chain lattices. Though DPH increases the ordering of the acyl chains close to it, it certainly perturbs the packing of DPPC molecules resulting in a decrease in Tm. This effect is also observable as a decrease in enthalpy as DPH content is increased. Furthermore, it is intriguing to note that cholesterol, which has the well-known effect of increasing acyl-chain order above Tm, leads at small concentrations to a slight decrease in the apparent transition temperature (Lemmich et al., 1997; Vist and Davis, 1990).
Area per lipid based on Voronoi analysis
Another commonly measured quantity is the average area per lipid (Nagle and Tristam-Nagle, 2000). To compute the average area per DPPC, 〈A〉, we used the simulation data and divided the area in the x,y plane by the number of DPPC molecules in a single leaflet. The results shown in the second column of Table 2 indicate that DPH slightly decreases the average area per molecule. The effect is rather small, ∼2% for 3-DPH systems, but systematic.
TABLE 2.
Results for the average area per DPPC in units of nm2 based on the Voronoi analysis for all simulated systems
| System | 〈A〉 | R ≤ 1.0 nm | 1.0 nm < R ≤ 1.5 nm | 1.5 nm < R ≤ 2.0 nm | R > 2.0 nm |
|---|---|---|---|---|---|
| Pure DPPC | 0.691 ± 0.004 | — | — | — | — |
| 1DPH-0 | 0.681 ± 0.004 | 0.634 ± 0.024 | 0.647 ± 0.018 | 0.681 ± 0.011 | 0.683 ± 0.005 |
| 1DPH-qm | 0.683 ± 0.003 | 0.637 ± 0.048 | 0.659 ± 0.022 | 0.677 ± 0.010 | 0.684 ± 0.004 |
| 3DPH-0 | 0.676 ± 0.003 | 0.634 ± 0.018 | 0.662 ± 0.011 | 0.679 ± 0.010 | 0.679 ± 0.003 |
| 3DPH-qm | 0.676 ± 0.005 | 0.629 ± 0.022 | 0.654 ± 0.016 | 0.677 ± 0.010 | 0.678 ± 0.005 |
In the second column for 〈A〉, all DPPC molecules in the system are taken into account. In the third through sixth columns, the average area per DPPC is given for a fraction of lipids in a system, as a function of R which is the distance from the center of mass of DPPC to the center of mass of nearest DPH.
To further clarify the role of DPH, we calculated how the area per DPPC depends on its distance from nearest DPH in the same leaflet, R. To this end, we used Voronoi tessellation in two dimensions (Patra et al., 2004; Shinoda and Okazaki, 1998). In this technique, the CM positions of the molecules (separately for the two leaflets) are first projected onto the x,y plane. The Voronoi tessellation then yields the area that is closer to a given molecule than to any other one. In this manner, for every frame, we first determined the Voronoi cells of DPH molecules (see Fig. 8). Then, we carried out Voronoi tessellation to determine the Voronoi cells of DPPC molecules, disregarding the presence of DPH. To avoid situations where Voronoi cells of DPPCs would include contributions from both DPPC and DPH, we discarded from the analysis those lipids whose Voronoi cells were overlapped by the Voronoi cell of DPH (see Fig. 8). This approach allows us to find the dependence of the area per DPPC as a function of its distance from the probe.
FIGURE 8.

Voronoi tessellation for DPH and DPPC molecules in a single leaflet. The small solid circle in the middle corresponds to the location of DPH, whose Voronoi cell is shown with dashed lines. Large solid circles around DPH correspond to the locations of DPPCs whose Voronoi cells overlap the cell of DPH, and open circles characterize the positions of other DPPCs. See text for details.
As is evident from Fig. 9, DPPC molecules in the vicinity of DPH require less space in the membrane plane than DPPC molecules far from DPH. For an increasing distance R, the area per DPPC increases monotonously and approaches the average value found in a given bilayer, 〈A〉. The results shown in Table 2 confirm this finding. This condensing effect is consistent with the above results for acyl-chain ordering (see Fig. 7).
FIGURE 9.

Probability distribution P(A) for the area per DPPC as a function of R, which is the distance from the center of mass of DPPC to the center of mass of nearest DPH in the same leaflet. The results were obtained by the Voronoi analysis. The distributions have been obtained by averaging over the four different simulations. The curves for R ∈ [1.5, 2.0] nm and R > 2.0 nm are essentially identical.
Despite its local role, DPH leads to a decrease in the average area per lipid, 〈A〉 (see Table 2). The larger the DPH concentration, the larger is the reduction in the average area per lipid. This observation seems to be correlated with an increase of the bilayer thickness (see below) and further with an increase of the average 2H NMR order parameter discussed above.
Mass density profiles
To study the influence of DPH on the distribution of different molecular components in a bilayer, we computed the mass density profiles for a number of molecular species and lipid atoms. Since the bilayer center of mass (CM) may fluctuate in time, for each frame of the simulation we first determined the CM position of the bilayer in the z direction. The positions of all atoms were then calculated with respect to the instantaneous CM location of the membrane. Using the symmetry of the bilayer, the final mass density profiles were obtained by averaging over the two leaflets.
The mass density profiles for several bilayer components are depicted in Fig. 10. As for DPH, Fig. 10 shows that DPH is incorporated in the hydrophobic region of the lipid bilayer, such that its center of mass is approximately in the middle of the hydrocarbon tails. As shown and discussed elsewhere (Repáková et al., 2004), DPH is further oriented such that its principal axis is to a large degree along the membrane-normal direction. The interplay of these two factors leads to an enhanced ordering of DPPC tails (discussed above), which implies that DPH slightly increases the thickness of the bilayer. This is most evident when one looks at the point where the mass densities of lipid and water molecules match, and uses that as a criterion for the thickness of the membrane, d. We find that d = 3.98 nm in a pure DPPC bilayer, 4.04 nm in a 1-DPH system, and 4.07 nm in the 3-DPH system. The thickness of the membrane therefore increases for an increasing DPH concentration. Since mass density profiles can be determined through diffraction measurements, experimental studies of this aspect would be welcome.
FIGURE 10.

Mass density profiles of different molecular components across the bilayer. The point z = 0 corresponds to the center of the bilayer. The profiles of phosphorous and nitrogen atoms have been multiplied by a factor of 2.5 and 3, respectively, and the profiles of DPH (for its CM) have been multiplied by 30. The profiles of 1DPH-0 and 3DPH-0 were essentially similar to those of 1DPH-qm and 3DPH-qm, in respective order.
Electrostatic potential and orientation effects close to the membrane-water interface
To gauge the influence of DPH on electrostatic properties, we used the simulation data to compute several quantities related to this issue.
Calculations of the electrostatic profile across the bilayer system indicated that DPH has a negligible role in this quantity. For a pure DPPC system, the total electrostatic potential was found to be −550 mV, in agreement with previous experimental and simulation studies (Patra et al., 2003, and discussion therein). When DPH was embedded in a bilayer, the total electrostatic potential was slightly reduced, but the effect was essentially within error bars (data not shown).
Water molecules hydrating lipids are essential for the functioning of biological membranes. Therefore, we next considered the influence of DPH on the ordering of water molecules close to the membrane-water interface. (For details of the calculation, see Patra et al., 2003.) We found that the DPH probe has a marginal effect on the ordering of water in the membrane-water interface. The profiles characterizing the average orientation of a water dipole with respect to the membrane normal are slightly shifted toward the water phase because of the thickening of the bilayer, but overall the ordering behavior did not change.
To examine whether the DPH probe influences the arrangement of lipid headgroups, we considered the probability distribution of the dipole vector, P(θ). Here θ is the angle between the P–N vector (from the phosphorous to the nitrogen atom in the headgroup, see Fig. 1) and the bilayer normal pointing out of the membrane. When the distribution was calculated over all lipids in a system, we found the effect due to DPH to be very minor. However, when the P–N vector distribution was computed over those molecules close to DPH, we found that DPH does have an effect (see Fig. 11). Although the P–N vector in a pure DPPC system is oriented on the average almost in parallel to the bilayer surface, the distribution of the P–N vector in a DPH/DPPC system is even more peaked along the membrane surface direction, and pointing slightly to the membrane interior. The average angles found were 〈θ〉 = 78.2° in a pure DPPC system, and 80.7° in the DPH/DPPC systems.
FIGURE 11.

Probability distribution P(θ) of the angle between the P–N vector in a DPPC headgroup and the bilayer normal. When θ = 0, the P–N vector points out of the bilayer along the membrane-normal direction. The full curve corresponds to a pure DPPC bilayer. The dotted curve provides the data for lipids close to DPH for which R ≤ 0.5 nm. In that case, to reduce noise in the data, profiles for DPPCs close to DPH have been averaged over the four simulations.
On the basis of the above, it seems evident that DPH, and other nonpolar probes embedded in the hydrophobic region of membranes, do not have direct and significant influence on membrane properties close to the membrane-water interface. Local effects do exist close to DPH, as we found in the case of the P–N vector distribution, but the range of perturbations induced by the probe is short.
Influence of DPH on the lateral and rotational diffusion of DPPC molecules
Lateral diffusion plays a key role in a variety of dynamic membrane processes. To characterize the influence of DPH on that aspect in membranes, we calculated the lateral diffusion coefficient DL of DPPC molecules using the Einstein relation
 |
(4) |
where the mean-squared displacement (MSD) is defined as
 |
(5) |
The average is over a given set of M molecules and all initial time origins t0, and  is the center-of-mass position of lipid i at time t.
From the MSD profiles of DPPC molecules calculated up to 50 ns (data not shown) we obtain the lateral diffusion coefficient DL = 1.6 × 10⁻⁷ cm2/s. This value is consistent with previous diffusion studies (Hofsäß et al., 2003; Lindahl and Edholm, 2001), but not comparable to DPH/DPPC bilayers, since DPH molecules are mobile, too, and the timescale during which a pair of DPH and DPPC molecules remains close to one another is limited to a few nanoseconds. For that reason, we compare the mean-squared displacements only at short times, up to 1 ns. Fig. 12 depicts how the MSD of DPPC molecules behaves in the two cases. We find that the lateral motion of DPPC molecules close to DPH is slowed down considerably with respect to lipids in a pure DPPC bilayer. On one hand, this is due to attractive DPPC/DPH interactions, and, on the other hand, due to the reduced free volume caused by the presence of DPH. As a consequence, we find a value of DL ≈ 10 × 10−7 cm2/s in a pure DPPC system for times 0.5–1.0 ns, and a lateral diffusion coefficient DL ≈ 6 × 10⁻⁷ cm2/s for DPPC molecules close to DPH.
FIGURE 12.

Results for the mean-squared displacement of DPPC molecules close to DPH (R ≤ 0.5 nm) at short times (averaged over the four simulated systems), and corresponding results for a pure DPPC bilayer.
To close this work, we looked into the rotational motion of lipids. To this end, we employed the correlation function  where
where  is a vector of unit length at time t (see below). At long times, one expects exponential decay CR(t) − CR(t → ∞) ∼ exp(−t/τR), thus yielding a characteristic timescale of rotational motion, τR.
To characterize rotational motion in different parts of the system, we chose  in two different ways: the P–N vector in a DPPC headgroup, and the sn-1 and sn-2 chains drawn from carbon C2 to C15 in the acyl chains (see Fig. 1). When the correlation functions were computed over all lipids in a system, we found strongest effects in the case of the P–N vector. Then, DPH increased τR by ∼10%, indicating a longer relaxation time and reduced rotational diffusion rate. For the sn-1 and sn-2 chains, the effects were weaker. Due to limited statistics, a more detailed analysis for lipids in the vicinity of DPH was not possible.
CONCLUDING REMARKS
For decades, fluorescent probes and lipid derivatives have been applied in membrane biophysics and cell biology to provide insight into the structure and dynamics of biomolecular systems. Despite a wide range of experimental studies, however, one of the main problems regarding fluorescent probes has remained an open issue: namely, what is the influence of probes on the properties of the system studied?
In this work, we have addressed this problem through a combination of atomistic molecular dynamics simulations, DSC, and 2H NMR experiments for systems comprised of free DPH probes in a DPPC bilayer. The above discussed MD simulations suggest DPH to favor the hydrophobic region in the middle of the hydrocarbon chains. Further, since DPH aligns itself such that its principal axis lies approximately in the direction of the membrane normal (Repáková et al., 2004), the resulting coupling of DPH with neighboring lipid molecules leads to pronounced DPH-induced effects in the vicinity of a probe. These perturbations near DPH in the hydrocarbon region of a membrane are manifested as, e.g., enhanced ordering of lipid hydrocarbon tails and a reduced lateral diffusion rate. The increased ordering of acyl chains in the vicinity of DPH, in turn, leads to an increased thickness of the bilayer and to a slight decrease in the average area per lipid.
The above discussed MD simulations suggest that the perturbations induced by free DPH are of local nature. Major changes in the large-scale properties of the bilayer are therefore not expected. This conclusion is supported by the present DSC and 2H NMR measurements. Close to the main phase transition temperature, DSC experiments indicate that the probe disturbs the packing of pseudo-hexagonal acyl chain organization of DPPC, evidenced by a small decrease in Tm as well as enthalpy. The cooperativity of this melting remains, however, unchanged. 2H NMR measurements carried out over a wide temperature range, in turn, indicate that DPH gives rise to changes in the membrane properties but the effects are small. First, the results are in favor of a conclusion that there is a minor shift in the transition temperature due to DPH, in line with DSC experiments. Second, the 2H NMR results support the view that the ordering of lipid acyl chains is slightly enhanced due to DPH, in agreement with MD simulations.
When the above pieces of information are combined, the MD simulations and experiments allow us to conclude that free DPH leads to pronounced changes in membrane structure and dynamics in the vicinity of the probe. The changes are of local nature, however, since the average effect on lipid chain ordering and thermotropic behavior is small.
Being a rigid and neutral probe accommodated in the hydrophobic acyl chain region of a membrane, DPH has certain similarities to other probes also commonly used in membrane studies. For example, both pyrene and trans-PA are also rigid and neutral, favoring the hydrocarbon core rather than the membrane-water interface. One is therefore tempted to assume that the perturbations due to pyrene and trans-PA could be very similar to those we observed for DPH. However, it is possible that the interpretation is not so straightforward. First, it has been observed that trans-PA favors a location in ordered domains of a membrane bilayer, whereas DPH is commonly considered to partition equally between ordered and disordered regions of a membrane. Presumably, the smaller cross-sectional area of trans-PA may play a role here. As for pyrene, in turn, its cross-sectional area is considerably larger than that of DPH, which suggests local perturbations due to pyrene may be more significant. However, since the location of free pyrene in membranes is not rigorously established (Martins and Melo, 2001), even this simple assumption is suspect. Nevertheless, what we can note rather safely at the moment is that free hydrophobic probes in the fluid-state give rise to local rather than long-range perturbations in membranes.
The above two examples highlight how little we actually know about the detailed atomic-scale mechanisms of free probes influencing the structure and dynamics of membrane systems. Yet these are the simplest cases to be understood, i.e., rigid hydrophobic probes embedded in the acyl chain region. The scenario is considerably more complicated when charged (free) probes such as trimethylamino-diphenylhexatriene are in place. In that case the probe-induced effects, in general, are expected to be more significant since the probes are located at the headgroup region, thus disturbing the membrane-water interface both sterically and through electrostatics via long-range interactions. Finally, recalling that probe-labeled lipids are a widely applied tool to explore phenomena such as lipid trafficking and membrane fusion (Somerharju, 2002), there is reason to emphasize the importance to further our understanding of the properties of probe-labeled lipids, and their influence on the surrounding membrane in atomic detail.
Acknowledgments
We thank Prof. Paavo Kinnunen for generous use of his DSC equipment, and June Stewart for preparation of samples examined by deuterium NMR.
This work has, in part, been supported by the Academy of Finland through its Center of Excellence Program (to I.V.), the Academy of Finland grants 204862 (to J.R.) and 80246 (to I.V.), and the Natural Sciences and Engineering Research Council (Canada) (to M.R.M.). J.M.H. is supported by grants from the Finnish Eye and Tissue Bank Foundation and the Finnish Eye Foundation. The Finnish IT Center for Science and the HorseShoe (DCSC) supercluster computing facility at the University of Southern Denmark are thanked for computer resources.
References
- Abrams, F. S., and E. London. 1993. Extension of the parallax analysis of membrane penetration depth to the polar region of model membranes: use of fluorescence quenching by a spin-label attached to the phospholipid polar headgroup. Biochemistry. 32:10826–10831. [DOI] [PubMed] [Google Scholar]
- Bloom, M., E. Evans, and O. G. Mouritsen. 1991. Physical properties of the fluid lipid-bilayer component of cell membranes: a perspective. Q. Rev. Biophys. 24:293–397. [DOI] [PubMed] [Google Scholar]
- Brown, A., I. Skanes, and M. R. Morrow. 2004. Pressure-induced ordering in mixed-lipid bilayers. Phys. Rev. E. 69:011913-1–011913-9. [DOI] [PubMed] [Google Scholar]
- Brown, M. F., J. Seelig, and U. Häberlen. 1979. Structural dynamics in phospholipid bilayers from deuterium spin-lattice relaxation time measurements. J. Chem. Phys. 70:5045–5053. [Google Scholar]
- Cascales, J. J. L., M. L. Huertas, and J. G. de la Torre. 1997. Molecular dynamics simulation of a dye molecule in the interior of a bilayer: 1,6,diphenyl-1,3,5-hexatriene in dipalmitoylphosphatidylcholine. Biophys. Chem. 69:1–8. [DOI] [PubMed] [Google Scholar]
- Chattopadhyay, A. 1990. Chemistry and biology of n-(7-nitrobenz-2-oxa-1,3-diazol-4-yl)-labeled lipids: fluorescent probes of biological and model membranes. Chem. Phys. Lipids. 53:1–15. [DOI] [PubMed] [Google Scholar]
- Chattopadhyay, A., and E. London. 1987. Parallax method for direct measurement of membrane penetration depth utilizing fluorescence quenching by spin-labeled phospholipids. Biochemistry. 26:39–45. [DOI] [PubMed] [Google Scholar]
- Davis, J. H., K. R. Jeffrey, M. Bloom, M. I. Valic, and T. P. Higgs. 1976. Quadrupolar echo deuteron magnetic resonance spectroscopy in ordered hydrocarbon chains. Chem. Phys. Lett. 42:390–394. [Google Scholar]
- Epand, R. F., R. Kraayenhof, G. J. Sterk, H. W. W. F. Sang, and R. M. Epand. 1996. Fluorescent probes of membrane surface properties. Biochim. Biophys. Acta. 1284:191–195. [DOI] [PubMed] [Google Scholar]
- Essman, U., L. Perera, M. L. Berkowitz, T. Darden, H. Lee, and L. G. Pedersen. 1995. A smooth particle mesh Ewald method. J. Chem. Phys. 103:8577–8593. [Google Scholar]
- Falck, E., M. Patra, M. Karttunen, M. T. Hyvönen, and I. Vattulainen. 2004. Lessons of slicing membranes: interplay of packing, free area, and lateral diffusion in phospholipid/cholesterol bilayers. Biophys. J. 87:1076–1091. [DOI] [PMC free article] [PubMed] [Google Scholar]
- Feller, S. E. 2000. Molecular dynamics simulations of lipid bilayers. Curr. Opinion Colloid Interface Sci. 5:217–223. [Google Scholar]
- Filippov, A., G. Orädd, and G. Lindblom. 2003. The effect of cholesterol on the lateral diffusion of phospholipids in oriented bilayers. Biophys. J. 84:3079–3086. [DOI] [PMC free article] [PubMed] [Google Scholar]
- M. J. Frisch, G. W. Trucks, H. B. Schlegel, G. E. Scuseria, M. A. Robb, J. R. Cheeseman, V. G. Zakrzewski, J. A. Montgomery, Jr., R. E. Stratmann, J. C. Burant, S. Dapprich, J. M. Millam, A. D. Daniels, K. N. Kudin, M. C. Strain, O. Farkas, J. Tomasi, V. Barone, M. Cossi, R. Cammi, B. Mennucci, C. Pomelli, C. Adamo, S. Clifford, J. Ochterski, G. A. Petersson, P. Y. Ayala, Q. Cui, K. Morokuma, D. K. Malick, A. D. Rabuck, K. Raghavachari, J. B. Foresman, J. Cioslowski, J. V. Ortiz, B. B. Stefanov, G. Liu, A. Liashenko, P. Piskorz, I. Komaromi, R. Gomperts, R. L. Martin, D. J. Fox, T. Keith, M. A. Al-Laham, C. Y. Peng, A. Nanayakkara, C. Gonzalez, M. Challacombe, P. M. W. Gill, B. Johnson, W. Chen, M. W. Wong, J. L. Andres, C. Gonzalez, M. Head-Gordon, E. S. Replogle, and J. A. Pople. 1998. Gaussian 98, Rev. A.6. Gaussian Inc., Pittsburgh, PA.
- Gennis, R. B. 1989. Biomembranes: Molecular Structure and Function. Springer-Verlag, New York.
- Hofsäß, C., E. Lindahl, and O. Edholm. 2003. Molecular dynamics simulations of phospholipid bilayers with cholesterol. Biophys. J. 84:2192–2206. [DOI] [PMC free article] [PubMed] [Google Scholar]
- Holopainen, J. M., M. Subramanian, and P. K. J. Kinnunen. 1998. Sphingomyelinase induces lipid microdomain formation in a fluid phosphatidylcholine/sphingomyelin membrane. Biochemistry. 37:17562–17570. [DOI] [PubMed] [Google Scholar]
- Huster, D., P. Müller, K. Arnold, and A. Herrmann. 2001. Dynamics of membrane penetration of the fluorescent 7-nitrobenz-2-oxa-1,3-diazol-4-yl (NBD) group attached to an acyl chain of phosphatidylcholine. Biophys. J. 80:822–831. [DOI] [PMC free article] [PubMed] [Google Scholar]
- Huster, D., P. Müller, K. Arnold, and A. Herrmann. 2003. Dynamics of lipid chain attached fluorophore 7-nitrobenz-2-oxa-1,3-diazol-4-yl (NBD) in negatively charged membranes determined by NMR spectroscopy. Eur. Biophys. J. 32:47–54. [DOI] [PubMed] [Google Scholar]
- Jedlovszky, P., and M. Mezei. 2003. Effect of cholesterol on the properties of phospholipid membranes. 1. Structural features. J. Phys. Chem. B. 107:5311–5321. [DOI] [PubMed] [Google Scholar]
- Katsaras, J., and T. Gutberlet, editors. 2001. Lipid Bilayers: Structure and Interactions. Springer-Verlag, Berlin, Germany.
- Kintanar, A., A. C. Kunwar, and E. Oldfield. 1986. Deuterium nuclear magnetic resonance spectroscopic study of the fluorescent probe diphenylhexatriene in model membrane systems. Biochemistry. 25:6517–6524. [DOI] [PubMed] [Google Scholar]
- Koivusalo, M., J. Alvesalo, J. A. Virtanen, and P. Somerharju. 2004. Partitioning of pyrene-labeled phospho- and sphingolipids between ordered and disordered bilayer domains. Biophys. J. 86:923–935. [DOI] [PMC free article] [PubMed] [Google Scholar]
- Krasnowska, E. K., E. Gratton, and T. Parasassi. 1998. Prodan as a membrane surface fluorescence probe: partitioning between water and phospholipid phases. Biophys. J. 74:1984–1993. [DOI] [PMC free article] [PubMed] [Google Scholar]
- Lakowicz, J. R. 1983. Principles of Fluorescence Spectroscopy. Plenum Press, New York.
- Lemmich, J., K. Mortensen, J. H. Ipsen, T. Hœnger, R. Bauer, and O. G. Mouritsen. 1997. The effect of cholesterol in small amounts on lipid-bilayer softness in the region of the main phase transition. Eur. Biophys. J. 25:293–304. [DOI] [PubMed] [Google Scholar]
- Lentz, B. R. 1989. Membrane “fluidity” as detected by diphenylhexatriene probes. Chem. Phys. Lipids. 50:171–190. [Google Scholar]
- Lentz, B. R. 1993. Use of fluorescent probes to monitor molecular order and motions within liposome bilayers. Chem. Phys. Lipids. 64:99–116. [DOI] [PubMed] [Google Scholar]
- Lentz, B. R., E. Freire, and R. L. Biltonen. 1978. Fluorescence and calorimetric studies of phase transitions in phosphatidylcholine multilayers: kinetics of the pretransition. Biochemistry. 17:4475–4480. [DOI] [PubMed] [Google Scholar]
- Leonard-Latour, M., R. M. Morelis, and P. R. Coulet. 1996. Influence of pyrene-based fluorescent probes on the characteristics of DMPA/DMPC Langmuir-Blodgett films. Langmuir. 12:4797–4802. [Google Scholar]
- Lindahl, E., and O. Edholm. 2001. Molecular dynamics simulation of NMR relaxation rates and slow dynamics in lipid bilayers. J. Chem. Phys. 115:4938–4950. [Google Scholar]
- Lindahl, E., B. Hess, and D. van der Spoel. 2001. GROMACS 3.0: a package for molecular simulation and trajectory analysis. J. Mol. Modeling. 7:306–317. [Google Scholar]
- Lipowsky, R., and E. Sackmann, editors. 1995. Structure and Dynamics of Membranes: From Cells to Vesicles. Elsevier, Amsterdam, The Netherlands.
- Maier, O., V. Oberle, and D. Hoekstra. 2002. Fluorescent lipid probes: some properties and applications. Chem. Phys. Lipids. 116:3–18. [DOI] [PubMed] [Google Scholar]
- Martins, J., and E. Melo. 2001. Molecular mechanism of lateral diffusion of py10-PC and free pyrene in fluid DMPC bilayers. Biophys. J. 80:832–840. [DOI] [PMC free article] [PubMed] [Google Scholar]
- Mayor, S., and M. Rao. 2004. Rafts: scale-dependent, active lipid organization at the cell surface. Traffic. 5:231–240. [DOI] [PubMed] [Google Scholar]
- McCabe, M. A., and S. R. Wassall. 1995. Fast-Fourier-transform dePaking. J. Magn. Reson. B. 106:80–82. [Google Scholar]
- Mitchell, D. C., and B. J. Litman. 1998. Molecular order and dynamics in bilayers consisting of highly polyunsaturated phospholipids. Biophys. J. 74:879–891. [DOI] [PMC free article] [PubMed] [Google Scholar]
- Nagle, J. F., and S. Tristam-Nagle. 2000. Structure of lipid bilayers. Biochim. Biophys. Acta. 1469:159–195. [DOI] [PMC free article] [PubMed] [Google Scholar]
- Parente, R. A., and B. R. Lentz. 1985. Advantages and limitations of 1-palmitoyl-2-[[2-[4-(6-phenyl-trans-1,3,5-hexatrienyl)phenyl] ethyl]carbonyl]-3-sn-phosphatidylcholine as a fluorescent membrane probe. Biochemistry. 24:6178–6185. [DOI] [PubMed] [Google Scholar]
- Patra, M., M. Karttunen, M. T. Hyvönen, E. Falck, P. Lindqvist, and I. Vattulainen. 2003. Molecular dynamics simulations of lipid bilayers: major artifacts due to truncating electrostatic interactions. Biophys. J. 84:3636–3645. [DOI] [PMC free article] [PubMed] [Google Scholar]
- Patra, M., M. Karttunen, M. T. Hyvönen, E. Falck, and I. Vattulainen. 2004. Lipid bilayers driven to a wrong lane in molecular dynamics simulations by subtle changes in long-range electrostatic interactions. J. Phys. Chem. B. 108:4485–4494. [Google Scholar]
- Petrache, H. I., S. W. Dodd, and M. F. Brown. 2000. Area per lipid and acyl length distributions in fluid phosphatidylcholines determined by 2H NMR spectroscopy. Biophys. J. 79:3172–3192. [DOI] [PMC free article] [PubMed] [Google Scholar]
- Prosser, R. S., J. H. Davis, F. W. Dahlquist, and M. A. Lindorfer. 1991. Deuterium nuclear magnetic resonance of the gramicidin A backbone in a phospholipid bilayer. Biochemistry. 30:4687–4696. [DOI] [PubMed] [Google Scholar]
- Repáková, J., P. Čapková, J. M. Holopainen, and I. Vattulainen. 2004. Distribution, orientation, and dynamics of DPH probes in DPPC bilayer. J. Phys. Chem. B. 108:13438–13448. [Google Scholar]
- Saiz, L., and M. L. Klein. 2002. Computer simulation studies of model biological membranes. Acc. Chem. Res. 35:482–489. [DOI] [PubMed] [Google Scholar]
- Scott, H. L. 2002. Modeling the lipid component of membranes. Curr. Opin. Struct. Biol. 12:495–502. [DOI] [PubMed] [Google Scholar]
- Shinoda, W., and S. Okazaki. 1998. A Voronoi analysis of lipid area fluctuation in a bilayer. J. Chem. Phys. 109:1517–1521. [Google Scholar]
- Silvius, J. R. 1982. Thermotropic phase transitions of pure lipids in model membranes and their modifications by membrane proteins. In Lipid-Protein Interactions, Vol. 2. P.C. Jost and O.H. Griffith, editors. John Wiley and Sons, New York. 239–281.
- Simons, K., and E. Ikonen. 1997. Functional rafts in cell membranes. Nature. 387:569–571. [DOI] [PubMed] [Google Scholar]
- Somerharju, P. 2002. Pyrene-labeled lipids as tools in membrane biophysics and cell biology. Chem. Phys. Lipids. 116:57–74. [DOI] [PubMed] [Google Scholar]
- Somerharju, P. J., J. A. Virtanen, K. K. Eklund, P. Vainio, and P. K. J. Kinnunen. 1985. 1-palmitoyl-2-pyrenedecanoyl glycerophospholipids as membrane probes: evidence for regular distribution in liquid-crystalline phosphatidylcholine bilayers. Biochemistry. 24:2773–2781. [DOI] [PubMed] [Google Scholar]
- van der Heide, U. A., and Y. K. Levine. 1994. A computer simulation study of the relation between lipid and probe behaviour in bilayer systems. Biochim. Biophys. Acta. 1195:1–10. [DOI] [PubMed] [Google Scholar]
- Vattulainen, I., and M. Karttunen. 2005. Modeling of biologically motivated soft matter systems. In Computational Nanotechnology. M. Rieth and W. Schommers, editors. American Scientific Press, Stevenson Ranch, CA.
- Vist, M. R., and J. H. Davis. 1990. Phase equilibria of cholesterol/dipalmitoylphosphatidylcholine mixtures: 2H nuclear magnetic resonance and differential scanning calorimetry. Biochemistry. 29:451–464. [DOI] [PubMed] [Google Scholar]
- Vogel, A., H. A. Scheidt, and D. Huster. 2003. The distribution of lipid attached spin probes in bilayers: application to membrane protein topology. Biophys. J. 85:1691–1701. [DOI] [PMC free article] [PubMed] [Google Scholar]
- Yashar, V. B., M. Menashe, R. L. Biltonen, M. L. Johnson, and Y. Barenholz. 1987. Interaction of trans-parinaric acid with phosphatidylcholine bilayers: comparison with the effect of other fluorophores. Biochim. Biophys. Acta. 904:117–124. [DOI] [PubMed] [Google Scholar]