Abstract
Three- and five-quantum absorption and dispersion multiquantum electron paramagnetic resonance spectra of a spin-labeled protein have been obtained for the first time at Q-band (35 GHz). Spectra of arrestin spin-labeled at site 267 were recorded at room temperature as a function of microwave power. The separation of irradiating microwave frequencies, Δf, was 10 kHz, and a newly-designed multiquantum Q-band electron paramagnetic resonance bridge was utilized, operating in a superheterodyne detection mode. The sample volume was 30 nL using a 3-loop–2-gap resonator. Most spectra were obtained at a 300 μM concentration in single, 2-min scans, but spectra were also successfully obtained at 30 μM, corresponding to one picomole of protein. Enhanced sensitivity to T1 and T2 was evident in the spectra, and linewidths varied considerably across the spectra. The pure absorption displays are beneficial relative to field modulation methods for spectral characterization. The presence of two states of the nitroxide spin-label with different relaxation times is evident, particularly in the dispersion spectra, which are expected to exhibit enhanced sensitivity to lineshape variation relative to absorption. Feasibility has been established for the use of this technique for site-directed spin-labeling studies of biologically relevant samples, particularly the study of protein structure and dynamics.
INTRODUCTION
Irradiation of a homogeneous electron paramagnetic resonance (EPR) transition by two closely spaced microwave sources of equal intensity and a common time-base generates new microwave frequencies, termed intermodulation sidebands, when the resonance condition is satisfied. An odd number of quanta are involved in this process, with one more quantum absorbed than emitted, which leads to the nomenclature multiquantum EPR spectroscopy. A third microwave reference frequency on the same time-base is used for detection of the intermodulation sidebands. The first experimental detection of intermodulation sidebands (Sczaniecki et al., 1991) and the theoretical basis (Mchaourab and Hyde, 1993) at X-band were reported more than 10 years ago. The initial motivation for development of MQ EPR was to provide an alternative to field modulation that allowed collection of pure absorption and dispersion spectra. However, multiquantum (MQ) provides a spectral display that is proportional to the relaxation parameters  for three-quantum (3Q) and
  for five-quantum (5Q) spectra (Mchaourab and Hyde, 1993). The direct T1-dependent signal intensity is a novel and valuable benefit of MQ spectroscopy. In addition, the dependence on
  or
or  rather than on T2 as observed in single-quantum EPR, make the MQ spectra especially sensitive to changes in this parameter. Because of the signal dependence on these relaxation parameters, there is a great potential for spectral editing of multiple component spectra and straightforward saturation of specific spectral components. The advantages of Q-band MQ over X-band MQ are the much smaller samples sizes and the longer T1 values (Hyde et al., 2004), both of which lead to more signal for less sample. In addition, Q-band is expected to give a better display of multiple component spectra than X-band.
In conventional continuous wave (CW) EPR, saturation studies carried out in the absence and presence of a paramagnetic relaxation reagent, such as NiEDDA, are frequently performed. MQ spectra are alternative displays that are sensitive to both T1 and T2 in differing ways compared to CW EPR spectra, and therefore depend on microwave power and relaxation agents in differing ways. One purpose of this work was to determine the feasibility of the acquisition of MQ spectra at Q-band of a spin-labeled protein, and another was to examine strategies for the analysis of T1 and T2 studies on MQ spectra from proteins.
Valuable information on the environment of a spin-label in a protein is obtained through measurement of T1, or quantities proportional to T1, in the presence and absence of a paramagnetic reagent (Altenbach et al., 1989; Isas et al., 2002; Klug and Feix, 2004). Power saturation has been extensively employed for this purpose, but the method requires recording the center line of a spectrum at multiple microwave powers under at least two different conditions. The procedure is lengthy, resulting in problems for time-dependent samples. Furthermore, the power saturation parameter is contaminated with T2 effects that must be factored out. One possibility to overcome these difficulties is saturation-recovery (SR) EPR—a technique that directly measures the T1 of a sample by fitting the recovery curve after a saturating microwave pulse to a theoretical model (Yin and Hyde, 1987). MQ spectroscopy is an attractive alternative to CW and SR EPR, since the spectra themselves have T1-dependent signal intensities. In principle, T1 changes can be time-resolved by monitoring changes in spectral amplitude.
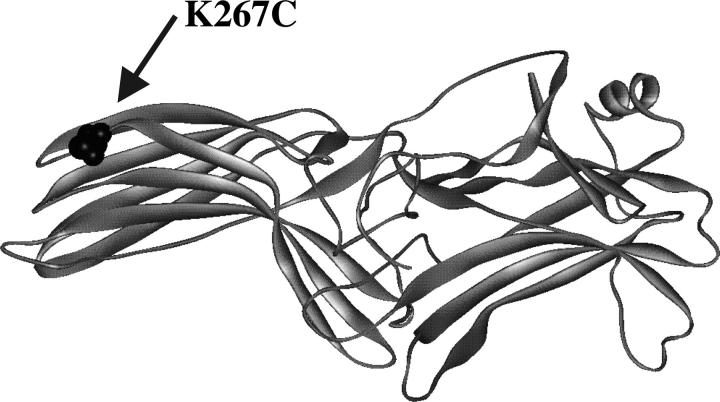
Visual arrestin is involved in the deactivation cycle of visual signal transduction. The structure of bovine visual rod arrestin, a 42-kDa soluble β-protein, has been solved by x-ray crystallography (Hirsch et al., 1999) and is shown in Fig. 1 with the residue utilized in these studies highlighted. Arrestin was employed in this study to demonstrate the feasibility of applying MQ EPR at Q-band frequency to biological systems. The results presented below demonstrate that MQ EPR will be a valuable technique to study protein structure and dynamics, including future studies of the functional dynamics of arrestin.
FIGURE 1.
Structural illustration of bovine visual rod arrestin with the lysine-to-cysteine mutation site used in these spin-labeling studies highlighted.
METHODS
Arrestin purification and spin-labeling
Arrestin was expressed in Escherichia coli BL-21 cells containing a pTrcHis-B-based plasmid encoding the arrestin gene (Gurevich et al., 1994) that contained a lysine-to-cysteine substitution at position 267 in a cysteine-less background. Pelleted cells were lysed, precipitated by ammonium sulfate and then purified by sequential heparin-Sepharose and Q-Sepharose (Amersham Biosciences, Piscataway, NJ) chromatography (Gray-Keller et al., 1997). Purity was determined by SDS-PAGE.
Purified arrestin was selectively labeled at the introduced cysteine residue with a 10-fold molar excess of the sulfhydryl-specific nitroxide spin-label (1-oxy-2,2,5,5-tetramethylpyrroline-3-yl)methyl methanethiosulfonate (MTSL, Toronto Research Chemical, Ontario, Canada) overnight at 4°C. Excess label was removed by extensive dialysis against 20 mM MOPS, pH 7.0 and 150 mM NaCl and the protein concentrated to 300 μM using Microcon centrifugal concentrators (Millipore, Bedford, MA).
Multiquantum Q-band EPR spectroscopy
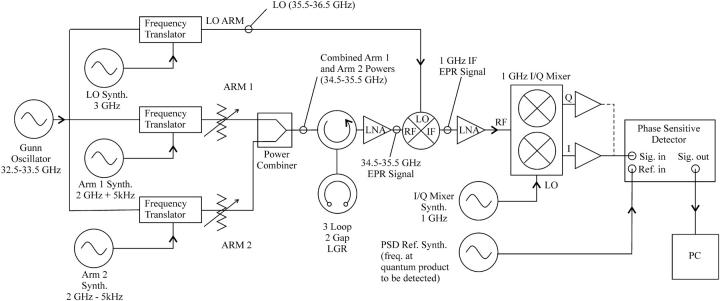
The bridge used in these experiments was described previously (Hyde et al., 2004) as configured for SR EPR. However, for the data shown here, the bridge was configured for MQ spectroscopy in a similar fashion to an X-band MQ bridge previously described in detail (Strangeway et al., 1995). The basic diagram of the Q-band MQ bridge is shown in Fig. 2. The output of a low-phase-noise Gunn-diode oscillator (32.5–33.5 GHz) is split into three arms. Two are the MQ arms providing power that is incident upon the sample resonator. The third arm is the local oscillator (LO) for the signal mixer. Microwave frequencies in the MQ arms are translated by 2-GHz plus or minus one-half the desired frequency separation (in this case 5 kHz) for a frequency separation of 10 kHz. The LO arm is translated by 3 GHz, and the resultant frequency difference between the two arms and the LO results in a superheterodyne 1-GHz output from the signal mixer. Since all synthesizers in the system are phase-locked to a common 10-MHz clock, microwave phase coherency between all the arms is preserved, allowing separation of absorption and dispersion components in the EPR signal and final detection of the MQ signals with a phase-sensitive detector (PSD). In each frequency-translation arm, the fundamental oscillator output is mixed with the output of a synthesizer, followed by a bandpass filter to remove undesired mixing products and a power amplifier to boost the output level. Arms one and two are combined and fed to the sample resonator through a circulator. The maximum bridge output power is 20 mW per arm.
FIGURE 2.
Diagram of the Q-band MQ bridge used in the experiments described here.
The microwave signal from the sample resonator is amplified by a low-noise amplifier, which establishes the noise floor of the detection system. The signal mixer after the low-noise amplifier produces a 1-GHz intermediate frequency output, which is amplified and down-converted to baseband in the I/Q mixer with the LO at 1 GHz. The phase of the synthesizer driving the LO port is adjusted in the initial setup to give the absorption and dispersion components of the EPR signal in the I- and Q-outputs of the mixer. The mixer outputs are buffered by a signal preamplifier, and either the absorption or the dispersion output directed to the signal input of the PSD. The frequency of the MQ product to be detected (3Q, 15 kHz or 5Q, 25 kHz) is set by the synthesizer that provides the PSD reference. Source frequency-locking to the sample resonator (AFC) is achieved by minimizing the 5-kHz component in the Q-channel of the I/Q mixer through a separate PSD driving the frequency control port of the fundamental oscillator.
A symmetric three-loop–two-gap resonator was constructed to accommodate aqueous samples at Q-band (Hyde et al., 2004). This resonator follows design aspects of a two-loop–one-gap Q-band resonator (Froncisz et al., 1986) as well as three-loop–two-gap resonators that were developed at X-band (Hyde et al., 1989; Wood et al., 1984). The outer loops for this Q-band resonator are large and the inner sample loop is small, which is the reverse of the latter two designs (Hyde et al., 1989; Wood et al., 1984). The outer loops are 2.06 mm in diameter and the inner (sample) loop is 0.65 mm. The electric field goes to zero in the center of the small loop, reducing dielectric loss from aqueous samples. In addition, the resonator has a high length/diameter ratio, making the radio frequency field uniform and improving the uniformity of saturation of all portions of the sample. The structure was constructed of aluminum, and the 0.13-mm gap was cut by electrical-discharge machine methods.
The magnet system consists of a Bruker model BH-15 field controller, ER082CZ power supply, and a B-E25 electromagnet. Field control and data acquisition are obtained through a custom LabVIEW program (National Instrument, Austin, TX).
Protein samples of 30 nL with concentrations in the range of 30–300 μM were contained in a glass capillary tube. Spectra were acquired in single 120-s scans taken over 100 G with a 200-ms time constant and a center field of 12,630 G. Spectra were recorded at room temperature in the presence of air or air + 20 mM NiEDDA (nickel ethylene-di-amine-di-acetic acid).
RESULTS
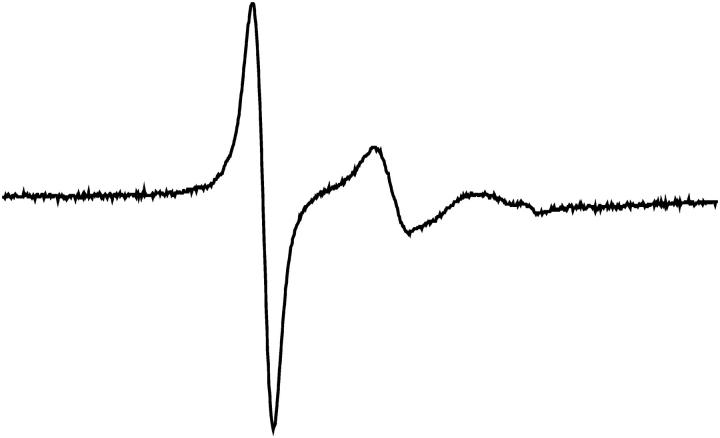
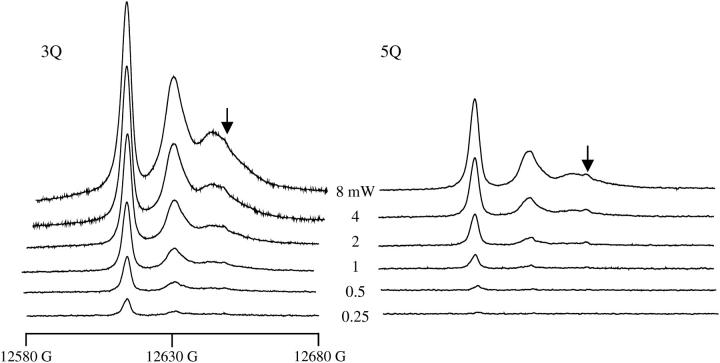
Arrestin was spin-labeled at position K267C with MTSL and the CW Q-band spectrum was recorded (Fig. 3). MQ spectra were then recorded at a protein concentration of 300 μM using less than a microliter of sample. MQ spectra are shown in Fig. 4. Spectra were recorded for both 3Q and 5Q transitions at increasing microwave powers from 0.25 mW to 8 mW in air. Since this was the first time MQ Q-band spectra of spin-labeled protein have been recorded, multiple powers were studied to observe the effects of power on the spectra. The spectra shown are pure absorption displays in contrast to the first derivative displays recorded with field modulation detection. Because there is no field modulation, the spectral lineshapes are not distorted and signal intensity for broad components is not compromised. As expected, the lineheights increase with increasing power, but are eventually saturated. It should be noted, however, that saturation of a MQ signal is not the same as the saturation of typical CW EPR signals (for a more detailed discussion, see Mchaourab and Hyde, 1993). The 5Q spectra appear to be more sensitive than the 3Q spectra to T2, as expected due to the 5Q  lineshape dependence. This effect is seen in the reduced spectral intensities of the 5Q spectra relative to the 3Q spectra due to their respective
  and
and  signal intensity dependencies (Mchaourab and Hyde, 1993). Two motional components are resolved in the spectra, with the longer T1T2 component indicated by the arrow in Fig. 4. It is apparent that this component is more pronounced in the 5Q signals. In addition, the low-field/center-field lineheight ratios are significantly larger in the 5Q spectra compared with the 3Q spectra. As previously predicted (Mchaourab and Hyde, 1993), the linewidths become narrower by nearly 20% in the 5Q spectra as compared with the 3Q spectra.
FIGURE 3.
CW Q-band spectrum of 100-μM arrestin K267C-MTSL. The 100-G spectrum was signal averaged four times at a power of 0.2 mW with a 120-s scan time, 0.1-s time constant, and 1.25-G modulation.
FIGURE 4.
Multiquantum EPR spectra of arrestin K267C-MTSL obtained at Q-band. 3Q and 5Q spectra were recorded of spin-labeled arrestin at varying microwave powers. The protein concentration of these 30-nL single scan samples was 300 μM, with a 100-G scan width, 120-s scan time, 0.2-s time constant, and Δf = 10 kHz. Powers indicated are per arm and the spectra were recorded in air. The arrows indicate the second motional component, which is more evident in the 5Q spectra.
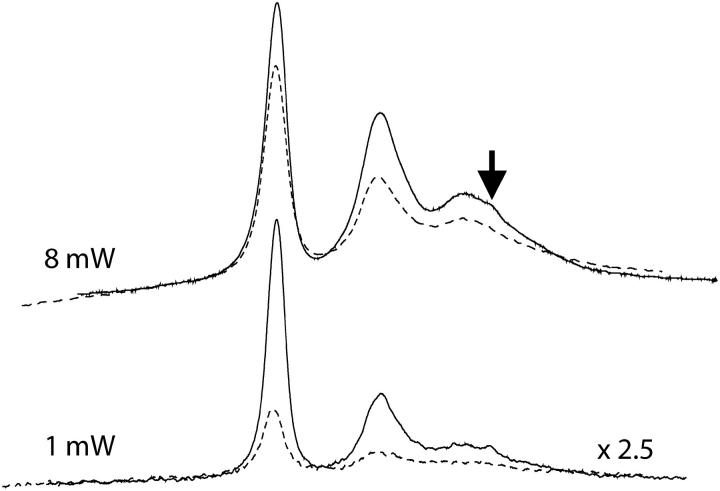
Fig. 5 shows the spectra of arrestin K267C-MTSL recorded under air in the presence of 20 mM NiEDDA as a paramagnetic relaxation reagent. K267C is a solvent-exposed residue accessible to collision with the NiEDDA, thus causing a decrease in T1. The decreased lineheights are a consequence of the T1-dependence of the MQ signal. To illustrate the effect of T1 changes on the spectral lineheight, Fig. 6 shows the overlay of the 3Q spectra recorded at both 8 mW and 1 mW power in air and in air + 20 mM NiEDDA. Since the 3Q and 5Q signal intensities are  - and
- and  -dependent, the ratio of the 5Q/3Q signals is dependent upon T1T2. Because little change in T2 occurs for this sample upon addition of 20 mM paramagnetic reagent, the major effect is due to a change in T1. The overlaid spectra in Fig. 6 for 1-mW power directly show this T1 effect in the lineheight differences. Therefore, the ratio of the lineheights for the two 3Q spectra is directly proportional to the change in T1 due to the addition of 20 mM NiEDDA since the
  values cancel in the ratio
  The percent change in signal intensity is about the same for each of the three lines. However, at 8 mW there is evidence of T2 effects when NiEDDA is added. The three lines have different T2 values, which affects the saturation of the MQ transitions. As a result, the changes that are seen when NiEDDA is added are different for each of the three lines. Thus, MQ EPR has the potential to separately study the accessibility properties of two different motional components within a protein sample.
FIGURE 5.
Multiquantum EPR spectra of arrestin K267C-MTSL obtained at Q-band in the presence of the paramagnetic broadening reagent NiEDDA. Sample conditions were the same as those in Fig. 4, but with the addition of 20 mM NiEDDA to each sample and a 240 μM protein concentration. Both 3Q and 5Q spectra were recorded in air at the powers indicated.
FIGURE 6.
Overlay of the 3Q spectra of arrestin K267C-MTSL recorded at 8 mW and 1 mW in air (solid line) and in air + 20 mM NiEDDA (dotted line). The spectra plotted are scaled to the same protein concentration as indicated. The decrease in signal height at each power is due to the decreased T1 in the presence of NiEDDA. The arrow indicates the second motional component of the spectrum in air.
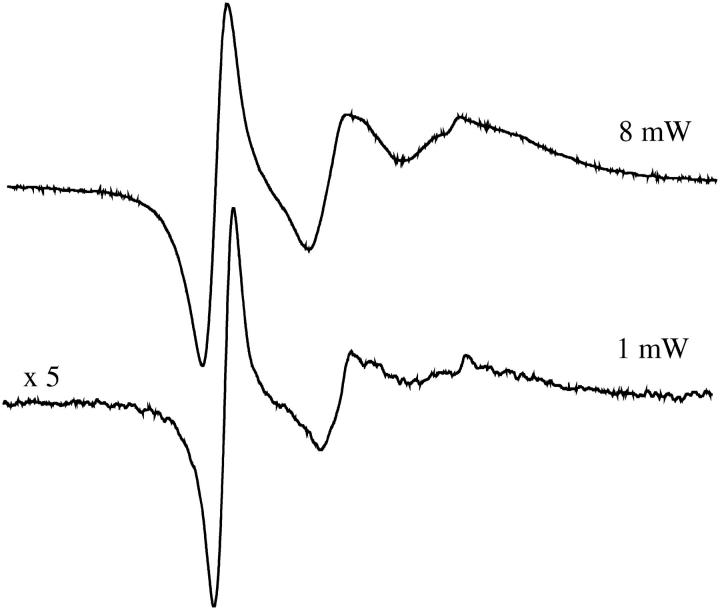
In addition to the pure absorption signals, pure dispersion signals of spin-labeled arrestin were recorded at 8-mW and 1-mW powers (Fig. 7). The dispersion signals are a derivative-like display, without the broadening or loss of signal intensity caused by field modulation in CW EPR. The dispersion spectra are especially sensitive to inflections and changes in the curvature of the lines. It is known that CW EPR dispersion signals in general are harder to saturate than absorption signals since the spectral peaks occur off of resonant frequency. Apparently, the MQ dispersion signals also saturated less readily than the MQ absorption signals, as seen in Fig. 7 where the 8-mW signal intensity is five times that of the 1-mW signal, rather than the 2.5-fold ratio observed for the absorption signals plotted in Fig. 6.
FIGURE 7.
3-Quantum pure dispersion signals were recorded at both 8-mW and 1-mW powers. The spectra were recorded under the same conditions as those in Fig. 4.
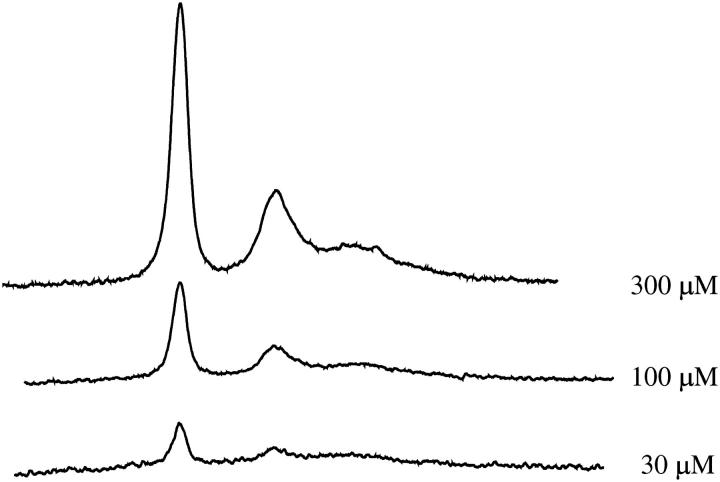
To test the sensitivity at lower protein concentrations, both 100 μM and 30 μM spectra were collected (Fig. 8). Single scans of each were recorded, and the signal intensities decreased 3- and 10-fold, as expected. Signal averaging of multiple scans would considerably improve the signal/noise ratios and permit these protein concentrations to be used in future work. The active volume of the resonator at Q-band is 30 nL and therefore the 30-μM protein sample contained <1 picomole of protein. For T1 measurements, MQ is preferable to CW saturation methods in terms of both relative collection times and the high quality of saturation data that is obtained by MQ because of rapid data collection. CW power saturation methods require the slow collection of numerous spectra at various incident microwave powers, whereas MQ provides direct T1 information in a single spectrum that is produced by continuously scanning the saturation curve at a rapid rate (5 kHz). In addition, the pure absorption and dispersion lines are detected when using MQ rather than the first derivative displays observed in CW EPR. Often, the spectroscopist employs a low amplitude field modulation to avoid modulation broadening, which decreases the CW EPR signal intensity. This tradeoff does not arise in MQ spectroscopy.
FIGURE 8.
Concentration-dependence of the 3Q signal intensity for arrestin K267C-MTSL in air. In addition to the 300 μM spectrum recorded, 100 μM and 30 μM protein concentrations were also recorded as single scans at 1 mW/arm and under the same conditions as those described in Fig. 4.
In the preceding discussion it has been assumed that the 3Q and 5Q absorption signals vary as  and
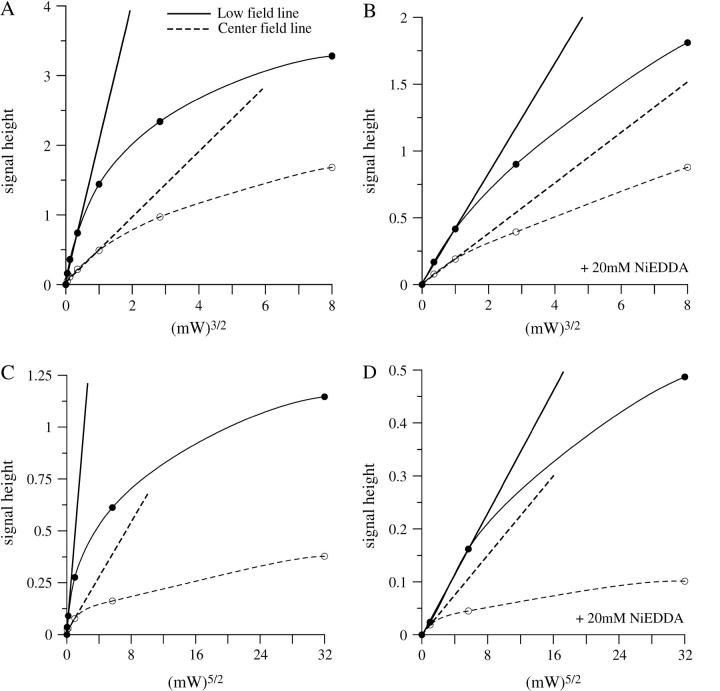
and  respectively, where H1 is the intensity of the incident microwave field. These assumptions are based on the work of Mchaourab and Hyde (1993) and are the result of expansions of complicated equations that are valid at sufficiently low incident microwave power. At higher incident power, other terms must be considered and the predicted dependences on H1 are more complex. To test the assumptions for our sample, the peak signal heights of the low field and central lines of Figs. 4 and 5 have been plotted in Fig. 9 versus
  for 3Q data and
  for 5Q data.
FIGURE 9.
Power-dependence curves of the 3Q and 5Q low field (solid lines) and center field (dotted lines) signal heights of the recorded spectra. (A) 3Q spectra in air, (B) 3Q spectra in air + 20 mM NiEDDA, (C) 5Q spectra in air, and (D) 5Q spectra in air + 20 mM NiEDDA. Lines are also drawn through the linear portions of the plots to indicate where the linear dependence of the signal heights drops off.
It is immediately apparent that all slopes at low power are greater for the low field line than the central line. This is a manifestation of the greater EPR signal intensity and also the longer T2 value of the low field line. For MQ EPR at Q-band, the low field data are preferred over data from the central line for quantitative interpretation since the fits to the initial slopes can be obtained with greater confidence.
The effect of NiEDDA on T1 can also be estimated by comparison of the solid-line slopes in Fig. 9, A and B. These slopes differ by a factor of 4.9. (A correction has been made to the relative signal intensities in Fig. 9 to accommodate sample dilution arising from addition of NiEDDA.) If it is assumed that NiEDDA makes a negligible contribution to T2, then this is the factor by which T1 differs. A similar analysis can be made from Fig. 9, C and D. The 5Q solid-line slopes differ by a factor of ∼16.1, which in principle should be the ratio of  values, or a factor of 4.0 for the T1 ratio. This is in fair agreement with the factor of 4.9 for the 3Q data. However, the 5Q data in the presence of NiEDDA at low powers are very noisy. We have a higher level of confidence in the 3Q data, although with sufficient signal-averaging, 5Q data will become more reliable.
In any new system, curves such as those shown in Fig. 9 should be obtained to determine the range over which the linearity is exhibited. Single MQ measurements, with and without relaxation agent, will then provide an estimate of relative accessibilities. The less sensitive 5Q spectral displays may be particularly advantageous for the insight they provide to anisotropic rotational diffusion, but quantitation of accessibility seems more difficult. Mchaourab and Hyde (1993) suggest that the full theory they developed would be appropriate in computer analysis of MQ spectra, and this may overcome some of the limitations that arise from use of only the initial slopes to interpret MQ data.
DISCUSSION
The advantages of MQ Q-band spectroscopy include the absence of field modulation, which allows pure absorption and dispersion displays, better resolution of multiple component spectra, enhanced spectral sensitivity to both T1 and T2, 30 nL sample volumes, and T1-sensitive signal intensities. Further enhancement of Q-band MQ instrumentation is in process, including optimization of the dimensions of the LGR and forming it from silver instead of aluminum. Development of digital detection that will permit simultaneous acquisition of dispersion and absorption spectra for both 3Q and 5Q transitions is also underway.
Based on the 3Q and 5Q spectra recorded of spin-labeled arrestin, it appears that the 5Q spectra provide better resolution of different motional components than the 3Q spectra, as would be predicted from its  signal-dependence. Two-component spectra are frequently encountered in spin-labeling studies. The multiple components can arise from multiple rotamers of the spin-label side chain, or to two conformations of the protein. In either case, the nitroxide is expected to have a different solvent accessibility in the two states, and MQ has the capability to explore the accessibilities of the individual components directly from the spectra. Spectral editing of two-component spectra based on the accessibility differences of the nitroxides will be an important potential application of MQ spectroscopy. Because the signal amplitudes of the 3Q signal depend on T1, the amplitudes, but not the shapes, of different components will, in general, be affected differentially by the addition of low concentrations of paramagnetic reagents. Thus, subtraction of two spectra obtained in the absence and presence of a paramagnetic reagent and scaled appropriately will yield the spectra of the individual components.
In addition, the dispersion spectra are also sensitive to motional components, and the derivative-like displays result in spectra that superficially resemble the usual derivative-like spectra seen in absorption spectra when field modulation is used. However, the sensitivity to inflections in the lineshape is better because there is no field modulation broadening. Dispersion MQ was not considered in much detail in the early articles, although it is likely to be useful in SDSL studies. Dispersion signals are often more sensitive to microwave phase noise, and this sensitivity increases in MQ since the signals are close to the carrier frequency. However, the resonator Q-factor is low and there are no passage phenomena, which often complicate CW dispersion signals at high powers. Although it is known that dispersion signals do not saturate as easily as absorption signals, the saturation of MQ dispersion lines may contain new information and has yet to be explored experimentally. The potential advantages to the study of MQ dispersion signals include the ability to use higher powers without saturating the signal, thus increasing signal/noise ratios, and the ability to increase the paramagnetic reagent concentrations used to saturate the EPR signals.
The spectra in Figs. 4 and 5 show that the lineheight ratios change in comparing 3Q and 5Q spectra. These changes are a measure of the T2 differences of these lines. There is the potential to directly observe T2 changes with greater sensitivity, due to the  and
and  signal intensity dependencies at 3Q and 5Q, respectively.
The exciting potential also exists for detecting accessibilities solely based on one or two spectra for each paramagnetic reagent tested. By comparing the spectra with and without relaxation reagent, a relative accessibility to each particular reagent can be determined without the use of pulse techniques or acquisition of numerous power saturation data points. T2 would be expected to remain relatively constant within the same sample, and therefore T1 differences could be directly obtained by changing the paramagnetic reagent and measuring the spectral lineheights. In addition, due to the increased resolution of Q-band to multiple motional components, the possibility exists for studying the accessibility and saturation properties of each separate component. For example, two 3Q spectra, one in the presence of nitrogen and the other in the presence of air, would give a direct indication of the effect of oxygen on that particular sample since the signal heights are both proportional to  where
where  cancels because it is not expected to change. The ratio of the two lineheights would yield the effect of T1 simply by obtaining two spectra. Although not utilized in these studies, the use of gas-permeable sample tubing can be used in our experimental setup (Hyde et al., 2004).
The feasibility and the practicality of the use of the MQ Q-band technique have been demonstrated on a biologically relevant protein at realistic volumes and concentrations. MQ EPR will be a valuable technique to study protein structure and dynamics and further experimental approaches are currently being tested.
Acknowledgments
This work was supported by National Institutes of Health grants No. EB001980 and EB002052.
References
- Altenbach, C., S. L. Flitsch, H. G. Khorana, and W. L. Hubbell. 1989. Structural studies on transmembrane proteins. II. Spin labeling of bacteriorhodopsin mutants at unique cysteines. Biochemistry. 28:7806–7812. [DOI] [PubMed] [Google Scholar]
- Froncisz, W., T. Oles, and J. S. Hyde. 1986. Q-band loop-gap resonator. Rev. Sci. Instrum. 57:1095–1099. [Google Scholar]
- Gray-Keller, M. P., P. B. Detwiler, J. L. Benovic, and V. V. Gurevich. 1997. Arrestin with a single amino acid substitution quenches light-activated rhodopsin in a phosphorylation-independent fashion. Biochemistry. 36:7058–7063. [DOI] [PubMed] [Google Scholar]
- Gurevich, V. V., C. Y. Chen, C. M. Kim, and J. L. Benovic. 1994. Visual arrestin binding to rhodopsin. Intramolecular interaction between the basic N-terminus and acidic C-terminus of arrestin may regulate binding selectivity. J. Biol. Chem. 269:8721–8727. [PubMed] [Google Scholar]
- Hirsch, J. A., C. Schubert, V. V. Gurevich, and P. B. Sigler. 1999. The 2.8 Å crystal structure of visual arrestin: a model for arrestin's regulation. Cell. 97:257–269. [DOI] [PubMed] [Google Scholar]
- Hyde, J. S., W. Froncisz, and T. Oles. 1989. Multipurpose loop-gap resonator. J. Magn. Reson. 82:223–230. [Google Scholar]
- Hyde, J. S., J. J. Yin, W. K. Subczynski, T. G. Camenisch, J. J. Ratke, and W. Froncisz. 2004. Spin label EPR T1 values using saturation recovery from 2 to 35GHz. J. Phys. Chem. B. 108:9524–9529. [Google Scholar]
- Isas, J. M., R. Langen, H. T. Haigler, and W. L. Hubbell. 2002. Structure and dynamics of a helical hairpin and loop region in annexin 12: a site-directed spin labeling study. Biochemistry. 41:1464–1473. [DOI] [PubMed] [Google Scholar]
- Klug, C. S., and J. B. Feix. 2004. SDSL: a survey of biological applications. In Biological Magnetic Resonance, Vol. 24. L. J. Berliner, S. S. Eaton, and G. R. Eaton, editors. Kluwer Academic/Plenum Publishers, Hingham, MA. 269–308.
- Mchaourab, H. S., and J. S. Hyde. 1993. Continuous wave multiquantum electron paramagnetic resonance spectroscopy. III. Theory of intermodulation sidebands. J. Chem. Phys. 98:1786–1796. [Google Scholar]
- Sczaniecki, P. B., J. S. Hyde, and W. Froncisz. 1991. Continuous wave multiquantum electron paramagnetic resonance spectroscopy. II. Spin-system generated intermodulation sidebands. J. Chem. Phys. 94:5907–5916. [Google Scholar]
- Strangeway, R. A., H. S. Mchaourab, J. R. Luglio, W. Froncisz, and J. S. Hyde. 1995. A general purpose multiquantum electron paramagnetic resonance spectrometer. Rev. Sci. Instrum. 66:4516–4528. [Google Scholar]
- Wood, R. L., W. Froncisz, and J. S. Hyde. 1984. The loop-gap resonator. II. Controlled return flux three-loop, two-gap microwave resonators for ENDOR and ESR spectroscopy. J. Magn. Reson. 58:243–253. [Google Scholar]
- Yin, J. J., and J. S. Hyde. 1987. Application of rate equations to ELDOR and saturation recovery experiments on 14N:15N spin-label pairs. J. Magn. Reson. 74:82–93. [Google Scholar]


