

Abstract
A bacterial cell that has a single polar flagellum alternately repeats forward swimming, in which the flagellum pushes the cell body, and backward swimming, in which the flagellum pulls the cell body. We have reported that the backward swimming speeds of Vibrio alginolyticus are on average greater than the forward swimming speeds. In this study, we quantitatively measured the shape of the trajectory as well as the swimming speed. The trajectory shape in the forward mode was almost straight, whereas that in the backward mode was curved. The same parameters were measured at different distances from a surface. The difference in the motion characteristics between swimming modes was significant when a cell swam near a surface. In contrast, the difference was indistinguishable when a cell swam >60 μm away from any surfaces. In addition, a cell in backward mode tended to stay near the surface longer than a cell in forward mode. This wall effect on the bacterial motion was independent of chemical modification of the glass surface. The macroscopic behavior is numerically simulated on the basis of experimental results and the significance of the phenomenon reported here is discussed.
INTRODUCTION
Many bacteria swim by rotating their helical flagella and respond to a variety of stimuli. Bacterial chemotaxis has been studied primarily using Escherichia coli and Salmonella enterica serovar Typhimurium (Macnab, 1987; Blair, 1995). These bacteria have many flagella located all over the cell body, called “peritrichous flagella”. They exhibit a swimming pattern in which the “run” mode and the “tumble” mode are alternately repeated (Berg and Brown, 1972). A bacterial cell swims straight in the run mode by rotating the flagellar bundle counterclockwise (CCW). Each flagellum rotates clockwise (CW) in the tumble mode, and the cell cannot move translationally but can randomly change its direction. The cell responds to stimuli by modulating the frequency of the tumble modes (Brown and Berg, 1974).
Bacteria that have single polar flagella (monotrichously flagellated bacteria), such as Vibrio alginolyticus, display a swimming pattern different from peritrichously flagellated bacteria. The cell alternately repeats forward swimming caused by CCW flagellar rotation and backward swimming caused by CW rotation (Homma et al., 1996). It is notable that the cell moves translationally whenever the flagellum rotates. Thus, CW flagellar rotation plays a different role from that of peritrichously flagellated bacteria. The CW rotation of a bundle of peritrichous flagella corresponds to a brief stop of a monotrichous flagellum between CCW and CW rotation. Switching between forward and backward modes is rapid. Chemotaxis is performed by modulating the switching frequency. A cell that goes out, turns, and backs up precisely on track would move only along a straight line and could not scan everywhere. This does not occur in practice, since random forces such as Brownian motion perturb the cell's trajectory (McCarter, 2001).
The CCW and CW rotations of a monotrichous flagellum, i.e., the forward and backward swimming modes, appear to be equivalent from the standpoint of chemotaxis. No difference between the two modes was indicated by the conventional hydrodynamic model for monotrichously flagellated bacteria (Holwill and Burge, 1963; Chwang and Wu, 1971; Magariyama et al., 1995). However, it was reported that the backward swimming speeds of V. alginolyticus are on average 1.5 times greater than the forward swimming speeds (Magariyama et al., 2001).
There are some conceivable causes for the difference in swimming speeds, i.e., the torque characteristics of the flagellar motor, deformation of the flagellar filament, and interaction between the cell and a solid surface. The cause of the difference is not yet known. We consider that flagellar deformation can be eliminated from the three possible causes given above. A very small difference in deformation between forward and backward modes, as well as minimal deformation, was recently confirmed by an experiment and by a numerical analysis (Nishitoba et al., 2003; Takano et al., 2003).
We noted in observations by high-intensity dark-field microscopy and phase-contrast microscopy that the trajectory in the forward mode differs from that in the backward mode (Kudo et al., 2005). The phenomenon was qualitatively analyzed in that article. In this study, to clarify the cause of the difference in the bacterial motion between the forward and backward modes, we carried out a detailed quantitative analysis of the shape of the trajectory and the swimming speed, depending on the distance from a solid surface. These results reveal that the previously reported speed difference is caused by proximity to a surface. We also suggest that a surface affects the chemotactic behavior.
MATERIALS AND METHODS
Bacterial strains and sample preparation
The bacterial strains used in this study are listed in Table 1. The cells were cultured at 30°C in HI broth (2.5% heart infusion broth (Becton-Dickinson, Franklin Lakes, NJ), 1.5% NaCl) with shaking. The cells were harvested by centrifugation at the late exponential phase and suspended in 20 volumes of HG300 medium (50 mM HEPES-KOH (pH 7.0), 5 mM glucose, 5 mM MgCl2, 300 mM NaCl). The cells were left at room temperature for >30 min before measurement.
TABLE 1.
Bacterial strains
| Strain | Phenotype | Source |
|---|---|---|
| YM4 | No lateral flagella | Kawagishi et al. (1996) |
| Wild-type swimming | ||
| YM42 | No lateral flagella | Magariyama et al. (1995) |
| Only forward swimming | ||
| NMB102 | No lateral flagella | Homma et al. (1996) |
| Only backward swimming |
Measurement of bacterial swimming speed and trajectory
We recorded video images of bacterial swimming according to the method described by Magariyama et al. (2001) to identify the swimming mode (forward or backward) if necessary. A simple chamber, as depicted in Fig. 1, was assembled from a glass slide (No. 1, 26 × 78 mm2, Matsunami Glass Ind., Kishiwada, Japan) and three coverslips (No. 1, 22 × 22 and 22 × 7 mm2, Matsunami) to examine the wall effect. The cell suspension was put into it and the open edges were completely sealed with nail enamel. Video images of bacterial swimming were recorded by phase-contrast microscopy (BX50, Olympus, Tokyo, Japan; CS220, Olympus; DSR-30, Sony, Tokyo, Japan). The video images were captured on a PC (Endeavor Pro-1000, Epson Direct, Matsumoto, Japan; DVStorm-RT, Canopus, Kobe, Japan). The centers of the cells were determined every frame by NIH Image on an Apple Power Macintosh G3 and the trajectories were then obtained by an original Visual Basic for Applications program in Microsoft Excel 2002/Windows XP.
FIGURE 1.

Overhead view of a simple chamber. The chamber is assembled from a glass slide and three coverslips. The parts are affixed with Apiezon grease (Shinwa Chemical Industries, Kyoto, Japan). The thickness of the sample is 0.12–0.17 mm, which is the thickness of the coverslip.
Measurement of bacterial residence time around a wall
We defined the bacterial residence time as the period of continuous trajectory in the focus of a phase-contrast microscope, as indicated in Fig. 2. The ideal depth of focus was 0.5 μm since the numerical aperture of the object lens used in this study (UPlanFl 40×, Olympus) was 0.75. However, a practical depth of focus would be ∼10 μm, since the images slightly out of focus were also processed.
FIGURE 2.

Schematic cross-section drawing of a bacterial swimming trajectory around a wall. We define the residence time as the period of continuous trajectory within the focus of the phase-contrast microscope.
Chemical modification of the glass and measurement of the contact angle
Glass slides and coverslips were silanized with silane-coupling agents, methyltrimethoxysilane, and 3-mercaptopropyltrimethoxysilane (Shin-Etsu Chemical, Tokyo, Japan) according to Sasou et al., 2003. The contact angles were measured to characterize the silanized surfaces. A droplet of 5 μl of HG300 was deposited on a glass slide using a micropipette. The droplet image was recorded (Ai Micro Nikkor, 55 mm, F2.8S, Nikon, Tokyo, Japan; XC-77, Sony; DF-20, Fuji Photo Film, Minami-Ashigara, Japan), the image was analyzed by NIH Image, and the contact angle was determined from the coordinates of the three characteristic points under the assumption that the droplet was spherical (Fig. 3).
FIGURE 3.

 |
Computer simulation of the swimming trajectory
The calculations were performed using a Visual Basic for Applications program originally developed in Microsoft Excel 2002/Windows XP. The cell position was calculated from the previous position and the velocity every millisecond. The velocity randomly reversed according to a probability that depended on the swimming mode and the bacterial state. The bacterial state was expressed as the distance between the present state and the target position, and the present state was compared with the state 1 ms prior when simulating the taxis behavior. Turn angles at a reversal were stochastically determined based on a distribution obtained experimentally. The simulation program is shown as a flow chart in Fig. 4.
FIGURE 4.

Flow chart of the simulation program for the swimming trajectory of V. alginolyticus. Rectangles and diamonds refer to procedures and judgments, respectively. The loop from the second step to the eighth is repeated every Δt (1 ms). A random number (0–1) generated by the computer is compared with the switching possibility (Pf or Pb) in the sixth step, and the mode is changed in the seventh step if the random number is smaller than the switching possibility. Here, the value of the switching possibility is equal to one-thousandth of the value of the corresponding switching frequency shown in Table 4. When a trajectory in a uniform environment is simulated, the third and fourth steps are not executed.
RESULTS
Difference in swimming speed and trajectory between forward and backward modes
We previously reported that the backward swimming speed of V. alginolyticus YM4 is on average 1.5 times greater than the forward speed (Magariyama et al., 2001). In addition to this result, the shape of the swimming subtrajectory differed between the forward and backward modes (Fig. 5), as we reported previously (Kudo et al., 2005). Here, we define the subtrajectory as the trajectory between successive rapid turns. The trajectory depicted in Fig. 5 demonstrates that a YM4 cell swam along an almost straight line in the forward mode, and along a curve in the backward mode. We occasionally observed a cell curving both to the right and the left in the backward mode, although the cell in Fig. 5 curved only to the right.
FIGURE 5.

Swimming trajectory measured by high-intensity dark-field microscopy. The diamonds refer to the center of the cell body in every video frame (1/30 s). The subtrajectories indicated by open symbols and lines respond to forward modes. The subtrajectories indicated by closed symbols respond to backward modes. Here, we define a subtrajectory as the trajectory between successive turns.
Relationship between the phenomenon and the distance from a wall
We examined the wall effect by using simple chambers with spacers (Fig. 1) to compare the bacterial motion close to and far from surfaces, since a cell always swims near a surface in a normal slide without spacers. The bacterial motion close to a surface was recorded, focusing on the surface of the coverslip (referred to hereafter as “upper”) or on the surface of the slide (“lower”). The bacterial motion far from any surface was recorded at the midpoint between the upper and lower positions (“middle”). The middle position was at least 60 μm away from both surfaces.
We characterized the bacterial motion by the swimming speed and the turning speed, as defined in Fig. 6. The turning speed is a parameter that represents the shape of the trajectory. It is equal to zero when a cell goes straight; it is positive when a cell curves to the left and negative when it curves to the right. The swimming speed of 558 subtrajectories measured near the upper surface was 73 ± 16 μm/s, that of 475 subtrajectories at the middle position was 66 ± 15 μm/s, and that of 582 subtrajectories near the lower surface was 72 ± 16 μm/s. The turning speeds near the upper surface, at the middle position, and near the lower surface were 0.72 ± 1.32 rps, 0.04 ± 0.72 rps, and -0.73 ± 1.33 rps, respectively. These results may suggest a wall effect on the motion characteristics. Considering the bacterial swimming mode, forward or backward, in analyzing the data would make the wall effect clearer.
FIGURE 6.

Definition of turning speed. An open circle represents the center of the cell body. Symbols X, v, ω, and n are the position, velocity, turning speed, and frame number. We consider that a counterclockwise curve has a positive turning speed value. The turning speed at frame n was determined from the velocities at frames n and n − 1. The velocity at frame n was determined from the positions of the cell body at frames n and n − 1.
We could not determine the bacterial swimming mode from the video records since the flagellar filament could not be observed by phase-contrast microscopy. We could only discriminate the subtrajectories before and after a rapid turn. One subtrajectory would be in the forward mode and the next would be in the backward mode. Extending this idea, if the first subtrajectory is in the forward mode, then odd-numbered and even-numbered subtrajectories will be in the forward and backward swimming modes, respectively. It will be the reverse if the first subtrajectory is in the backward mode.
Typical examples of the motions of YM4 close to and far from any surface are provided in Fig. 7. Almost-straight subtrajectories and subtrajectories curved to the right were repeated alternately near the upper surface (Fig. 7 a). Similar behavior was observed near the lower surface, except that the curving direction was opposite (Fig. 7 e). No marked difference in the characteristics of motion between the subtrajectories before and after a rapid turn was observed at the middle position (Fig. 7 c): the swimming speed did not change very much and the turning speed was almost zero before and after a rapid turn (Fig. 7 d). In contrast, as shown in Fig. 7 f, the swimming speed in the curving subtrajectory seemed to be greater than that in the straight subtrajectory. The same tendency was seen in Fig. 7 b.
FIGURE 7.

Typical examples of bacterial motion close to and far from walls. The motions were recorded near the upper surface (a and b), at the middle position (c and d), and near the lower surface (e and f). Trajectories are indicated in a, c, and e. The swimming speeds (closed symbols) and turning speeds (open symbols) calculated from a, c, and e are provided in b, d, and f. Triangles and squares refer to the data points included in the odd- and even-numbered subtrajectories. Arrows in a, c, and e indicate the first subtrajectories and their directions of progress. The data points at turns are not represented.
Fig. 8 presents the statistical characteristics of swimming speed and turning speed. An index referring to the difference between forward and backward swimming speeds,  was introduced in our previous article (Magariyama et al., 2001), where vf and vb are the swimming speeds in the forward and backward modes in a trajectory. According to the previous results, in which a normal slide without spacers was used, the frequency distribution of the indices tended toward the negative side (Fig. 8 a; Table 2), leading us to conclude that the forward swimming speed was lower than the backward speed, and that the cause for the phenomenon was neither individual differences nor changes in physiological condition.
FIGURE 8.
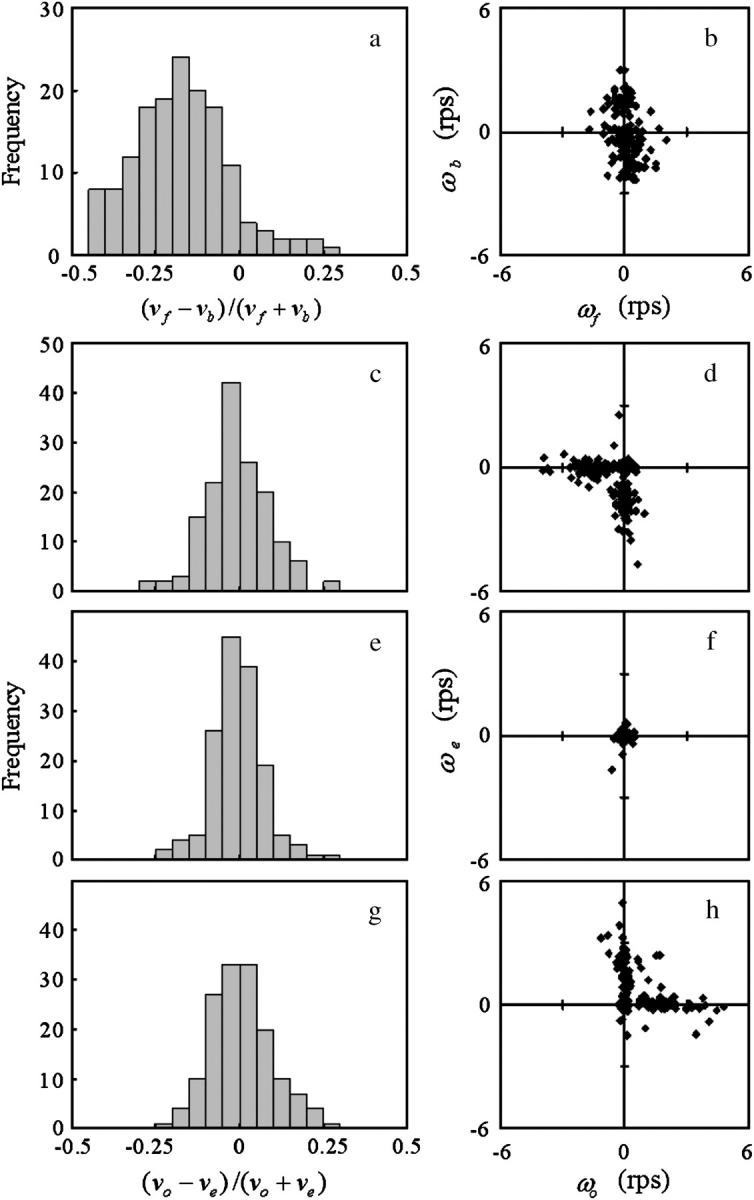
Wall effect on the bacterial motion. The motions were recorded in chambers without spacers (a and b), near the upper surface (c and d), at the middle position (e and f), and near the lower surface (g and h). The frequency distribution of the index that expresses the relationship between the forward and backward swimming speeds,  is shown in a. Frequency distributions of the index expressing the swimming speed relationship between the odd and even subtrajectories,
  are given in c, e, and g instead of
  The relationship of the turning speed between the forward and backward subtrajectories is provided in b, and those between the odd and even subtrajectories are given in d, f, and h. The set of swimming speeds of the odd and even subtrajectories was obtained from a trajectory, such as in Fig. 7, a, c, and e, by averaging the swimming speeds at all corresponding frames. The set of turning speeds was obtained in the same way. There are 150 data sets for every case. Here, v and ω are the swimming speed and turning speed, respectively; subscripts f, b, o, and e refer to the forward mode, backward mode, odd subtrajectory, and even subtrajectory.
TABLE 2.
Averages, standard deviations, and variance ratios of the distributions of 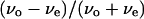
| Normal | Upper | Middle | Lower | |
|---|---|---|---|---|
| Average | −0.174 | −0.007 | −0.006 | 0.006 |
| Standard deviation | 0.143 | 0.094 | 0.075 | 0.089 |
| Variance ratio | Upper | 1.58 | 1.13 | |
| Lower | 1.40 |
Normal, Upper, Middle, and Lower correspond to the distributions in Fig. 8, a, c, e, and g. The critical value for a two-sided F-test with 5% reliability and (149, 149) degrees of freedom is 1.38.
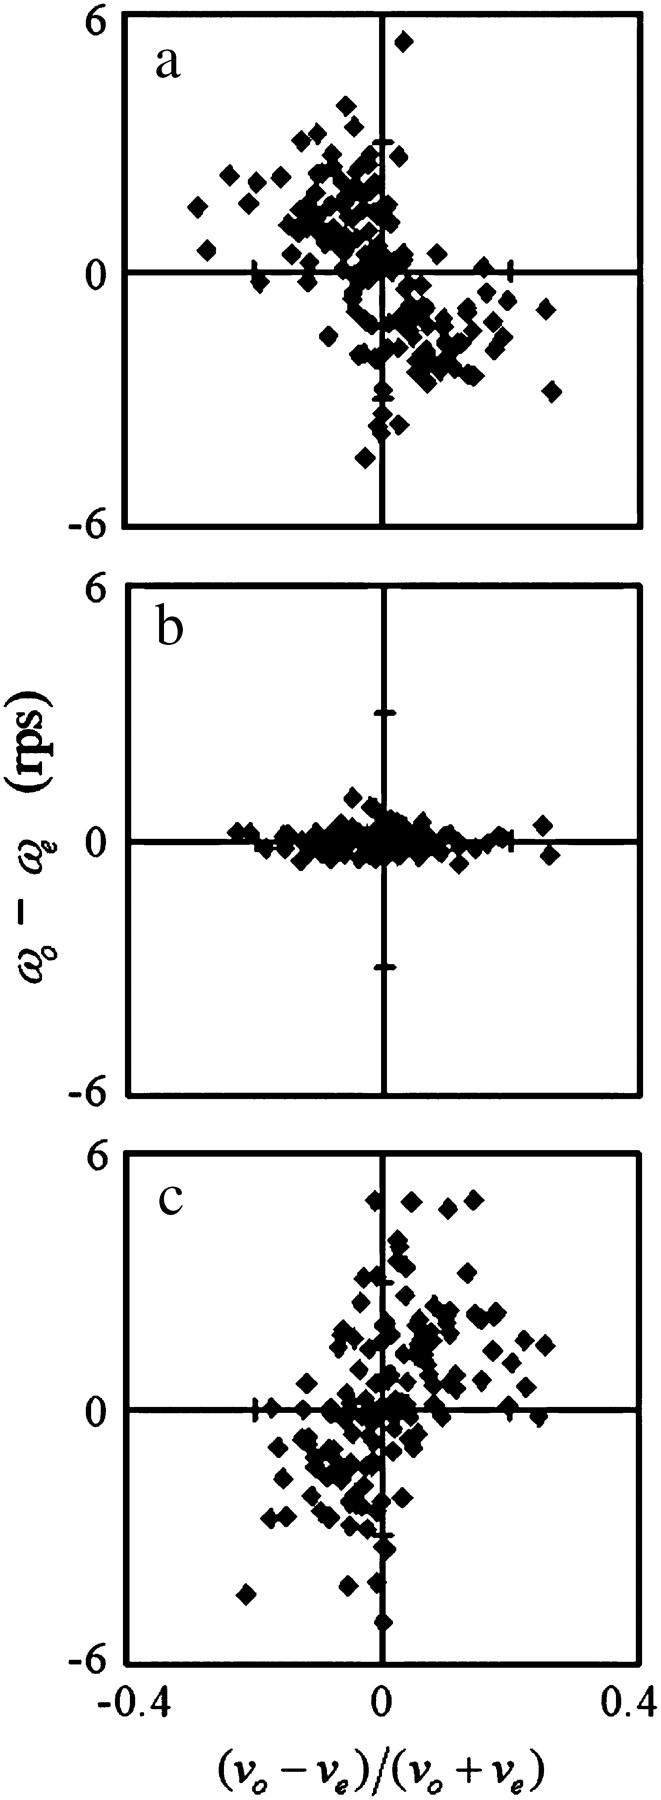
We introduce a slightly different index,  in this article, since whether the swimming mode was forward or backward could not be distinguished by phase-contrast microscopy. Here, vo and ve are the swimming speeds in the odd- and even-numbered subtrajectories in a trajectory. The values of the index for 150 trajectories measured at the three positions (upper, middle, and lower) in the simple chambers were symmetrically distributed around zero (Fig. 8, c, e, and g; the averages are −0.007, −0.006, and 0.006), as we expected, since the odd- or even-numbered subtrajectories corresponded to either swimming mode, forward or backward.. The distribution at the middle position (Fig. 8 e; standard deviation (SD) 0.075) was slightly narrower than those near the upper (Fig. 8 c; SD 0.094) and lower (Fig. 8 g; SD 0.089) surfaces. Two-sided F-tests with 5% significance level indicate that the variance at the middle position differs from those at the upper and lower positions and cannot reject that the distributions near the upper and lower surfaces have the same variance (Table 2), although those distributions were not as broad as that measured in the normal slide (Fig. 8 a; SD 0.14).
The turning speed in the forward mode (−0.08 ± 0.55 rps) was generally lower than that in the backward mode (0.14 ± 1.27 rps) in the normal slide, as described in the first section of Results (Fig. 8 b). Different phenomena were observed in the simple chamber, depending on the distance from a surface. A set of ωo and ωe near the upper surface had a set of large negative and small values, or the converse (Fig. 8 d). Thus, a bacterial cell generally alternated between an almost-straight run and curving to the right in every turn. The same result was obtained near the lower surface, except that the turning speed had positive values, i.e., a cell curved not to the right but to the left (Fig. 8 h). The values of both ωo and ωe were nearly zero at the middle position (Fig. 8 f). There was no difference between the characteristics of the bacterial motion far from the wall before and after a rapid turn.
Relationship between the swimming-speed difference and turning-speed difference
We have shown a wall effect on the swimming speed and the turning speed. However, that effect on the swimming speed was not as apparent as the effect on the turning speed. We analyzed the correlation between the swimming speed and the turning speed near the upper surface, at the middle position, and near the lower surface to examine the wall effect on the swimming speed. Instead of the swimming speed and the turning speed,  and
and  were used to eliminate the effect of individual differences. Fig. 9 indicates a negative correlation near the upper surface, no correlation at the middle position, and a positive correlation near the lower surface between the two parameters
  and
and  Therefore, we concluded that the swimming speed and the turning speed were affected by a wall.
FIGURE 9.
Correlation between swimming speed and turning speed. The correlation between  and
and  was examined to eliminate the effect of individual differences. The data obtained near the upper surface, at the middle position, and near the lower surface are given in a, b, and c. The correlation coefficient values were −0.55, −0.03, and 0.51 for a, b, and c, respectively.
Residence time around a wall
The residence time near a surface was measured using three types of bacterial strains, wild-type swimming (YM4), forward swimming (YM42), and backward swimming (NMB102), to examine the interaction perpendicular to the wall. Fig. 10 depicts the frequency distributions of the residence time. The distributions were exponential, indicating no dependence on the swimming history. Thus, exiting from the focused layer was a stochastic process, similar to machinery failure that occurs with a constant probability. The wild-type swimming strain (Fig. 10, a and g) and the backward swimming strain (Fig. 10, c and i) stayed near a surface for twice as long on average as the forward swimming strain (Fig. 10, b and h). The residence times of all three strains at the middle position (Fig. 10, d–f) were as short as that of the forward swimming strain near a surface (Fig. 10, c and i). We concluded that attraction was generated between a bacterial cell and a surface when the cell was swimming backward near the surface.
FIGURE 10.

Frequency distribution of residence time. The motions were recorded near the upper surface (a, b, and c), at the middle position (d, e, and f), and near the lower surface (g, h, and i). A wild-type swimming strain (YM4; a, d, and g), a forward swimming strain (YM42; b, e, and h), and a backward swimming strain (NMB102; c, f, and i) were used in this experiment. The bars refer to the measured data. The number of data points is >200 for each case. Data are not shown in two left columns for each graph, since trajectories that had <20 frames (2/3 s) of residence time were not analyzed. The line refers to the exponential function 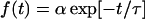 to which the measured data was fitted. Here, t is the residence time, τ is the average residence time, and α is the constant. The value of τ is given in each chart.
Effect of chemical characteristics of a surface
We examined the effect of chemical modification of the glass surface on the bacterial motion. Three glasses were prepared, two by treatment with silane-coupling agents. The contact angles of the glasses are summarized in Table 3. The surface of the first glass, which was not treated with any agent, was too hydrophilic to measure the contact angle. Among the remaining glasses, the methylsilane-treated glass was more hydrophobic than the mercaptosilane-treated glass. The relationships between the turning speeds before and after a rapid turn were measured in the simple chamber assembled from the chemically modified glasses (Fig. 11). No noticeable difference could be distinguished among the chemical modifications. The experiment could not be performed using the glass treated with aminosilane, since almost all the cells were attached to the glass surface.
TABLE 3.
Contact angles on the glass slides treated with silane-coupling agents
| None | Methyl | Mercapto |
|---|---|---|
| Nearly 0° | 78.8 ± 2.5° | 64.0 ± 4.9° |
None, Methyl, and Mercapto refer to glass without treatment, glass treated with methyltrimethoxysilane, and glass treated with 3-mercaptopropyltrimethoxysilane.
FIGURE 11.

Effect of chemical modification of the glass surface on the bacterial motion. The charts indicate the relationships of turning speed between odd and even subtrajectories. The simple chambers were assembled from glasses treated with no chemical (a and d), methyltrimethoxysilane (b and e), and 3-mercaptopropyltrimethoxysilane (c and f). The bacterial motions were recorded near the upper surface (a–c) and at the middle position (d–f).
Simulation of the swimming trajectory
We numerically simulated the swimming trajectories to investigate the wall effect on the macroscopic behavior of V. alginolyticus (Fig. 12). The difference in short-term motion characteristics observed in the experiments caused a significant difference in long-term motion. The calculations were performed under the following assumptions:
Random forces act only when switching between forward and backward modes.
The turn angle conforms to a normal distribution.
Mode switching occurs randomly with a determined probability.
FIGURE 12.

Computer simulation of the swimming trajectory of V. alginolyticus. (a) Distribution of the turn angle at mode switching. Bars refer to the data for 244 turns measured at the middle position. Here, the turn angle is defined as the angle between approximate lines of the subtrajectories before and after mode switching. The line refers to a calculated normal distribution with a mean of zero degrees and a standard deviation of 20°. (b) Examples of calculated swimming trajectories. The thick line refers to a 10-s trajectory of a cell near a surface. The thin line refers to a 10-s trajectory of a cell far from any surface. (c) Calculated 60-s trajectories of 10 cells assumed to swim near a surface in a uniform environment. (d) Calculated 60-s trajectories of 10 cells assumed to swim far from any surface in a uniform environment. (e and f) Calculated positions of 20 cells 60 s later. The cells were assumed to swim (e) near or (f) far from a surface in an environment in which the point source of an attractant was set at the distance of 1 mm from the origin (X = 0 μm, Y = 1000 μm). The initial position for all calculations was (X = 0 μm, Y = 0 μm), the initial swimming velocity was (VX = 50 μm/s, VY = 0 μm/s), and the initial swimming mode was forward.
Assumption 1 was set for simplification since the effect of Brownian motion is small but present during switching. Assumptions 2 and 3 are based, respectively, on the measured distribution of the turn angle (Fig. 12 a) and a report that the forward and backward periods exhibit exponential distributions (Magariyama et al., 2001). The values of the parameters used in the calculation are summarized in Table 4. The adopted values of swimming speed and turn speed were close to the values measured in this study. We let the backward swimming speed be greater than the forward swimming speed based on a previous report (Magariyama et al., 2001). Fig. 12 a indicates that the turn angle at a mode switch conformed to a normal distribution with a mean of 0° and a standard deviation of 20°. Therefore, those values were adopted in the calculation. The probabilities of mode switching in a uniform environment, 2.5 times/s for switching from forward mode to backward and 4.0 times/s for the opposite switching, were based on the mean periods of the forward and the backward mode, 0.40 s and 0.23 s (Magariyama et al., 2001). The probabilities under the taxis condition were determined relative to those in a uniform environment for simplification. Thus, we let the probability be half as great as the standard when the cell went to a better environment, and twice the standard when going to a worse environment.
TABLE 4.
Swimming parameters used in the calculation
| Swimming speed (μm/s) | Turning speed (rps) | Condition | |
|---|---|---|---|
| Forward | 50 | 0 | Always |
| Backward | 70 | 3 | Near wall |
| 50 | 0 | Far from wall | |
| Mean | Standard deviation | Distribution | |
| Turn angle | 0 (degree) | 20 (degree) | Normal |
| Bacterial state
|
|||
| Switching frequency | Constant | Better | Worse |
| F to B | 2.5 (1/s) | 1.25 (1/s) | 5.0 (1/s) |
| B to F | 4.0 (1/s) | 2.0 (1/s) | 8.0 (1/s) |
F to B indicates switching from forward mode to backward mode. B to F indicates the opposite.
Fig. 12 b contains examples of the swimming trajectory under the uniform environment. The thick line is a calculated trajectory near a surface and the thin line is a trajectory far from any surface. Both lines are similar to the experimental result (see Fig. 7). Fig. 12, c and d, depicts 10 calculated trajectories of a cell that has (c) different or (d) the same motility characteristics between forward and backward modes. The trajectories in Fig. 12 d tended to spread wider than those in Fig. 12 c. We simulated a condition in which the point source of an attractant was located 1 mm from the starting point to investigate the macroscopic taxis behavior. Fig. 12, e and f, depicts the cell positions 60 s later. The cells had (e) different or (f) the same motility characteristics between swimming modes. The positions in Fig. 12 e tended to be closer to the target than those in Fig. 12 f. The former cells tended to approach the target straighter and faster than the latter (data not shown). The slow approach to the target rather than the low accuracy is the reason for the wide spread of the points in Fig. 12 f.
These results demonstrate that the macroscopic motion characteristics such as spreading and chemotactic behavior are affected by the microscopic swimming pattern of the difference in the swimming speed and the turning speed between forward and backward modes.
DISCUSSION
The single-polar-flagellated bacterium V. alginolyticus displayed different motion characteristics between forward and backward modes near a solid surface. The cell ran straight in the forward mode, whereas it curved in the backward mode. The backward swimming speed was greater than the forward swimming speed. In contrast, no difference in the motion characteristics was observed between the forward and backward modes far from any surface, indicating that the phenomenon observed near a surface is not caused by the torque characteristics of the bacterial flagellar motor or the deformation of the flagellar filament.
A swimming bacterial cell must be affected by some force from a solid surface. That force is neither hydrophobic interaction nor electrostatic interaction since the motion characteristics were not affected by chemical surface modifications with silane-coupling agents. Hydrodynamic interaction is a possibility since it is a long-range force. The difference in the motion characteristics between the forward and backward modes has not been explained yet, although hydrodynamic analyses have succeeded in explaining most other bacterial motion phenomena (Holwill and Burge, 1963; Chwang and Wu, 1971; Magariyama et al., 1995; Azuma, 1992; Ramia et al., 1993, Goto et al., 2001). Streams are symmetrical between the forward and backward directions in low Reynolds number hydrodynamics, leading us to expect the same motion characteristics between the forward and backward modes. We believe that important factors have been overlooked. The problem to be solved now is to identify those factors and to explain the phenomenon described in this article.
Wall effect on the swimming speed and turning speed
According to the two-sided F-tests, the distribution of the swimming speed index near a surface differed from that far from any surfaces. In addition, a correlation between the index and the turning speed was seen only when the cells swam close to surfaces. Therefore, we concluded that the swimming speed difference between forward and backward modes was caused by a surface. However, the frequency distribution of  measured near a surface in the simple chamber with spacers (Fig. 8, c and g) was narrower than that measured in a normal slide without spacers (Fig. 8 a); we had expected their distributions to be similar. The difference between the forward and backward swimming speeds was comparatively small in our results. The distance from a cell to a nearby surface was <5 μm in the normal slide since the sample medium thickness was ∼10 μm. Thus, a cell always swims near either surface in a normal slide. In contrast, the distance from a cell to the surface in a simple chamber is not always <5 μm since the side other than the surface is open and the motion of a cell >5 μm away from the surface may also be recorded and analyzed. The difference in swimming speed near the surface was comparatively small and was similar to the difference at the middle position, probably because cells >5 μm away from the surface were included in the data.
In contrast to the swimming speed, the difference in the turning speed, representing the shape of the trajectory, between the forward and backward swimming modes near a surface clearly differed from the difference at the middle position. This result indicates that the force in the progress direction that acted on the cell rapidly decreased with distance from the surface, whereas the force in the lateral direction did not decrease as rapidly. This problem will also be solved if the law governing the wall effect on bacterial motion is clarified.
Significance of the surface for bacteria
V. alginolyticus is a marine bacterium. Although the bacterium is known to swim considerably fast (up to 150 μm/s; Magariyama et al., 1994), its motility and chemotaxis do not seem to indicate a sufficient effect in the vast ocean since the bacterial swimming speed is much lower than the flow speed of water caused by oceanic currents and the motions of other large organisms such as fish. In addition, the concentration of each chemical substance is much lower than the limit of bacterial chemosensing (∼1 μM; Macnab, 1987), although the concentration of the total dissolved organic carbon in surface sea waters is 60–80 μM (Ogawa and Tanoue, 2003). Effective bacterial chemotaxis in the vast ocean would require remarkably advanced performance.
Large living or dead organisms are suitable nutrient sources for bacteria in the ocean since the nutrient molecules around and diffusing from the organism are much more concentrated than in the bulk of sea water. Therefore, a bacterial cell must exhibit effective chemotaxis near a solid surface. The motion characteristics of V. alginolyticus near a surface reported in this article fulfill that requirement. The curved trajectory in the backward mode allows the bacterial cell to approach a target position faster than a straight trajectory. The attractive force between the surface and the cell in the backward mode allows the cell to stay near the surface for a long time.
Kogure et al. (1998) reported the positive correlation between the probability of attachment to a glass surface and the swimming speed of V. alginolyticus. The results of our study may explain this phenomenon. The attractive force probably strengthens as the swimming speed increases. Therefore, a faster-swimming cell may stay longer near the surface. It is possible that remaining near the surface may result in an attachment of the cell to the surface. Therefore, we expect that the probability of attachment to the surface increases with the swimming speed. A few problems with this reasoning must be solved, such as the relationship between the attractive force to the surface (or the resident time near the surface) and the swimming speed, and the attachment mechanism of the swimming cell.
We stated in the Introduction that the CW flagellar rotation of V. alginolyticus plays a different role from that of peritrichously flagellated bacteria. This is always correct from a microscopic standpoint. It is also accurate when a cell swims far from any surface. However, it does not hold true near a surface from a macroscopic viewpoint. The backward swimming mode caused by CW flagellar rotation is functionally the same as the tumble mode of peritrichously flagellated bacteria since the cell turns only in a limited area. The “run-tumble” pattern seems to have an advantage in taxis response (see Fig. 12, e and f). However, the “run-back” pattern may have an advantage in spreading in a uniform environment (see Fig. 12, c and d). Monotrichously flagellated bacteria switch the run-back and run-tumble patterns depending on the distance from a solid surface at the moment. They appear to select their swimming pattern according to the function currently necessary. Some bacteria, including the Aeromonas, Azospirillum, Rhodospirillum, and Vibrio species, exhibit two flagellation patterns, single polar flagellation and peritrichous flagellation (Allen and Baumann, 1971; McCarter, 2004). Peritrichous flagella appear only when grown on solid media or in viscous environments (McCarter, 2001; Atsumi et al., 1996; Kawagishi et al., 1996). This bacterial strategy is reasonable, since the above-mentioned advantage would be lost if the planktonic cell had peritrichous flagella.
Does bacterial chemotaxis have no power in the bulk space of the ocean? Luchsinger et al. (1999) suggested that the swimming pattern of monotrichously flagellated bacteria was more suitable than that of peritrichously flagellated bacteria under turbulent conditions such as those in the ocean. The calculated result in this study also suggests that monotrichously flagellated bacteria have an advantage over peritrichously flagellated bacteria in the aspect of diffusion. Some marine bacteria swim faster than V. alginolyticus (up to 400 μm/s; Mitchell et al., 1995). It has been reported that the marine bacteria Pseudoalteromonas haloplanktis and Shewanella putrefaciens change their swimming speeds depending on the presence of the motile algae Pavlova lutheri, up to 445 μm/s in its presence and up to 126 μm/s in its absence (Barbara and Mitchell, 2003). Those bacteria may perform effective chemotaxis by combining an unknown strategy with a forward-backward swimming pattern.
Acknowledgments
We thank M. Homma for the bacterial strains, M. Sasou for instruction in chemical modification of a glass surface and measurement of the contact angle, K. Tou, Y. Urakawa, and K. Nakazawa for helping measure the bacterial motion, and S. Sugiyama, K. Kogure, and Y. Takano for helpful discussions.
This work was partly supported by the Grant-in-Aid for Scientific Research from the Japan Society for the Promotion of Science (No. 15560143).
Makoto Ichiba's present address is Environmental Systems Headquarters, Hitachi Zosen Corporation, Osaka, 559-8559, Japan.
Kousou Nakata's present address is Shin Nippon Air Technologies, Tokyo, 103-0021, Japan.
References
- Allen, R. D., and P. Baumann. 1971. Structure and arrangement of flagella in species of genus Beneckea and Photobacterium fischeri. J. Bacteriol. 107:295–302. [DOI] [PMC free article] [PubMed] [Google Scholar]
- Atsumi, T., Y. Maekawa, T. Yamada, I. Kawagishi, Y. Imae, and M. Homma. 1996. Effect of viscosity on swimming by the lateral and polar flagella of Vibrio alginolyticus. J. Bacteriol. 178:5024–5026. [DOI] [PMC free article] [PubMed] [Google Scholar]
- Azuma, A. 1992. The Biokinetics of Flying and Swimming. Springer-Verlag, Tokyo.
- Barbara, G. M., and J. G. Mitchell. 2003. Bacterial tracking of motile algae. FEMS Microbiol. Ecol. 44:79–87. [DOI] [PubMed] [Google Scholar]
- Berg, H. C., and D. A. Brown. 1972. Chemotaxis in Escherichia coli analysed by three-dimensional tracking. Nature. 239:500–504. [DOI] [PubMed] [Google Scholar]
- Blair, D. F. 1995. How bacteria sense and swim. Annu. Rev. Microbiol. 49:489–532. [DOI] [PubMed] [Google Scholar]
- Brown, D. A., and H. C. Berg. 1974. Temporal stimulation of chemotaxis in Escherichia coli. Proc. Natl. Acad. Sci. USA. 71:1388–1392. [DOI] [PMC free article] [PubMed] [Google Scholar]
- Chwang, A. T., and T. Y. Wu. 1971. A note on the helical movement of micro-organisms. Proc. Roy. Soc. Lond. B. 178:327–346. [DOI] [PubMed] [Google Scholar]
- Goto, T., S. Masuda, K. Terada, and Y. Takano. 2001. Comparison between observation and boundary element analysis of bacterium swimming motion. JSME Int. J. Ser. C. 44:958–963. [Google Scholar]
- Holwill, M. E. J., and R. E. Burge. 1963. A hydrodynamic study of the motility of flagellated bacteria. Arch. Biochem. Biophys. 101:249–260. [DOI] [PubMed] [Google Scholar]
- Homma, M., H. Oota, S. Kojima, I. Kawagishi, and Y. Imae. 1996. Chemotactic responses to an attractant and a repellent by the polar and lateral flagellar systems of Vibrio alginolyticus. Microbiol. 142:2777–2783. [DOI] [PubMed] [Google Scholar]
- Kawagishi, I., M. Imagawa, Y. Imae, L. McCarter, and M. Homma. 1996. The sodium-driven polar flagellar motor of marine Vibrio as the mechanosensor that regulates lateral flagellar expression. Mol. Microbiol. 20:693–699. [DOI] [PubMed] [Google Scholar]
- Kogure, K., E. Ikemoto, and H. Morisaki. 1998. Attachment of Vibrio alginolyticus to glass surface is dependent on swimming speed. J. Bacteriol. 180:932–937. [DOI] [PMC free article] [PubMed] [Google Scholar]
- Kudo, S., N. Imai, M. Nishitoba, S. Sugiyama, and Y. Magariyama. 2005. Asymmetric swimming pattern of Vibrio alginolyticus cells with single polar flagella. FEMS Microbiol. Lett. 242:221–225. [DOI] [PubMed] [Google Scholar]
- Luchsinger, R. H., B. Bergersen, and J. G. Mitchell. 1999. Bacterial swimming and turbulence. Biophys. J. 77:2377–2386. [DOI] [PMC free article] [PubMed] [Google Scholar]
- Macnab, R. M. 1987. Motility and chemotaxis. In Escherichia coli and Salmonella typhimurium. J. Ingraham, K. B. Low, B. Magasanik, M. Schaechter, H. E. Umbarger, and F. C. Neidhardt, editors. American Society for Microbiology, Washington, DC. 732–759.
- Magariyama, Y., S. Masuda, Y. Takano, T. Ohtani, and S. Kudo. 2001. Difference between forward and backward swimming speeds of the single polar-flagellated bacterium, Vibrio alginolyticus. FEMS Microbiol. Lett. 205:343–347. [DOI] [PubMed] [Google Scholar]
- Magariyama, Y., S. Sugiyama, K. Muramoto, I. Kawagishi, Y. Imae, and S. Kudo. 1995. Simultaneous measurement of bacterial flagellar rotation rate and swimming speed. Biophys. J. 69:2154–2162. [DOI] [PMC free article] [PubMed] [Google Scholar]
- Magariyama, Y., S. Sugiyama, K. Muramoto, Y. Maekawa, I. Kawagishi, Y. Imae, and S. Kudo. 1994. Very fast flagellar rotation. Nature. 371:752. [DOI] [PubMed] [Google Scholar]
- McCarter, L. 2001. Polar flagellar motility of the Vibrionaceae. Microbiol. Mol. Biol. Rev. 65:445–462. [DOI] [PMC free article] [PubMed] [Google Scholar]
- McCarter, L. L. 2004. Dual flagellar systems enable motility under different circumstances. J. Mol. Microbiol. Biotechnol. 7:18–29. [DOI] [PubMed] [Google Scholar]
- Mitchell, J. G., L. Pearson, A. Bonazinga, S. Dillon, H. Khouri, and R. Paxinos. 1995. Long lag times and high velocities in the motility of natural assemblages of marine bacteria. Appl. Environ. Microbiol. 61:877–882. [DOI] [PMC free article] [PubMed] [Google Scholar]
- Nishitoba, M., Y. Magariyama, and S. Kudo. 2003. Bacterial flagellar deformation observed by laser dark-field microscopy. Proc. 2nd Int. Symp. Aqua Biomech, Honolulu. 1–5.
- Ogawa, H., and E. Tanoue. 2003. Dissolved organic matter in oceanic waters. J. Oceanogr. 59:129–147. [Google Scholar]
- Ramia, M. D., L. Tullock, and N. Phan-Thien. 1993. The role of hydrodynamic interaction in the locomotion of microorganisms. Biophys. J. 65:755–778. [DOI] [PMC free article] [PubMed] [Google Scholar]
- Sasou, M., S. Sugiyama, T. Yoshino, and T. Ohtani. 2003. Molecular flat mica surface silanized with methyltrimethoxysilane for fixing and straightening DNA. Langmuir. 19:9845–9849. [Google Scholar]
- Takano, Y., K. Yoshida, S. Kudo, M. Nishitoba, and Y. Magariyama. 2003. Analysis of small deformation of helical flagellum of swimming Vibrio alginolyticus. JSME Int. J. Ser. C. 46:1241–1247. [Google Scholar]