

Abstract
Diffusion of a G-protein coupled receptor, μ-opioid receptor (μOR), in the plasma membrane was tracked by single-fluorescent molecule video imaging and high-speed single-particle tracking. At variance with a previous publication, where gold-tagged μOR was found to be totally confined within a domain, which in turn underwent very slow diffusion itself, we found that μOR undergoes rapid hop diffusion over membrane compartments (210-nm and 730-nm nested double compartments in the case of normal rat kidney cell line), which are likely delimited by the actin-based membrane-skeleton “fence or corrals” and its associated transmembrane protein “pickets”, at a rate comparable to that for transferrin receptor (every 45 and 760 ms on average, respectively), suggesting that the fence and picket models may also be applicable to G-protein coupled receptors. Further, we found that strong confinement of gold-labeled μOR could be induced by the prolonged on-ice preincubation of the gold probe with the cells, showing that this procedure should be avoided in future single-particle tracking experiments. Based on the dense, long trajectories of μOR obtained by high-speed single-particle tracking, the membrane compartments apposed and adjoined to each other could be defined that are delimited by rather straight boundaries, consistent with the involvement of actin filaments in membrane compartmentalization.
INTRODUCTION
The structure of the cell membrane at a very basic level can be described by the fluid-mosaic model proposed by Singer and Nicolson more than 30 years ago (1972). However, membrane proteins and lipids undergo diffusion in the plasma membrane at a rate 5–50 times slower than those found in artificial reconstituted membranes (Chang et al., 1981; Lindblom et al., 1981; Peters and Cherry, 1982; Swaisgood and Schindler, 1989; Lee et al., 1993; Ladha et al., 1997; Schütz et al., 2000), and such a vast reduction cannot be explained by the presence of the physiological levels of membrane proteins and cholesterol (Peters and Cherry, 1982; Fujiwara et al., 2002). Clearly, there must be some long-range ordering mechanisms that retard the diffusion of membrane molecules in the plasma membrane (Saxton, 1989a,b, 1990; Sheetz, 1993; Jacobson et al., 1995; Kusumi and Sako, 1996; Fujiwara et al., 2002; Edidin, 2003). Furthermore, many membrane molecules exhibit large reductions in the diffusion rate upon clustering (Iino et al., 2001; Suzuki and Sheetz, 2001; Shvartsman et al., 2003), which cannot be explained by a two-dimensional continuum model of the cell membrane: as predicted by Saffman and Delbrück (1975), and later experimentally confirmed by Peters and Cherry (1982) and Vaz et al. (1982), in the two-dimensional continuum liquid, clustering should only exert very minor effects on the translational diffusion rate. Again, some higher-order organizing mechanisms for the plasma membrane that do not exist in protein-lipid reconstituted membranes are clearly required for explaining the extensive slowing effect of clustering on membrane molecules. Elucidating mechanisms for such slowing effects would be important for understanding the signal transduction mechanism in the cell membrane (Murakoshi et al., 2004). Upon the ligand binding, many receptor molecules form clusters and subsequently induce the binding of cytoplasmic signaling molecules. The diffusion rates of these signaling complexes are often greatly reduced as compared to those for the receptors before ligation (Felsenfeld et al., 1996; Holowka and Baird, 1996; Bray, 1998).
Recently, Fujiwara et al. (2002) investigated this issue by using both single-fluorescent molecule video imaging (SFVI) (Schütz et al., 2000; Iino et al., 2001; Sako et al., 2001; Vrljic et al., 2002, 2005; Lommerse et al., 2004) and single-particle tracking (SPT) (Saxton and Jacobson, 1997) with time resolutions of up to 25 μs. They found that both an unsaturated phospholipid, 1,2-dioleoyl-sn-glycero-3-phosphorylethanolamine (DOPE), and a transmembrane protein, transferrin receptor (TfR), are confined within compartments of 230 nm on average for short timescales. On longer timescales, both molecules undergo hop movements among adjacent compartments, which were termed hop diffusion. The average residency time of DOPE in a compartment was 13 ms, which is shorter than that of TfR (65 ms) by a factor of 5 (Fujiwara et al., 2002, reported an 11-ms residency time, but recently, it turned out that 13 ms may be a better value (T. Fujiwara, unpublished observation)). They found that the membrane skeleton is primarily responsible for such temporary confinement, although the DOPE marker lipid that they observed was located in the outer leaflet of the membrane and could not directly interact with the membrane skeleton. Based on these observations, they proposed the anchored membrane-protein “picket” model (Fig. 1 a, right), in which various transmembrane proteins anchored to the actin-based membrane skeleton effectively act as rows of pickets lined up along the membrane skeleton, due to the effects of steric hindrance and hydrodynamic frictionlike effects (Bussell et al., 1995; Dodd et al., 1995). Such compartmentalization of the cell membrane and hop diffusion of the phospholipid molecules among the compartments were found in all of the eight cultured cell lines we examined thus far (Murase et al., 2004).
FIGURE 1.

Proposed mechanism for the compartmentalization of the plasma membrane for the translational diffusion of transmembrane proteins and lipids in the membrane: corralling by the membrane-skeleton “fences” and the anchored-protein “pickets”. (a, left) The membrane-skeleton “fence” or “corral” model in which transmembrane proteins are confined within the mesh of the actin-based membrane skeleton. Transmembrane proteins protrude into the cytoplasm, and in this model, their cytoplasmic domains collide with the membrane skeleton, which induces the temporary confinement of transmembrane proteins in the membrane-skeleton mesh. (a, right) Anchored-protein “picket” model. Various transmembrane proteins anchored to and lined up along the actin-based membrane skeleton effectively act as rows of pickets against the free diffusion of lipids and proteins in the cell membrane due to steric hindrance and the hydrodynamic frictionlike effects of immobilized proteins. Fences would act on transmembrane proteins, whereas pickets would act on both lipids (including lipid-anchored proteins) and transmembrane proteins. Therefore, transmembrane proteins are corralled by both fences and pickets. In both models, membrane proteins and lipids can hop from a compartment to an adjacent one, probably when thermal fluctuations of the membrane and the membrane skeleton create a space between them large enough to allow the passage of integral membrane proteins, when an actin filament temporarily breaks, and/or when membrane molecules have sufficient kinetic energy to cross the barrier when they are in the boundary region. (b) A model of nested double compartmentalization of the NRK cell membrane. DOPE and TfR undergo free diffusion inside a 210–260-nm compartment (for the simplicity of the presentation, we simply use 260 nm here) for an average of 13 and 65 ms, respectively, and then hop to an adjacent compartment. Besides these 210-nm compartments, larger 710–750-nm compartments (we use 710 here) containing the 210-nm compartments exist, although the confining effect is weaker (Murase et al., 2004). The residency time within the 710-nm compartment is 0.41 s for DOPE and 0.53 s for TfR on average, respectively. In this article, we found that the same mechanism works for a GPCR, μ-opioid receptor (μOR), hopping over 210- and 730-nm nested double compartments with residency times of 45 ms and 0.76–1.6 s, respectively. This gives further support for the fence and picket models, with average compartment sizes of 210 nm and 730 nm. Therefore, the larger compartment may contain 11 smaller compartments, on average.
The large difference in compartmental residency time within a compartment between DOPE (13 ms) and TfR (65 ms) was explained by the additional effect of the membrane skeleton on transmembrane proteins. The cytoplasmic domain of the transmembrane protein collides with the membrane skeleton, which induces temporal confinement of the transmembrane proteins within the membrane skeleton mesh (membrane skeleton “fence” or “corralling” model) (Fig. 1 a, left)(Sheetz, 1983; Kusumi et al., 1993; Sako and Kusumi, 1994, 1995; Tomishige et al., 1998). With regard to the mechanisms for the intercompartmental hops, see the reviews (Kusumi and Sako, 1996; Kusumi et al., 2004, 2005) and other reports (Tsuji et al., 1986, 1988; Edidin et al., 1991, 1994; Sako and Kusumi, 1994, 1995; Sako et al., 1998; Tomishige et al., 1998).
Therefore, the diffusion in the cell membrane is slow, not because the diffusion per se is slow (the diffusion rates within a compartment are as large as those found in artificial (cholesterol-free) reconstituted membranes, which excludes the presence of the further smaller compartments within the 30–250-nm compartments and the direct involvement of cholesterol for the large reduction of the diffusion coefficients in the cell membrane from those found in artificial membranes, see Pralle et al., 2000; Kenworthy et al., 2004; and Vrljic et al., 2005), but because it takes time to hop across the compartment boundary between adjacent compartments. Slowing of receptor diffusion upon clustering can also be explained by the presence of these “rows of pickets” and the membrane skeleton “fences”. Hence, monomeric receptors may hop across the compartment boundaries quickly, whereas receptor clusters would take much longer to hop due to their increased size (for the cluster to hop across the boundary, all of the molecules have to hop at the same time), which would dramatically decrease the macroscopic diffusion rate with an increase in the cluster size (“oligomerization-induced trapping” as proposed by Kusumi and Sako, 1996, Iino et al., 2001, and Kusumi et al., 2005).
However, Daumas et al. (2003) recently reported that a G-protein coupled receptor (GPCR), μ-opioid receptor (μOR), was almost totally confined within a domain (with almost no probability of escape, i.e., no hop movements) that itself underwent very slow diffusion. This observation was made using SPT (at 25 Hz or 40-ms time resolution, a European video rate) of a colloidal gold probe with a 40 nm diameter, by way of a T7-tag fused to μOR at its N-terminus (extracellular domain) and an anti-T7 monoclonal IgG antibody. They proposed a “walking confined diffusion model”, in which the long-term confinement of μOR may be caused by the “long-range attractive interaction between membrane proteins”, with the form of a quadratic potential, rather than by the membrane-skeleton-based “pickets” and “fences”.
Their results raised a number of important questions. Since basically all of the molecules incorporated in the membrane should sense the presence of rows of pickets anchored and lined up along the membrane skeleton, how can their long-range attractive interaction model be reconciled with the anchored-protein picket model? Are the total confinement and the confinement mechanism characteristic of GPCRs, or are they unique to μOR, in that most of the molecules are stationary, or undergo extremely slow diffusion in the cell membrane? How can these results be reconciled with the fact that GPCRs rapidly move to the internalization apparati in the cell membrane and become internalized upon ligation (Laporte et al., 1999; Santini et al., 2002)?
Our investigation was undertaken to critically investigate these questions, using the same receptor and the same cell type (normal rat kidney cell line) used by Daumas et al. (2003). We paid special attention to the probe preparation and the method of attaching these probes to the cells. Furthermore, in addition to carrying out SPT at video rate (in our case at 30 Hz or at a 33-ms resolution), we performed SFVI at video rate, as well as high-speed SPT at 40 kHz (25-μs resolution, enhanced from the video rate by a factor of 1350).
MATERIALS AND METHODS
Cell culture, drug treatment, and transfection
Normal rat kidney fibroblasts (NRK, a cell line) and Chinese hamster ovary (CHO) cells were grown in Ham's F12 medium (GIBCO, Grand Island, NY) supplemented with 10% fetal bovine serum. Cells used for the experiment were transfected with the cDNA encoding rat μOR tagged with green fluorescent protein (GFP, a gracious gift from Dr. Schülz, Institute of Pharmacology, University of Munich, Germany; Schülz et al., 2002) that bears the monomeric mutation of A206K (mGFP) at the C-terminus of μOR (μOR-mGFP), or with myc or T7 epitopes at the N-terminus (myc-μOR or T7-μOR, respectively). Cells transiently expressing these fusion proteins were cultured on 18 × 18-mm coverslips for 1 day after plating. The treatment of cells with latrunculin B was done by incubating the cells in Hanks' balanced salt solution medium containing 50 nM latrunculin B (Spector et al., 1983) under the microscope observation at 37°C for 2 min and the observation was continued for up to 10 min.
Preparation of colloidal gold probes
The myc-tagged μOR expressed on the NRK cell surface was first labeled with anti-myc-Fab, and then the cells were further incubated with protein G-coated colloidal gold particles (40 nm) to label the complex of the anti-myc-Fab and the myc-tagged μOR on the NRK cell surface (see the next section for further details). The anti-myc-Fab was prepared from anti-myc-IgG (9E10). The T7-tagged μOR was labeled by colloidal gold particles conjugated with anti-T7 antibody (whole) IgG. The minimal protecting amounts (MPA, defined as the minimum concentration of the protein needed to stabilize colloidal gold particles in suspension) of protein G (Sigma, St. Louis, MO) and anti-T7-antibody IgG (Novagen, Darmstadt, Germany) were determined to be 1.0 and 2.5 μg/ml, respectively (De Mey, 1983; Leunissen and De Mey, 1989). For the preparation of colloidal gold coated with the MPA of protein G, a 50 μl aliquot of 10 μg/ml protein G in 2 mM phosphate buffer (pH 7.2), was mixed with a 500 μl suspension of colloidal gold (pH 7.4) on a slowly tumbling shaker overnight at 4°C. Colloidal gold probes coated with 1/100 MPA of the anti-T7-antibody (Daumas et al., 2003) were prepared in a similar way. The gold probes were further stabilized with 0.02% Carbowax 20M (Sigma). After three washes by sedimentation and resuspension in 0.02% Carbowax 20M, in 20 mM phosphate buffer (pH 7.0), the gold probe was resuspended in Hanks' balanced salt solution buffered with 2 mM PIPES at pH 7.2, sterilized by filtration with a 0.22-μm filter (Millipore, Bedford, MA), and then used within 3 h.
SPT of gold-tagged μOR and SFVI of μOR-mGFP
For the observations of the myc-μOR, first, the anti-myc Fab (2 μg/ml final concentration) was incubated with NRK cells expressing the myc-tagged μOR, which were cultured on coverslips, and then after washing the cells, gold probes conjugated with protein G were applied to the cells. Note that protein G can monovalently bind to a Fab fragment of the anti-myc antibody (IgG1) (Derrick and Wigley, 1994; Perosa et al., 1997). All observations of the gold probes were carried out at 37°C within 15 min after the application of the gold probes to the cells. Generally, limiting the period from the application of gold probes until the microscope observation to within 15 min, and carrying out all experiments at 37°C, were very effective for reducing the number of gold particles exhibiting slow diffusion or immobilization. Under these conditions, an average of ∼10 protein G-gold particles/cell were attached to the cell membrane. In contrast, only ∼1.5 gold particles/cell were found on the cell surface on average, when gold particles without protein G conjugation were used or when the anti-myc Fab incubation step was omitted. These results indicate that specific labeling of myc-μOR molecules was achieved under these conditions.
For the observations of T7-μOR, gold probes conjugated with the 1/100 MPA of anti-T7 antibody were applied to NRK cells expressing T7-μOR at room temperature, and the observations of the gold probes on the cell membrane were immediately started at 37°C. To examine the outcome of the protocol employed by Daumas et al. (2003), we also followed their experimental procedure, which basically differs from ours in only one key point: they employed a prolonged (45 min), on-ice preincubation of the cells with anti-T7 gold particles. After this incubation period, the gold particles were observed at 37°C during next 30 min. The instrumentation and actual observation methods for SPT and SFVI are described in the Supplementary Material.
Obtaining the trajectories of membrane molecules and the plots of mean-square displacement versus time
Positions (x and y coordinates) of the selected gold particles were determined by a computer that employs the method developed by Gelles et al. (1988). For each particle's trajectory, the mean-square displacement (MSD), 〈Δr(Δt))2〉, for every time interval (Eq. 1) was calculated according to the formula (Sheetz et al., 1989; Qian et al., 1991; Kusumi et al., 1993):
 |
(1) |
where δt is the video frame time and x(jδt + nδt), y(jδt + nδt) describes the particle position following a time interval Δtn = nδt after starting at position (x(jδt), y(jδt)), N is the total number of frames in the video recording sequence, n and j are positive integers, and n determines the time increment.
To keep the statistical spread in the MSD within reasonable levels, μOR-mGFP trajectories >1 s (30 video frames) and gold-tagged μOR trajectories over 300 frames were used for the quantitative analysis (Saxton, 1994, 1996).
Analysis of high-speed SPT trajectories
Statistical classification of each trajectory into either simple Brownian type or confined + hop type diffusion was carried out as described (Kusumi et al., 1993; Fujiwara et al., 2002). Note that all of the statistical and quantitative analyses were performed without any arbitrary or intentional subdivisions of the obtained trajectories. For example, the results shown in Fig. 4 c obtained for 4000-step trajectories were directly obtained from the raw 4000-step trajectories, or when a part of a longer trajectory was used, the trajectory for the first 4000 steps was used.
FIGURE 4.
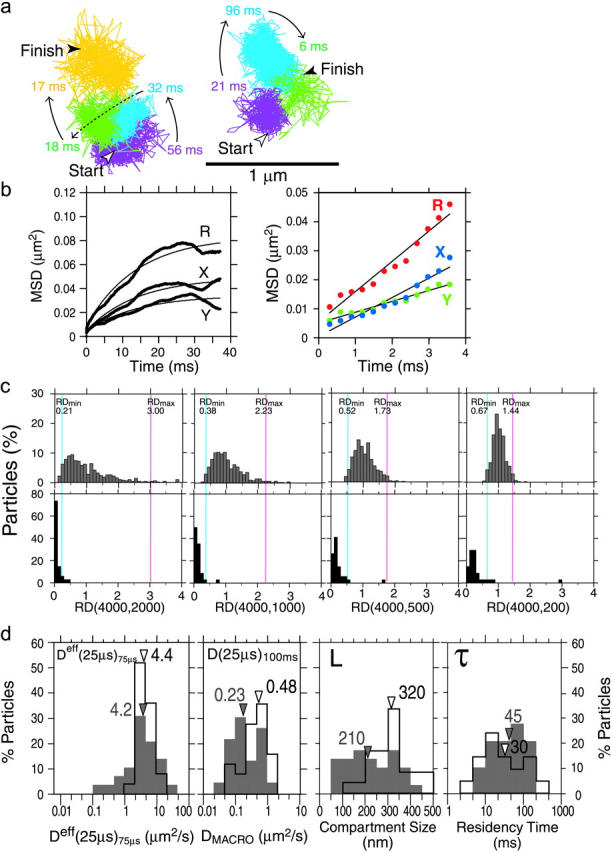
Gmyc-μOR observed at a 25-μs resolution undergoes hop diffusion over 210-nm compartments. (a) Representative trajectories of Gmyc-μOR. Each color (purple, blue, green, yellow) represents a plausible compartment detected by computer software (Fujiwara et al., 2002). The residency time within each compartment is shown. It is comparable to the frame time of normal video rate (33 ms), exemplifying why such hop movements cannot be visualized by normal video observations. (b, left) An MSD-Δt plot (25-μs resolution) for the trajectory shown in a, left. It was fitted to a theoretical curve representing hop diffusion (Powles et al., 1992). The fit parameters include L, Dmicro, and DMACRO, and the residency time can be calculated from L and DMACRO (L2/4DMACRO). X, Y, and R indicate diffusion in the x and y directions and in a two-dimensional plane, respectively. The software always selects the direction of the longest overall movement as the x axis. For further details of the analysis, see the subsection of “Analysis of high-speed SPT trajectories” in the Materials and Methods section. (b, right) An example of a MSD-Δt plot (25-μs resolution) for the trajectory with short total observation periods (300 frames = 7.5 ms) and the short analysis time window (150 frames = 3.75 ms). This indicates that the analysis of diffusion in such a short time range may not be adequate for the detection of hop diffusion of membrane molecules (average compartment size = 210 nm; average residency time = 45 ms). (c) The distributions of RD(N, n) for Gmyc-μOR (bottom) are quite different from those expected from simple Brownian particles (generated by Monte Carlo simulations, top). Here, N is fixed at 4000 and n is varied (2000, 1000, 500, and 200 steps corresponding to analysis time windows of 50, 25, 12.5, and 5 ms, respectively). For the classification of the trajectories into different diffusion modes, RD(4000, n) values that give 2.5% of the particles from both ends of the distribution, referred to as RDmin(4000, n) and RDmax(4000, n), as shown by vertical blue and magenta lines, respectively, were used (Kusumi et al., 1993; also see the text). When a particle exhibits an RD(4000, n) smaller than RDmin(4000, n), its trajectory is classified into the confined + hop diffusion mode. The majority of Gmyc-μOR trajectories are classified into this mode as seen in these histograms. (d) Histograms of Deff(25 μs)75 μs (determined by the linear fit between the second (50-μs) and the fourth (100-μs) points based on the data of 25-μs/frame, first box), DMACRO (D(25 μs)100 ms, second box), the compartment size (third box), and the residency time (fourth box) (n = 34)(shaded bars) (the latter three determined by the hop fit). The average residency time within a compartment for each trajectory was calculated based on DMACRO and the compartment size determined for each trajectory, using the equation of L2/4·DMACRO. To further confirm the involvement of the membrane skeleton, the cells were very mildly treated with latrunculin B (50 nM final concentration for 2–12 min; during this period, all the measurements were performed) to slightly increase the actin-based membrane skeleton mesh (open bars). Arrowheads indicate the median values.
One might wonder if classification into the confined + hop diffusion mode (using a statistical analysis developed by Kusumi et al. (1993)) may be possible for hop trajectories without intentionally preselecting the right portion of the trajectory that is indicative of the confinement within a compartment, rather than using the whole or the arbitrary part of the trajectories. If such an intentional operation (preselection of specific parts of the trajectories) had been employed, it would have totally defeated the purpose of the statistical analysis. The fact was that we carried out the statistical analysis for the whole trajectory or the initial part of the trajectory when a part of the longer trajectory was used for the analysis, and that in the case of μOR in the NRK cell membrane, as shown in the Results and Discussion section (see Fig. 4 c in particular), almost all of the trajectories were classified into the confined + hop diffusion mode. Qualitatively, this can be explained as a direct result that the plasma membrane is compartmentalized everywhere, and if one has the right time resolution and sufficient number of points at that time resolution, every part of the trajectory (which has to be sufficiently long, as described by Kusumi et al. (1993)) should show the confinement (this argument also depends on the compartment size and hop rate; compartment size must be sufficiently small and/or the hop rate is sufficiently slow). This is also intuitively expected from a totally different perspective: since the ratio of Dmicro versus DMACRO for the smaller 210-nm compartments turned out to be as large as ≈20 in the present case (see Supplementary Material, Text 4), the detection of diffusion anomaly is expected to be easy.
The determination of the diffusion coefficients for membrane molecules in the cell membrane is complex because they strongly depend on the total length of the observation, the timescales used for the analysis, and the time resolution employed for the observation in complex ways. This already strongly indicates the anomaly in the molecular diffusion in the cell membrane. In our investigation, the above experimental parameters are systematically varied.
For the analysis of the trajectories obtained by using high-speed SPT (with 25-μs or 8-ms resolutions), the MSD-Δt plots were fitted with a home-made program based on the hop diffusion theory of Powles et al. (1992; termed “hop fit” in this article; Fujiwara et al., 2002; Murase et al., 2004). All the parameters for the hop diffusion were evaluated by the computer program using the theory developed by Powles et al., who determined the exact solution of the time evolution of the probability distribution due to diffusion through an infinite array of equally spaced, semipermeable barriers. In their analysis, the time evolution of the probability distribution depends on three parameters: the distance between barriers, L, the true diffusion coefficient in the absence of barriers, Dmicro, and the permeability of the barriers, P. They also derive a relationship between the permeability and the long-term diffusion coefficient, DMACRO, DMACRO/Dmicro = [1 + (PL)−1]−1, which puts their solution into measurable quantities.
The second moment of the probability distribution gives the mean-squared displacement of a particle diffusing through the infinite array of barriers, which is further averaged over all possible starting positions between two barriers. Fitting to experimental data, independently in two orthogonal directions, reveals estimates for the compartment size ( where
where  and
and  are the compartment sizes determined in each direction), microscopic (short-term) diffusion coefficient (Dmicro = (1/2)(Dmicro, x + Dmicro, y), where Dmicro, x and Dmicro, y are the short-term diffusion coefficients determined in each direction) and the macroscopic (long-term) diffusion coefficient (DMACRO = (1/2)(DMACRO, x + DMACRO, y), where DMACRO, x and DMACRO, y are the long-term diffusion coefficients determined in each direction). The average residency time is determined from the average compartment size,
  and the average macroscopic diffusion coefficient,
  as
as 
Compartment detection was performed through the following algorithm. Consider a starting point in the trajectory at frame m extending over a window of the next n frames. Within this window, the center of geometry of the distribution of the recorded locations is determined and the maximum radial displacement from this center  in this window is determined. This maximum displacement is used to produce an apparent diffusion coefficient for this window of data through
  where
where  is the time differential between consecutive points in the trajectory. For free Brownian diffusion,
  is constant (allowing for statistical variations) independent of m or n. If a molecule is temporarily trapped in a finite compartment, then as the window size n increases,
  decreases due to the confinement within a compartment. When the window size increases enough to include a hop to an adjacent domain, there is a sharp increase in
  due to the extended range of diffusion. By scanning all possible m and n pairs over the trajectory, a map of
  can be produced. Hops are flagged by persistent sharp increases in
  for both a given starting position (e.g., if position m is before a hop and
  is after a hop, then for all window sizes n,
  will be greater than
  ) or for the combination of starting position and window size (e.g., if the trajectory starting from position m with a window size n, ending at a point
  is wholly within one compartment and if extending the window size by 1 includes a hop to an adjacent compartment is included, then
  will be greater than
  for all m and n such that
  ).
).
One might wonder if the computer program developed by Simson et al. (1995) for the detection of “transient confinement zones” can be used to detect the membrane compartments described in this article. This software detects the part of the trajectory where a molecule stays much longer than expected from the overall average diffusion coefficient. We tried to use or modify this program in the hope to detect the membrane compartments described here. However, it has never worked for the detection of these compartments that may exist everywhere in the trajectory: the temporal fraction of the transient confinement zone that μOR exhibited at a 25-μs resolution was <0.1%, much less than that found in simple Brownian trajectories generated by Monte Carlo simulations (our computer program was made based on the program obtained from Jacobson (Simson et al., 1995) and tested for the trajectories obtained by Dietrich et al. (2002) for its proper implementation and usage). This result is somewhat expected: in the trajectories obtained at higher time resolutions, the molecule is basically confined everywhere, which is reflected in the long-term diffusion coefficient. Therefore, if this long-term diffusion coefficient is used for the detection of membrane compartments, because this diffusion coefficient already includes the confinement effect of the compartments, the program detects only the compartments where the molecule stays much longer than in others. For the differences between the membrane compartments and the transient confinement zones, the readers are referred to a review published by our group (Box 1 in Kusumi et al., 2004).
RESULTS AND DISCUSSION
μOR diffusion observed by SPT and SFVI at video rate
All of the microscopic observations were carried out at 37°C, unless otherwise stated. Fig. 2, a and b, show typical trajectories of gold-tagged myc-μOR (Gmyc-μOR) and gold-tagged T7-μOR (GT7-μOR), respectively, observed at video rate in the NRK cell membrane using SPT. We employed these two methods for gold labeling (via myc and T7 tags) for the following reasons:
If the same results are obtained with different methods of labeling, then the credibility of the data is greatly enhanced.
For a direct comparison with the data generated by Daumas et al. (2003), the same T7-epitope and the same anti-T7-antibody IgG had to be used.
However, since the affinity of the anti-T7 antibody for T7 is extremely high, with a dissociation constant on the order of 2 pM (Daumas et al., 2002, 2003), we were afraid that such a high-affinity antibody could easily cause cross-linking of μOR, leading to receptor aggregation and long-term confinement within a single compartment. However, the affinity of the Fab fragment of the anti-myc antibody to the myc epitope is close to the average level (on the order of 80 nM, Schiweck et al., 1997), and thus we decided to additionally use the myc epitope for the present research.
FIGURE 2.

Typical trajectories of gold-tagged μOR obtained by SPT and those of μOR-mGFP obtained by single fluorescent molecule video imaging (SFVI), both recorded at a 33-ms resolution (video rate) (a–c) SPT trajectories for 10 s. (a) Gmyc-μOR. (b) GT7-μOR. (c) GT7-μOR after attaching the gold probes to the cell surface by a preincubation with the cells on ice for 45 min, and then washing away the unbound gold particles (microscope observation at 37°C, as in all other experiments). This procedure was adopted following Daumas et al. (2003). In a and b, gold probes were added to the NRK cells expressing μOR at room temperature, and were instantly observed under the microscope at 37°C (without removing the unbound gold particles, which may later bind to the cell surface during the observation. Since the gold particles in the cell-culture medium are moving rapidly in the medium, they do not form distinct images on the camera, and thus do not block observations of the cell surface), which is the standard protocol in our laboratory and the Sheetz laboratory at Columbia University, New York (personal communication, 2004; Felsenfeld et al., 1996). d SFVI of μOR-GFP. The lengths of the trajectories are indicated beneath them in seconds (video frames). They vary due to mGFP-photobleaching. (e) Mean-square displacement (MSD) of the gold-μOR complex, averaged over all particles in the full scale of 10 s (left) and 0.3 s (right). Blue circles, Gmyc-μOR; green circles, μOR-mGFP; red circles, GT7-μOR, including a prolonged cold preincubation period. In the left figure, due to the presence of many small circles (spots), they almost look like lines.
Compare the typical trajectories of gold-tagged μOR (via myc or T7 epitopes, Fig. 2, a and b) with those for μOR-mGFP observed using SFVI shown in Fig. 2 d (due to photobleaching of mGFP, the duration of observation of a single μOR-mGFP is limited as indicated beneath each trajectory; the lengths of the SPT trajectories (shown in Fig. 2, a–c) are 10 s). These trajectories clearly indicate that μOR molecules are not semipermanently confined in submicron areas. In fact, during only 1–3 s, both the gold-tagged μOR (Fig. 2, a and b) and μOR-mGFP covered regions much greater than that found in the 2 min-trajectories shown by Daumas et al. (2003, see Fig. 1 of their article). Virtually, all of the μOR molecules were mobile on the cell surface, including those on the lamellipodial membranes.
Quantitative analysis of single-molecule diffusion of μOR observed at video rate
Plots of the MSD averaged over all observed particles (of the same kind) against time are shown in Fig. 2 e (SPT data during 10 s are on the left, and the comparison of SPT and SFVI data during 0.3 s is on the right). Fig. 2 e on the right shows that Gmyc-μOR (blue) and μOR-mGFP (green) exhibited very similar MSD-Δt plots during 0.3 s. This result indicates that as long as we remain in a timescale <0.3 s, the possible detrimental slowing effect of gold particles, perhaps due to nonspecific interactions with membrane lipids, proteins, and extracellular matrices, cross-linking μOR molecules, and cross-linking μOR and other molecules, is undetectable (as shown later in Fig. 3, as long as we remain in a timescale <0.5 s (rather than 0.3 s), the effects of gold are undetectable). This result is consistent with our earlier observations using trypsin to remove the extracellular domains of membrane-associated proteins and extracellular matrix proteins (Fujiwara et al., 2002; Murase et al., 2004).
FIGURE 3.

Distributions of the effective diffusion coefficients in time windows of 67–133 ms (Deff(33 ms)100 ms, left column), 67–500 ms (Deff (33 ms)250 ms, middle column), and 67 ms-3 s (Deff(33 ms)1.5 s, right column) based on video-rate observations; 33 ms is not shown in this figure to avoid too much crowding in labels. Note that all of the determinations here were done by linear fitting in the MSD-Δt plot for given durations. Each row shows the results with different probes: from the first row to the fourth row, SPT data on Gmyc-μOR, GT7-μOR, and GT7-μOR after a prolonged cold preincubation, as done by Daumas et al. (2003), and SFVI data for μOR-mGFP. In all cases, the trajectories >30 frames (1 s) were analyzed for better statistics of the diffusion coefficient (Saxton, 1994, 1996, i.e., μOR-mGFP trajectories <1 s were not used for analysis). Arrowheads indicate the median values (the numbers of inspected particles or molecules are shown in the histograms for Deff(33 ms)100 ms). Long black arrows in the histograms in the third row indicate the results reported by Daumas et al. (2003) for the mean values of Deff(40 ms)40 ms or DMACRO for GT7-μOR using a prolonged cold incubation for the attachment of gold particles on the cell surface. In the histogram for Deff(33 ms)100 ms of μOR-mGFP (fourth row, green), the distribution of Deff(33 ms)100 ms of mGFP fixed on the coverglass surface is also shown (open histogram). Most of the mGFP molecules on the glass showed the nominal D100 ms values distributed in the range of <0.02 μm2/s, with a median value of 0.0052 μm2/s. Therefore, the diffusion coefficients <0.02 μm2/s were (operationally) classified as being immobile, as indicated in yellow. The lower-limit of the diffusion coefficients that can be evaluated by SPT was 0.0003 μm2/s (at video rate, Kusumi et al., 1993).
Almost all of these trajectories exhibited the MSD-Δt plots (those for individual trajectories) could be fit by straight lines, suggesting that both Gmyc-μOR and μOR-mGFP observed at video rate undergo the simple Brownian diffusion mode. However, this in reality is due to the lack of time resolution, and diffusion anomaly is hidden, which is one of the major topics of this article (Figs. 4–7 and the related text). Therefore, one has to realize that the simple Brownian nature of the diffusion of Gmyc-μOR and μOR-mGFP found here is only “apparent”.
FIGURE 5.

A long-term trajectory of Gmyc-μOR obtained at a 25-μs resolution indicated the nested double compartmentalization of the NRK cell membrane and enabled determination of membrane compartments. (a) A typical long-term trajectory of Gmyc-μOR, recorded at a 25-μs resolution for a period of 1.77 s (70,800 frames). Larger compartments were identified in b and reproduced here. After the blue compartment, the particle went back to the purple compartment, but this part was omitted here because the trajectory would become very complicated. (b) A time-lapse trajectory at a frame rate of 8 ms/frame, produced from the trajectory in a by selecting a point out of every 325 consecutive points. Plausible compartments were identified by a computer program, and are shown in different colors: purple, 1.44 s; and blue, 0.33 s. The instance of the hop is shown in black. (c) In these larger 730-nm compartments (for this size, see Fig. 6 and the related text), smaller nested compartments (210-nm subcompartments) can be detected. The trajectory in a, containing 70,800 frames, was divided into 11 subtrajectories. For easier inspection, time-lapse trajectories at a frame rate of 0.5 ms are shown (sampling every 20 frames). Individual plausible compartments are color-coded (the full trajectory at a 0.5 ms resolution is shown in light gray and blue), and the residency time within each compartment is indicated beneath each subtrajectory in the same color (color coding in the order of purple-blue-green-yellow-red and then purple again; note that the plausible compartments were determined using the raw 25-μs resolution subtrajectories). Individual smaller (210-nm) compartments are indicated by dashed black ellipses in the upper row, which we propose based on the trajectory and the hopping points detected by computer software. Note that even in compartments where the determined points appear sparse, there are actually 20 times more determined points based on the 25-μs/frame data. The problems in determining these compartments are summarized in the text. Based on these elliptic compartments, compartment boundaries with slightly, gradually curved lines are proposed (in the bottom two rows of subtrajectories). Since this could be done reasonably well (see the far right figure in the bottom row, where both the elliptic compartments and the proposed mesh structure are superimposed), individual compartments are indexed using the quasi x and y coordinates (see the text for details). Thicker broken lines are proposed boundaries for larger compartments. The thick black line between the yellow [2, 2] and the red [1, 1] indicate the hop trajectory between two large compartments. The hop trajectory is not exactly located on the proposed boundary, but is located closely to the boundary line. (d) The third subtrajectory in c reproduced in full detail (25-μs resolution).
FIGURE 6.

Gmyc-μOR observed at an 8-ms resolution exhibited hop diffusion over the larger 730-nm compartments. (a) Representative trajectories of Gmyc-μOR recorded at an 8-ms time resolution for a period of 4 s. Different colors (purple, blue, and green) indicate different plausible compartments. These compartments were detected by computer software we developed (see the Materials and Methods section; Fujiwara et al., 2002). (b) The distribution of the microscopic diffusion coefficient within larger compartments (also representing the hop diffusion rate over smaller compartments), Deff(8 ms)100 ms, the compartment size (L), and the residency time (τ) determined for the larger compartments using 4-s trajectories at the time resolution of 8 ms (a total of 55 particles were examined). Deff(8 ms)100 ms was determined in the MSD-Δt plot (for the trajectories obtained at an 8-ms resolution) by linear fitting between the eighth (64-ms) and 17th (136-ms) points. The compartment size and the residency time were determined for each trajectory using the same methods described for the 25-μs trajectories using the equation of L2/4·DMACRO.
FIGURE 7.

The plot of log(MSD/time) against log(time), covering over five orders of magnitude in time. Trajectories used for this plot were obtained at time resolutions of 25 μs (4,000-frame long, blue circles), 8 ms (500-frame long, orange circles), and 33 ms (300-frame long, red circles). The mean values of log(MSD/time) averaged over all of the trajectories obtained at the same time resolution were plotted as a function of log(time). The standard error is shown for each point. The fit using the five lines is based on the assumption of nested double compartmentalization (see the text).
The apparent simple-Brownian diffusion can be characterized by a single parameter, the “effective diffusion coefficient”. Namely, under limited conditions of the time resolution and the analysis time window (i.e., the long-term regime in Fig. 7), the MSD-Δt curve can be linearly fit, and only under these circumstances, the diffusion can “effectively” be described by an “effective diffusion coefficient”, given by the slope of the plot (divided by 4, by definition). In our report, we specifically use the term the “effective diffusion coefficient” to indicate such cases, and designate it with indices of the midpoint of the linear fitting and the time resolution as Deff(time resolution)midpoint, like Deff(33 ms)100 ms, Deff(33 ms)250 ms, Deff(33 ms)1.5 s, Deff(8 ms)100 ms, and Deff(25 μs)75 μs. In particular, Deff(33 ms)100 ms and Deff(25 μs)75 μ used here correspond to D2–4 defined in Kusumi et al. (1993), for time resolutions of 33 ms and 25 μs, respectively, i.e., a value determined by linear fitting between the second and fourth points (the problem of including the single-step mean-square displacement for evaluation of diffusion coefficient, like the linear fitting between the zero (origin) and the second points is discussed in the Supplementary Material, Text 1).
Since many fluorescence recovery after photobleaching (FRAP) studies have been conducted based on the theory of simple Brownian diffusion (+ immobile component), the diffusion coefficients obtained by FRAP must be thought to be “effective diffusion coefficient”. For the further details of the problems of FRAP diffusion measurements, particularly the issue of long tails that may be difficult to be distinguished from the immobile component, see Nagle (1992), Feder et al. (1996), and Saxton (1994, 1996, 2001).
In Fig. 3, Deff(33 ms)100 ms, Deff(33 ms)250 ms, and Deff(33 ms)1.5 s are used, which were determined by the linear fit in the time range between 67 ms (the second point in the MSD-Δt plot) and 133 ms (the fourth point), 500 ms (15th point), or 3 s (90th point), respectively; but to save the space in the figure, (33 ms) was omitted in the figure label. Fig. 3 shows the distributions of effective diffusion coefficients determined for single particles of gold-μOR (from SPT data) and single molecules of μOR-mGFP (from SFVI data) for video-rate observations (note that these distributions contain, in addition to the measurement noise, the true distributions of the diffusion coefficient reflecting the local environment and interactions as well as unavoidable statistical fluctuations; Saxton, 1997). A common feature for all of these probes is that the effective diffusion coefficient decreases with the lengthening of the time window. Although a complete explanation requires the high-speed SPT data described below, and thus full details will be given later, here, to advance the argument, we simply state our interpretation (which will be justified later): “This common feature is consistent with the short-term confinement within a compartment and the long-term hop diffusion over compartments (at an average hop rate of once every 45 ms, as described later). Furthermore, we assume that the diffusion coefficient within a compartment is comparable to the fast diffusion rate found in artificial reconstituted membranes, which is on the order of 3–10 μm2/s (Murase et al., 2004; also see below). Therefore, the effective diffusion coefficients obtained at time windows of 0.1, 0.5, and 3 s are mixtures of the fast diffusion within a compartment and slow hop diffusion between the compartments, with the weight of the fast diffusion coefficient within a domain decreasing (thereby the averaged effective diffusion rate decreasing) with an increase of the time window (consistent with the results shown in Fig. 3). Thus, a comparison of effective diffusion coefficients shown in Fig. 3 only makes sense when it is made with the same time window, and thus we pay special attention to this point (if the diffusion observed here were truly simple Brownian diffusion, then the time window would not matter)”.
Comparison of μOR's long-term diffusion coefficients obtained by different probes and methods
The effective diffusion coefficients determined in the time ranges of 100 ms, 500 ms, and 3 s are shown in Fig. 3 and Table 1, which should be compared with those obtained by Daumas et al. (2003).
TABLE 1.
Diffusion coefficients for μ OR and other GPCRs at 37°C, observed by single-molecule techniques at video rate or estimated by FRAP. Data in the timescales >100 ms are listed
|
Deff (μm2/s), mean ± SD‖
|
|||||||
|---|---|---|---|---|---|---|---|
| Reference | GPCR | Cell (N*) | Probe/method | Cold binding‡ | 100 ms | 250 ms | 1.5 s, longer |
| Daumas et al. (2003) | T7-μOR | NRK (?) | Gold/SPT | Yes (45 min) | 0.013 | ND† | 0.0013 (±0.0024) |
| This work | T7-μOR | NRK (57) | Gold/SPT | no | 0.20 (±0.15) | 0.18 (±0.15) | 0.12 (±0.19) |
| This work | T7-μOR | NRK (94) | Gold/SPT | Yes (45 min) | 0.032 (±0.032) | 0.015 (±0.015) | 0.011 (±0.015) |
| This work | μOR | NRK (57) | mGFP/SFVI | NA† | 0.25 (±0.20) | 0.24 (±0.25) | ND |
| This work | μOR | CHO (97) | mGFP/SFVI | NA | 0.14 (±0.10) | 0.10 (±0.09) | ND |
| Daumas et al. (2003) | T7-μOR | CHO (NA) | F-T7-Fab/FRAP§ | NA | ND | ND | 0.005 (±0.002) |
| (No statement on the immobile fraction) | |||||||
|
|
GPCR
|
Cell
|
Probe/method
|
Immobile fraction (%)
|
 mean ± SD mean ± SD
|
||
| Horvat et al. (1999) | LHR¶ | CHO | GFP/FRAP | 57 | 0.16 (±0.035) | ||
| Nelson et al. (1999) | GRHR¶ | CHO | GFP/FRAP | 25 | 0.12 (±0.02) | ||
| Nelson et al. (1999) | GRHR¶ | αT3 | GFP/FRAP | 20 | 0.12 (±0.06) | ||
| Young et al. (2001) | BR¶ | KNRK | GFP/FRAP | 20 | 0.48 (?) | ||
N, number of particles.
NA, not applicable; ND, not determined.
Preincubation of NRK cells with gold probes on ice for 45 min.
FRAP experiments by Daumas et al. were carried out at 22°C.
LHR, luteinizing hormone receptor 3; GRHR, gonadotropin-releasing hormone receptor 2; BR, bombesin receptor 1.
 were determined in the MSD-Δt plot (for the trajectories obtained at video rate for 300 frames (10 s)) by linear fitting between the second point and the fourth, 15th, and 90th points, respectively. Note that the diffusion coefficients listed here are mean values, whereas those shown in Fig. 3 are median values. SD (standard deviation) includes true variations in the diffusion coefficient in the membrane and unavoidable statistical variations (Saxton, 1997) as well as experimental errors.
First, compare the distributions for Gmyc-μOR (first row in Fig. 3) with those for GT7-μOR (second row in Fig. 3), which was employed by Daumas et al. (2003). In all three time windows ( 100 ms, 250 ms, and 1.5 s, corresponding to left, middle, and right columns, respectively), the distributions of gold-tagged or GFP-labeled molecules are basically similar to each other (the differences are statistically insignificant), suggesting that the high affinity of the anti-T7 antibody is not likely to be the cause for the long-term confinement of μOR.
Second, in Fig. 3, compare the distributions of Deff (33 ms)100 ms and Deff(33 ms)250 ms (first and second columns) for gold-tagged μOR (first and second rows) with those for μOR-mGFP (bottom row, green histograms). The distributions are practically the same (statistically insignificant differences), suggesting that, in our hands, the gold probes are not causing serious reductions in the diffusion of μOR molecules in NRK cells, as long as we remain in the analysis time range in the MSD-Δt plot <0.5 s.
Third, compare the diffusion rate of μOR-mGFP with the rates of other GPCRs reported previously (Table 1). The immobile fractions of GPCRs in the FRAP experiments are ∼20%, except for the case of luteinizing hormone receptor 3 expressed in CHO cells (57%). In the case of μOR, Daumas et al. (2003) did not explicitly report the immobile fraction in their FRAP experiment. The SFVI results for μOR-mGFP obtained here suggest the presence of ∼5–10% of an immobile fraction (estimated from the distributions of Deff(33 ms)100 ms and Deff(33 ms)250 ms), in the sense that their apparent movement cannot be distinguished from the fluorescent spots of immobile mGFP molecules adsorbed on the glass surface, due to the observation noise, for which Deff(33 ms)100 ms is <0.02 μm2/s (see the yellow region in the bottom row of figures in Fig. 3, and the Materials and Methods section).
The diffusion coefficients for the mobile component of GPCRs in the previous FRAP experiments (Table 1), which are likely to represent the macroscopic diffusion coefficient measured over a micron domain in the time window of 0.5–10 s, are between 0.12 and 0.48 μm2/s, 24–100 times greater than the FRAP diffusion coefficient measured by Daumas et al. (2003). However, the FRAP diffusion coefficients for other GPCRs are consistent with the present μOR data for Deff(33 ms)250 ms and Deff(33 ms)1.5 s in both the SPT and SFVI results (Fig. 3), further supporting the results obtained in our investigation.
Daumas et al. (2003) somehow compared the SPT data obtained in NRK cells with the FRAP data obtained in CHO cells, finding that, as described above, the diffusion of μOR is also very slow in CHO cells. Therefore, we also observed the diffusion of μOR-mGFP expressed in CHO cells and compared the results with those in NRK cells, examining the possibility that the diffusion of μOR-mGFP is slow in CHO cells. The diffusion coefficients were only slightly smaller in CHO cells than those in NRK cells (Table 1).
The diffusion coefficients found in the plasma membrane of cultured cells summarized in Table 1 are smaller, by a factor of 10–15, than those reported for bacteriorhodopsin (a GPCR-like protein with seven transmembrane domains) in reconstituted membranes in the liquid-crystalline phase (Peters and Cherry, 1982). This suggests that there may be a slowing mechanism in the cell membrane that does not exist in reconstituted membranes of lipids and transmembrane proteins, and that could not be observed by video-rate observations (see the high-speed SPT results presented later).
Effect of prolonged on-ice preincubation of colloidal gold probes with the cells
Next, we carefully looked for differences between our protocol and that employed by Daumas et al. (2003). According to their protocol, for gold labeling of μOR on the NRK cell surface, the cells were incubated with the gold particles conjugated with anti-T7 antibody (we followed their procedure exactly for the preparation of gold probes) on ice for 45 min, and then the temperature was raised to 37°C (22°C in some cases) for microscopic observations. In most cases, we start our microscopic observations at 37°C right after the addition of gold particles at room temperature, in the presence of gold particles in the medium, and as new gold particles become bound to the cell surface, we tend to observe the newly attached particles (Fujiwara et al., 2002; Nakada et al., 2003; Murase et al., 2004). This procedure is the same as that employed in the Michael Sheetz laboratory at Columbia University, New York (personal communication, 2004; Felsenfeld et al., 1996). Therefore, we thought that the prolonged cold preincubation of the gold probes with the cells might have caused the artifactual cross-linking and/or nonspecific binding. To test this hypothesis, we also carried out on-ice preincubation of gold probes with the cells for 45 min, and observed the movement of GT7-μOR.
Typical trajectories of GT7-μOR observed after the cold preincubation are shown in Fig. 2 c (red trajectories). Compare these trajectories with those shown in Fig. 2 b. Those obtained after the prolonged cold preincubation exhibited much less mobility. The MSD-Δt curves in the time windows of 10 s (left) and 0.3 s (right) displayed in Fig. 2 e also show the very limited mobility of GT7-μOR (note the very shallow slopes of red circles) after the cold preincubation. Likewise, Deff(33 ms)100 ms, Deff(33 ms)250 ms, and Deff(33 ms)1.5 s for the cold-preincubated GT7-μOR shown in Fig. 3 (third row) exhibited greatly reduced diffusion coefficients, with the mean values reduced from those for GT7-μOR without cold preincubation by factors of ≈8, 12, and 14, respectively, and from those for μOR-mGFP by factors of ≈11 and 17, respectively (p < 0.0001 for all of the above cases. Also see Table 1 and  in Fig. 3, third row and third column). These results indicate a prolonged on-ice incubation step likely causes slowed diffusion and immobilization of μOR.
These results strongly suggest that the prolonged cold preincubation of gold probes with the cells is at least partially responsible for the artifactual long-term confinement of μOR found previously. Based on these observations, we strongly recommend that prolonged cold incubations of gold probes with the cells be absolutely avoided, and that the observations of gold particles on the cell surface be carried out and finished quickly (for example, within 15 min after the application of the gold probes) in the presence of gold particles in the medium (without washing unbound gold particles away), which are in dynamic equilibrium with those attached on the cell membrane.
High-speed SPT of gold-tagged μOR revealed its hop diffusion over the plasma membrane compartments, consistent with the results found for DOPE and TfR
The μOR diffusion coefficients in the NRK cell membrane measured at video rate were smaller than those measured for bacteriorhodopsin (another seven-path transmembrane protein) in reconstituted membranes (Peters and Cherry, 1982) by a factor of as large as 10–15, suggesting the presence of slowing mechanisms in the cell membrane that could not be resolved by video-rate observations. Since single molecules of μOR-mGFP cannot be observed at very high time resolutions, we had to depend on SPT with gold tags, and thus used Gmyc-μOR. The use of such large gold particles can be justified (in the time window of 500 ms or shorter) because, as described, Gmyc-μOR gave the same effective diffusion coefficient as μOR-GFP in these time windows. Therefore, the diffusion of Gmyc-μOR on the cell surface was observed at a 25-μs resolution (1350-fold enhanced from the normal video rate). The precision of the particle's coordinate determination at this time resolution was 17 nm (Fujiwara et al., 2002).
Typical trajectories of Gmyc-μOR observed at a 25-μs resolution are shown in Fig. 4 a, which suggest the occurrence of hop diffusion, as described previously (Fujiwara et al., 2002). From the trajectory on the left (slightly >100 ms, containing more than 4,000 positions determined every 25 μs), the MSD-Δt curve in the time range up to 37.5 ms was obtained using Eq. 1 (Fig. 4 b, left). It increases rapidly near time 0, but the slope appears to gradually decrease to a certain value.
A statistical method for classifying each trajectory into simple Brownian, confined, directed, or stationary modes, based on the MSD-Δt plot, has been described by Kusumi et al. (1993), and used here. This method employs a parameter RD(N, n), which describes the long-term deviation of MSD(N, n) from the expected MSD at time nδt (n = number of frames, δt = frame exposure time) from the initial slope of the MSD-Δt plot, assuming that the trajectory is a simple Brownian one (4Dmicronδt), i.e., RD(N, n) = MSD(N, n)/4Dmicronδt. Here, N is the full length (in image frames) of the trajectory being examined. In the case of molecules undergoing simple Brownian diffusion, the average value of RD(N, n) is 1, but the individual trajectories of Brownian particles would show a statistical spread around 1. Using Monte Carlo simulation, we generated 500 4000-step trajectories (here N is 4000), and the distributions of the RD(4000, n) were obtained for various n values (time windows used for the analysis; see the Materials and Methods section for further details). These distributions are shown in Fig. 4 c (top) for n values of 2000, 1000, 500, and 200 (analysis time windows of 50, 25, 12.5, and 5 ms, respectively). For the classification of the trajectories into different diffusion modes, RD(4000, n) values that give 2.5% of the particles from both ends of the distribution, referred to as RDmin(4000, n) and RDmax(4000, n), were determined as described by Kusumi et al. (1993) (shown in Fig. 4 c by vertical blue and magenta lines, respectively; note that N is fixed to 4000 for the convenience of the presentation, but as long as it is sufficiently long to include at least one hop event within the trajectory on average, the exact value of N does not matter as much as n, as shown by Kusumi et al., 1993)).
See Fig. 4 c, bottom. The histograms show the distributions of RD(4000, n) for Gmyc-μOR trajectories. Note that trajectories observed longer than 4000 frames were used for the analysis (the initial 1–4000 steps were used for the analysis for all the trajectories), without any arbitrary or intentional subdivision of the trajectory (which would defeat the whole purpose of this statistical analysis). These distributions are totally different from those established for simulated simple Brownian trajectories shown on the top row. Based on the numerical criterion using RDmin(N, n) and RDmax(4000, n), it was found that >90% of the Gmyc-μOR trajectories were categorized into the confined mode. Readers must be aware that, in our trajectory classifications protocol, we have never intentionally preselected portions of the trajectories or subdivided the longer trajectories into pieces of subtrajectories that appear to represent the motion within a compartment, since such a preselection of a part of the trajectory would totally defeat the purpose of the statistical analysis: when the trajectories of (for example) 4000 frames were needed for the analysis, 4000-step trajectories were experimentally obtained, or when longer trajectories were used, the initial 1–4000 steps were used.
One might wonder why such a straightforward classification method works even for hop diffusion trajectories (and not limited to totally confined diffusion; of course, the trajectories used for the analysis have to be sufficiently long to sense the presence of the compartment boundaries). This is likely due to a direct consequence of two characteristics of Gmyc-μOR diffusion in the plasma membrane:
The plasma membrane is compartmentalized everywhere, and if one has the right time resolution and sufficient number of points at that time resolution, every part of the trajectory (again, N has to be sufficiently long to detect the confinement as described by Kusumi et al., 1993) should exhibit the confinement.
The residency time within a compartment is sufficiently long to be statistically differentiated from simple Brownian diffusion cases. In fact, successful statistical detection of temporary confinement of Gmyc-μOR within a compartment was expected in a simplistic way: as described below, since the ratio of Dmicro versus DMACRO for 210-nm compartments is as large as ≈20 for Gmyc-μOR, detection of diffusion anomaly should not be difficult.
Due attention should be paid to the time resolution (the observation density in time) and the time window used for analysis (as well as the total period for the observation) when the MSD-Δt curve is used for the analysis of trajectories. For example, a MSD-Δt curve based on the experiments employing conditions like a time resolution of 0.30 ms and an analysis time window of 3.75 ms out of a 7.5-ms trajectory is not uncommon in the literature. Such a display was simulated in Fig. 4 b, right, using the initial 300-step part of the trajectory shown in Fig. 4 a, left. Finding any indication of leveling off may be difficult in this display (thus the linear fit appears sufficient as shown): the time window used for the analysis is too short and the plot is too coarse for the detection of leveling off or confinement of a molecule in a compartment. This indicates that to detect the confined or hop diffusion characteristics of single molecules or particles diffusing in the plasma membrane, one has to carefully vary the time resolution and the analysis time window before reaching any conclusions.
To quantitatively analyze the trajectories obtained at a 25-μs resolution (like those shown in Fig. 4) for the evaluation of the compartment size and the residency time within a compartment, the “hop fit” for the MSD-Δt plots in the time range (time window) between 0.05 and 25 ms (1000 frames) was performed with the total observation period of 100 ms (4000 frames) as described in the Materials and Methods section. The adjustable parameters for the hop fit were Dmicro (the diffusion coefficient within a compartment), DMACRO (the macroscopic rate of diffusion hopping over many compartments), and the compartment size L. Note that for the successful hop fitting, the time window has to be chosen so that the contributions from Dmicro and DMACRO are balanced; although the time range used for the curve fitting here is 25 ms in the MSD-Δt plot, the curve in this time range contains information for the whole 100-ms trajectory because in the MSD calculation, all possible pairs of the determined points in the trajectory are used (see the Methods section, Kusumi et al., 1993), and therefore, residency times within a compartment >25 ms can be detected. If the residency time is much >25 ms, DMACRO will hardly contribute to the determination of the MSD-Δt curve, which makes the accuracy of the evaluation of DMACRO much worse, and thus the time window for the fitting has to be lengthened.
Since DMACRO is a generic term and may refer to the diffusion coefficient in various time scales in different contexts (note that the term DMACRO is only used when it was estimated using the hop fit; in our study, DMACROS were determined based on the observations made at time resolutions of 0.025, 2, and 8 ms, by using trajectories with durations of 0.1, 3, and 4 s, respectively; see Table 2), we use a D(time resolution)the length of the full trajectory like D (25 μs)100 ms in this article to indicate the time resolution and the length of the trajectory whenever the meaning of DMACRO might be confusing.
TABLE 2.
Parameters for the hop diffusion of Gmyc-μOR (before and after 50 nM latrunculin treatment) along with those for TfR, a transmembrane protein, and DOPE, an unsaturated phospholipid, at time resolutions of 33, 8, 2, and 0.025 ms (25 μs).
| Compartment size (median)
|
|||||||
|---|---|---|---|---|---|---|---|
| Time resolution (ms) | Hop + confined (%) | DMACRO¶ (median) (μm2/s) | diameter† (nm) | area‡ (μm2) | Corrected residency time§ (ms) | N* | |
| μOR | 33 | 21 | 0.12‖ | NA | NA | NA | 75 |
| 8 | 85 | 0.082‖ | 730 | 0.41 | 760 | 55 | |
| 0.025 | 91 | (0.23‖) | 210 | 0.035 | 45 | 34 | |
| μOR (latB) | 0.025 | 90 | (0.48‖) | 320 | 0.079 | 30 | 30 |
| TfR** | 33 | 83 | 0.047 | 710 | 0.40 | 530‖ | 70 |
| 0.025 | 94 | 0.26 | 260 | 0.054 | 65 | 107 | |
| DOPE** | 2 | 94 | 0.22 | 750 | 0.44 | 410‖ | 84 |
| 0.025 | 85 | 1.1 | 230 | 0.043 | 13 | 90 | |
Number of examined particles.
The diameter of a compartment was determined as (LxLy)1/2, where Lx and Ly are the lengths of the confinement area in the x and y directions, respectively.
The area was determined as A = (π/4)LxLy (area of an ellipse whose major and minor axes are Lx and Ly, respectively).
The “corrected” residency times shown here are not those determined directly from the observations of gold-tagged molecules, but those calculated from the macroscopic diffusion rates (median value) of fluorescently tagged molecules, i.e., μOR-mGFP ( Cy3-TfR (0.24 μm2/s, from Fujiwara et al., 2002) and Cy3-DOPE (0.42 μm2/s, from Fujiwara et al., 2002), and the compartment sizes obtained by gold-tagged molecules (median values, listed above). This way, the reduction of the hop rate due to low levels of cross-linking by gold probes will not affect the evaluation of the correct hop rate or the residency time.
DMACROs, except that at a 33-ms resolution were estimated by the hop fit (see the Materials and Methods section) in the MSD-Δt plots based on the trajectories of 0.1, 3, and 4 s obtained at time resolutions of 0.025, 2, and 8 ms (typical timescales in the MSD-Δt plots of 10–40, 400, and 720 ms), respectively. DMACRO at the time resolution of 33 ms was  obtained by linear fitting of the MSD-Δt plot between the second (66 ms) point and the 90th (3 s) point for 10-s trajectories.
DMACROs for Gmyc-μOR at time resolutions of 33 ms and 8 ms ( respectively) are smaller than that obtained by 0.025-ms resolution observations (D(25 μs)100 ms = 0.23 μm2/s), because the length of the trajectories for the latter is only 100 ms and is likely to reflect more of the diffusion rate within the 730-nm compartment, whereas the former two diffusion coefficients are likely to represent the hop diffusion rate over larger compartments. The difference between
  in their estimated values may be due to experimental errors.
Data from Fujiwara et al. (2002). This article reported 11-ms residency time for DOPE, but after a lot more examinations, it turned out that the correct value is close to 13 ms (T. Fujiwara, K. Iwasawa, and A. Kusumi. unpublished observation), and the value 13 ms is listed above as the residency time for DOPE for the smaller compartment.
The distribution of D(25 μs)100ms (DMACRO) is shown in the second box in Fig. 4 d (median = 0.23 μm2/s), which is similar to that for Deff(33 ms)100 ms shown in Fig. 3 (video-rate data, median = 0.24 μm2/s). These results indicate that the data obtained at video rate and at a 25-μs resolution are consistent with each other. Furthermore, D(25 μs)100 ms thus obtained was also similar to the diffusion coefficient estimated by linearly fitting the MSD-Δt curves of a 25-μs resolution in the long-time regime, between the 400th and 4000th (10- and 100-ms) points (0.15 μm2/s).
Fig. 4 d (third box, shaded bars) shows the distribution of the compartment size (L), which was determined for each Gmyc-μOR particle from the MSD-Δt plot (like the one shown in Fig. 4 b, left). The median compartment size is 210 nm for NRK cells, which is consistent with the 230 nm found for an unsaturated phospholipid (DOPE) and with the 260 nm determined for TfR (a transmembrane protein, native dimer) in the same NRK cell line (also see Supplementary Material, Text 2). This result strongly supports the membrane skeleton “fence” and “picket” models.
The average residency time within a compartment for each trajectory was calculated based on DMACRO and the compartment size determined for each trajectory, using the equation of L2/4DMACRO. The distribution of the μOR's residency time within a compartment is shown in Fig. 4 d (fourth box, shaded bars). The median residency time was 45 ms, which is between that for DOPE (13 ms) and TfR (65 ms) (Fujiwara et al., 2002), and thus is generally consistent with our previous observations.
μOR diffusion data after mild latrunculin treatment further support the GPCR hop diffusion over the membrane compartments
To further confirm the involvement of the membrane skeleton in the hop diffusion of μOR, the cells were very mildly treated with latrunculin B (50 nM final concentration) (Spector et al., 1983). The treatment was carried out under microscopic observation at 37°C, and after incubating the cells for 2 min, the collection of single-molecule dynamics data on Gmyc-μOR was initiated and continued for up to another 10 min. Note that these conditions are substantially milder than those employed in most other biochemical, biophysical, or cell biological studies, because our intention was not to wipe out the F-actin from the cytoplasmic surface of the membrane, but to modestly increase the compartment size by inducing slight actin depolymerization (see Supplementary Material, Fig. S1 and its caption).
The distributions of Deff(25 μs)75 μs (its distribution and the average value is basically the same as those for Dmicro determined by the hop fit), DMACRO (D(25 μs)100 ms], the compartment size (L), and the residency time (τ), before and after the mild latrunculin treatment, are shown in the shaded and open bars, respectively, in Fig. 4 d. DMACRO (second box) and the compartment size (third box) were increased by factors of ∼2 and ∼1.5 (in median values), respectively (p < 0.001 for both cases). The median value for the residency time was decreased by 30%, but this was statistically insignificant. These results are consistent with a model in which the compartment boundaries are formed by the actin-based membrane skeleton and its associated proteins, i.e., the membrane skeleton “fences” and transmembrane protein “pickets” anchored to and lined up along the membrane skeleton. Meanwhile,  was not increased significantly after partial actin depolymerization (Fig. 4 d, first box), further supporting the idea that the latrunculin-induced increase of DMACRO was not caused by changes in the membrane viscosity, but by the slight increases of the compartment size. Furthermore, we have recently carried out the three-dimensional reconstruction of the membrane skeleton structure using electron tomography (N. Morone, J. Usukura, S. Yuasa, and A. Kusumi, unpublished data), and found that the compartment size found by diffusing molecules in the plasma membrane and the mesh size of the membrane skeleton on the cytoplasmic surface of the plasma membrane agree well in both NRK cells and FRSK cells, which exhibited very different compartment sizes for the confinement of membrane molecules (230 and 40 nm, respectively; Murase et al., 2004; see Supplementary Material, Text 3).
By the reasons detailed in the supporting information (the caption to Supplementary Materials, Fig. S2, “Bouncing of μOR at the compartment boundaries considerably reduces the (apparent) diffusion coefficient within a compartment when the compartment size is small, and thus the value of the observed diffusion coefficient 4.2 μm2/s provides the lower limit estimation of the correct free diffusion coefficient of μOR”), the correct value for the diffusion coefficient within a compartment may be slightly greater. We estimate the correct average value to be between 4.5 and 6 μm2/s.
These results are totally at variance with the data reported by Daumas et al. (2003), who basically reported very slow macroscopic diffusion without any hop movements. However, assuming that their probes reported the movement of aggregated molecules including μOR, their results are consistent with the presence of membrane-skeleton fences and transmembrane protein pickets immobilized on and lined up along the membrane skeleton fence. In the absence of such pickets and fences, the thermal diffusion of the clusters of membrane molecules would not be suppressed as much as that observed by Daumas et al. (2003), as described by Saffman and Delbrück (1975), Peters and Cherry (1982), and Vaz et al. (1982).
Nested double compartmentalization for μOR diffusion in the NRK cell membrane
Fujiwara et al. (2002) reported that the plasma membrane of the NRK cell is unique in that, in addition to the 230-nm membrane compartments, larger 750-nm compartments that include the 230-nm compartments within them are present (see Fig. 1 b). Namely, the NRK cell membrane has nested double compartments all over the cell membrane. Murase et al. (2004) further examined diffusion of an unsaturated phospholipid DOPE in other six cell types, and found such nested double compartmentalization only in NRK cells (although the plasma membranes of all of these cells were compartmentalized).
To examine if such nested double compartmentalization is observable with μOR (or Gmyc-μOR), long-term observations of Gmyc-μOR at a time resolution of 25 μs, for a period >1.7 s (68,000 consecutive images) were carried out. Fig. 5 a shows a typical trajectory of Gmyc-μOR, recorded at a time resolution of 25 μs for a period of 1.77 s (70,800 frames). Fig. 5 a represents the raw data, and in Fig. 5 b, the trajectory produced from the raw data by selecting a point every 325 consecutive points, corresponding to a time lapse recording of 8 ms/frame (still >4 times faster than the normal video rate), is shown. The presence of two greater compartments was found in the trajectory shown in Fig. 5 b by detecting the instance of an intercompartmental hop (shown in black) using a computer program (Fujiwara et al., 2002; see the end of the Materials and Methods section), and the same compartments are shown in the trajectory in Fig. 5 a. This method of varying the coarseness of the observation frequency is particularly useful, when more than two characteristic time scales coexist. The development of a computer program to detect double compartmentalization and to directly evaluate the parameters for double compartmentalization in trajectories such as the one shown in Fig. 5 a would be overly complicated. The results of actual experimental observations at a time resolution of 8 ms are described in the next section (Fig. 6).
Characterization of the larger compartments in the NRK cell membrane detected by μOR diffusion
The 8-ms time-lapse trajectory generated from the 25-μs resolution trajectory shown in Fig. 5 b suggests that the frame rate of 8 ms/frame may be a useful resolution, at which the effects of smaller compartments are averaged out (because the median residency time is 45 ms, the smaller compartment cannot be detected at a time resolution of 8 ms, and the hop diffusion over the small compartments is smeared out to look as if it were slow simple Brownian diffusion), and yet there are a sufficient number of frames within a larger compartment so that its presence can be detected. Therefore, we experimentally observed Gmyc-μOR diffusion at a time resolution of 8 ms for 4 s (500 total frames).
Fig. 6 a shows representative trajectories for 4 s with the individual plausible compartments identified by a computer program color-coded in the order of purple-blue-green. A statistical analysis (Kusumi et al., 1993; Fujiwara et al., 2002) classified 85% of the trajectories into the hop + confined-type diffusion mode, with the remaining 15% into the simple Brownian mode (Table 2). Dmicro for larger compartments should also be close to the macroscopic hop diffusion coefficients over the smaller 210-nm compartments (see Fig. 1 b). Since the average hop rate between smaller compartments was once every 45 ms, Dmicro for larger compartments was determined by linear fitting of the MSD-Δt plot (for the trajectories obtained at an 8-ms resolution) between the 8th (64 ms) point and the 17th point (136 ms), and thus (taking the midpoint) designated as 
 was determined to be 0.15 μm2/s (median, Fig. 6 b), again very similar to the Deff(33 ms)100 ms shown in Fig. 3 (video-rate data, second row, first column) and the D(25 μs)100 ms shown in Fig. 4 d (second box, shaded bars), indicating that the data obtained at 33, 8, and 0.025 ms resolutions are consistent with each other.
DMACRO (D(8 ms)4 s) determined by the hop fit was 0.082 μm2/s (median) by using the 4 s trajectories and the MSD-Δt plots in the time range of 720 ms (Table 2). This value is consistent with Deff(33 ms)1.5 s (median = 0.12 μm2/s; Fig. 3, first row, third column). The distributions of the compartment size and the residency time for each trajectory, determined by the same methods used for the 25-μs trajectories, are shown in Fig. 6 b. Their median values are 730 nm and 1.6 s, respectively. This compartment size agrees well with the compartment sizes determined for DOPE (750 nm) and TfR (710 nm), supporting the membrane skeleton fence (corralling) model and the anchored-protein picket model. This also confirms the nested double compartmentalization of the NRK cell membrane found with TfR and DOPE.
The residency time for Gmyc-μOR determined here may not be correct for nonlabeled μOR, due to the perturbation by the colloidal gold probes. This effect can be largely corrected using the long-term diffusion coefficient for μOR-mGFP, instead of that for gold-tagged μOR. Since the observed residency time (median) for Gmyc-μOR is 1.6 s, it would be good to obtain μOR-mGFP trajectories longer than 1.6 s, and perhaps >4 s from the distribution of the residency time shown in Fig. 6 b (third box). However, as shown in Figs. 2 d and 3 (bottom row), since obtaining a statistically sufficient number of μOR-mGFP trajectories >1.6 or 4 s is quite difficult due to photobleaching, we used Deff(33 ms)250 ms (which was estimated from trajectories longer than 1 s) as the long-term diffusion coefficient for the μOR-mGFP hop diffusion. This will overestimate the true long-range diffusion coefficient for hop diffusion over the larger compartments, but it will probably be a reasonable approximation because it reflects motion for 1 s or longer, and the Deff(33 ms)1.5 s for gold-tagged molecules is reduced by only 20–30% from Deff(33 ms)250 ms. (As described previously, the diffusion rate for Gmyc-μOR may be the same as that for μOR-mGFP, as long as we remain within time windows <0.5 s (Fig. 3), but we are not certain if this holds for longer timescales (because we do not have μOR-mGFP data for longer times due to mGFP photobleaching).) Therefore, we assume that the median diffusion rate of μOR in the 4 s timescale (to be compared to D(8 ms)4 s for the Gmyc-μOR used to obtain the residency time shown in Fig. 6 b) is the same as that of Deff(33 ms)250 ms for μOR-mGFP (0.18 μm2/s, Fig. 3, bottom).
Using this value and the compartment size of 730 nm (the compartment size should not be strongly affected by μOR clustering, and thus the value obtained from the Gmyc-μOR results was employed), we obtained an overall average residency time of 0.76 s ((0.73)2/4 × 0.18). Due to the use of the overestimated long-term diffusion coefficient (Deff(33 ms)250 ms for μOR-mGFP), the true value for the μOR residency time within a larger compartment is likely to lie between 0.76 and 1.6 s. The median residency times in the larger NRK membrane compartments for DOPE and TfR are, respectively, 410 and 530 ms (using Deff(33 ms)1.5 s for Cy3-DOPE and Cy3-Tf-TfR, respectively) (Fujiwara et al., 2002), which generally agree with the 760 ms for μOR found here.
Despite these results, we point out that detecting the larger compartment is a more subtle issue than finding the smaller compartments. Further description of this point is given in the Supplementary Material, Text 4.
Anomaly analysis of μOR diffusion covering a timescale over 5 orders of magnitude
Diffusion anomaly is often discussed using the relationship MSD = Cta (0 ≤ α ≤ 1, C = constant), where α parametrizes the level of anomaly (Saxton, 1994, 1996; Feder et al., 1996; Sheets et al., 1997; Simson et al., 1995). In the case of simple Brownian diffusion, α = 1. For the sake of clear display, another plot, log(MSD/time) versus log(time) (log(MSD/time) = (α − 1) log(time) + C′, C′ = constant), has become a standard method. In this display, the plot becomes flat (the slope α − 1 = 0), when α = 1 (when the diffusion is simple Brownian); and when diffusion is anomalous, α becomes <1, giving the plot of log(MSD/time) versus log(time) a negative slope (α − 1 < 0). Therefore, in this display, the level of diffusion anomaly can readily be seen. For example, an unsaturated phospholipid DOPE exhibited distinct negative slopes (Fujiwara et al., 2002; Murase et al., 2004). However, in membrane blebs, where the membrane skeleton is largely lost, the plot was almost flat (α − 1 = 0.012, i.e., α ≅ 1 in FRSK cells), indicating that in the absence of the membrane skeleton, DOPE diffusion is basically simple Brownian.
Fig. 7 shows the plot of log(MSD/time) versus log(time) for Gmyc-μOR, constructed based on the data obtained at time resolutions of 25 μs (blue), 8 ms (orange), and 33 ms (red) (averaged over all Gmyc-μOR particles for each time resolution, shown in blue, red, and black circles, respectively), covering a very broad time range of >5 orders of magnitude (from 50 μs to 10 s). The plot is not flat at all, i.e., diffusion is certainly anomalous in the cell membrane. The plot can be fitted, assuming the presence of five characteristic time zones, with five straight lines, with α values of 0.85 (50 μs ∼ 0.2 ms), 0.16 (0.2 ∼ 4.5 ms), 0.80 (4.5 ms ∼ 80 ms), 0.38 (80 ∼ 900 ms), and 0.99 (900 ms ∼ 10 s). The proposition of the five time zones is based on the model of the doubly partitioned plasma membrane, in which the following molecular events might take place on different timescales.
The shortest time zone (50 μs ∼ 0.2 ms): Gmyc-μOR is barely affected by the presence of the 210-nm compartment boundaries (flatter left end), undergoing pseudo-simple Brownian diffusion (α − 1 ≈ −0.15, quite close to 0).
The time zone of 0.2 ∼ 4.5 ms: Gmyc-μOR senses the 210-nm compartment boundaries, i.e., short-term confinement within a 210-nm compartment is apparent, while hop movements over adjacent 210-nm compartments can also be detected (steep slope on the left with α −1 ≈ −0.84).
The intermediate flat area of 4.5 ms ∼ 80 ms (α −1 ≈ −0.20, reasonably close to 0): the motion of Gmyc-μOR is dominated by hop movements over many 210-nm compartments (with a small contribution of fast movements within a compartment to the MSD), which makes the MSD of Gmyc-μOR look as though it undergoes simple Brownian diffusion, hopping over the lattice points separated by 210 nm. In this time zone, the presence of 730-nm compartment boundaries is not apparent.
The time zone of 80 ∼ 900 ms: Gmyc-μOR senses the boundaries of the 730-nm compartments, i.e., short-term confinement within a 730-nm compartment is apparent, while hop movements over adjacent 730-nm compartments can also be detected (steep slope on the right, with α −1 ≈ −0.62). Finally,
The flat area of 900 ms ∼ 10 s (flattened end on the right, with α − 1 ≈ −0.01, close to 0): the motion of Gmyc-μOR is dominated by hop movements over many 730-nm compartments (with a small contribution of fast movements within a compartment to the MSD). This makes the plot look as though it undergoes simple Brownian diffusion, hopping over the lattice points separated by 730 nm. Therefore, although anomalous diffusion in the cell membrane could be caused by various kinds of obstacles and binding sites (Saxton, 1994, 1996), the model of double compartmentalization of the NRK plasma membrane with regard to Gmyc-μOR diffusion could well explain the plot shown in Fig. 7.
Readers should be aware that the nested double compartmentalization model for the plasma membrane of NRK cells may be one of the many possible models (although currently this is the only model we can offer: mathematically, we could fit the plot shown in Fig. 7 using different fitting functions, but without any underlying theory or proposed physical mechanism). The argument advanced here states that “if” we “assume” that Gmyc-μOR undergoes hop diffusion in a compartmentalized plasma membrane, then we could explain the display shown in Fig. 7 quite reasonably. In fact, using a Monte Carlo simulation, Saxton (1994) showed that, in the presence of moderate concentrations of immobile obstacles, diffusion becomes anomalous (for example, see Fig. 4 b in this report).
Finding individual compartments: compartmentalization by rather straight boundaries
As described above, our experimental data are consistent with the model of the partitioned plasma membrane by the actin-based membrane skeleton “fence” and the anchored-protein “pickets”, with regard to translational diffusion of μOR. To further proceed, we examined how these compartments are organized in the membrane by finding these compartments using long trajectories. In typical trajectories like that shown in Fig. 5 a (long trajectories over 68,000 determined points for ≈1.7 s), we examined how the underlying 210-nm compartments may be packed, based on the hop points in the trajectory and the shape and the size of the trajectory between the two consecutive hop points corresponding to a compartment. Special attention is paid to the occasions where the particle visits the same compartment more than once. By making such an approach, we try to address the following five issues: 1), how long do the smaller 210-nm compartments stay?; 2), how much do they move around?; 3), do the barrier heights vary greatly in time and space?; 4), are the shapes of the compartments complicated, or do they tend to be simple polygons like triangles, rectangles, pentagons, and hexagons?; 5), relatedly, are the compartment boundaries in the scale of these trajectories rather straight (or only gradually winding), consistent with the structure of the actin filament? (for example, how is consistency with the persistence length of the actin filament of 2–15 μm? (Yanagida et al., 1984; Gittes et al., 1993; Steinmetz et al., 1997; Liu and Pollack, 2002)).
Overall strategy for finding individual compartments and straight boundaries over long ranges
The trajectory shown in Fig. 5 a is cut into 11 pieces of 53–253 ms subtrajectories (but showing only one out of 20 consecutive points, corresponding to 0.5 ms/frame observation to avoid too much crowding of the trajectory in the figure; each piece of the subtrajectory still contains 106–506 points; the divisions into these 11 subtrajectories were made at the intercompartmental hop points, but the further selection of the dividing points was done rather arbitrarily for the clarity of display and explanations). Plausible compartments were detected by the computer software using the raw 25-μs/frame trajectory (and not the time-lapsed one shown in Fig. 5 c), and are shown in different colors. Quite often, the points in a compartment shown in Fig. 5 c may look sparse, but they in fact contain 20 times more points in the raw trajectory. For example, see the third piece of the subtrajectory. The points in the purple, blue, and green regions (in the green region, the molecule covered two compartments, as will be clarified later, but even at a 25-μs resolution, the presence of two compartments in the green domain could not be detected in this occasion) appear very sparse, but the original trajectory for this piece reproduced in Fig. 5 d suggests that there may be a sufficient number of points to indicate the presence of distinct compartments.
In the colored subtrajectories shown in the upper row in Fig. 5 c, the smaller compartments we propose, based on the trajectory and the hop points detected by our computer software, are indicated by dashed black ellipses. The compartment shapes were approximated by ellipses because we characterize the compartment size using two values in the x and y directions, and these lengths can be conveniently used as the long and short axes of the ellipse (although in some places, this approximation may not look very good).
Further, as seen in the second and third rows, we abductively examined if the arrangement of these compartments can be largely approximated by the lattice of slightly and gradually curved lines. The proposed lattice (other lattice structures may be possible, but we could not find simpler ones) is largely consistent with the compartments expressed in packed ellipses. Therefore, based on this proposed lattice structure, compartments were indexed by a set of two numbers, using numbering along the two main axes (the compartment indices are shown only in the first subtrajectory). Rather straight compartment boundaries of such length scales are not inconsistent with the persistence length of the actin filament (2–15 μm, Yanagida et al., 1984; Gittes et al., 1993; Steinmetz et al., 1997; Liu and Pollack, 2002), addressing the issues 4 and 5 above (Although such a lattice structure may give an impression that the compartment shapes are basically rectangles, clarification of this point would require far more extensive research.). In the following discussion, first, we use this lattice solely for indexing purpose, and even in the second and third rows, we use elliptic compartments for the purpose of finding and determining compartments.
Detailed explanation for the first three subtrajectories
Here, we describe how the compartments shown in ellipses are detected, using the first three subtrajectories as examples (as basic principles used for the compartment determination all appear within the first three subtrajectories).
First subtrajectory.
This particle started out from the purple part in the [1, 6] compartment (from here, the word compartment will be omitted after the compartment index), passed [2, 5] quickly (here, the color was kept purple, as the clear hop could not be identified even at a 25-μs resolution, but [2, 5] was identified as a separate independent compartment because, in later trajectories, [2,5] appears separately from [1,6/2,5]), hopped to [2, 4], and then to [3, 4] (blue, the same color is used by the same reason as that for the purple [1, 6] and [2, 5]), and then to [3, 3] (green), [2, 3] (yellow), and finally to [3, 3] (red) again.
Second subtrajectory.
The particle came to the purple [4, 2] from the previous red [3, 3], hopped from the purple [4, 2] to the blue region (passing [3, 2] quickly, reaching [2, 2, left]), and then to the green [2, 2, right]. See blue-green [2, 2, left and right, respectively] of this subtrajectory, the purple [2, 2] of the ninth subtrajectory, and the yellow [2, 2] of the 10th subtrajectory. The latter two subtrajectories indicated the presence of a single compartment here (purple in the ninth piece may appear to cover only the left part of [2, 2], but in the original trajectory containing all the 25-μs determined points, it covers the entire [2, 2]). We raise a possibility that the intercompartmental barrier between the blue and green regions may be low or transient, and only manifested itself at an earlier time (therefore, the boundary between these two parts are shown in dotted lines, distinguished from other boundaries). An actin filament that may be located a little off from the cytoplasmic surface may have become transiently bound to the cytoplasmic surface of the cell membrane during this period, addressing the third of the five issues raised above.
Third subtrajectory.
This part is reproduced in Fig. 5 d in full detail (25-μs resolution), as described above. Note that the green and the yellow parts of the trajectory ([2,3/2,4] and [2,5/3,5]]) apparently covered at least two compartments in each case (the color of the trajectory is changed only when we detected hop movements by a computer program). However, this molecule passes these domains many times (for example, at least four times through [2,3] and at least five times through [2, 4]), and thus these compartments were identified as separate individual compartments. Such logic was used throughout the detection process of the elliptic compartments shown in Fig. 5 c. Furthermore, since these domains often become connected with adjacent compartments in our domain detection software, the barrier heights of these compartments would be lower, addressing the third issue (among the five issues) raised above.
Summary and the discussion of the difficulty in determination of the compartments
The difficulty may largely come from the fluctuation of the low barrier potential of intercompartmental boundaries (issues 1–3 as described above) and statistical nature inherent to thermal diffusion, which might lead to rapid passage across a compartment, preventing us from obtaining sufficient number of points in a compartment. This, coupled with the low signal/noise ratio, might make the individual compartments undetectable.
Another problem is the temporary lowering of the position-determination precisions (due to noise or lowering of the contrast), which can be found, for example, in the purple part of the fourth subtrajectory and the latter red part of the eighth subtrajectory. Similar events appear to have happened in the third and 11th subtrajectories. Even when the problem is less severe, intercompartmental hops may be missed (even in cases where there were a sufficient number of points): this apparently happened in the yellow part in the third subtrajectory and the blue portion in the fifth subtrajectory.
Quantitative analysis found the median residency time of 45 ms (for all of the molecules inspected here, Fig. 4 d), but here, the average residency time is 21 ms (71 hops over 22 smaller compartments during 1.44 s in the purple 730-nm compartment). In addition to natural variations, a methodological problem in our quantitative analysis that should be addressed can be raised: close inspection of the trajectory indicates that 1), the gold particle often moved back and forth between the two same compartments, which may be easily missed in our quantitative analysis (detecting the presence of a combined single compartment), and 2), the gold particle often passed a compartment rapidly, which may lead to the increase in the compartment size rather than the presence of two compartments.
Discussions to the five issues raised above
How long do the smaller compartments stay? They tend to stay over several hundred ms. For example, the compartment [1,6] ([4,5]) is visited twice, i.e., the purple (red) part in the first (third) subtrajectory and the red (first red) part of the sixth (eighth) subtrajectory apart by ∼700 (300) ms.
How much do the smaller compartments move around? Although it is impossible to firmly point out where and when this happened in Fig. 5 c due to the stochastic nature of diffusion and the measurement noise, the compartment boundaries appear to be shifting several 10s–100 nm all the time, which may be noticeable within several hundred ms. When the molecule appeared to come back to the same compartment at later times, the covered areas often do not exactly match with each other in many cases (in Fig. 5 c, this appears as slight shifts between the trajectory and the proposed compartment).
Do the barrier heights vary greatly in time and space? Apparently, yes. The barrier heights of some of the compartments, like [2,3], [2,4], [2,5], and [3,5], appeared to be consistently lower than others (spatial variations), and the barrier heights appeared to fluctuate in time, as exemplified in the case for [2, 2] (dotted line).
What are the shapes of the compartments, and
are the compartment boundaries in the scale of these trajectories rather straight (or only gradually winding)? See the far right figure in the third row in Fig. 5 c, and compare the individually defined elliptic compartments with the guessed lattice structure of the membrane skeleton (the part of the membrane skeleton attached to the cytoplasmic surface of the membrane) forming the compartment boundaries. To determine this lattice, we first tried to draw straight lines so that those lines coincide with the compartment boundaries determined by the elliptic compartments as much as possible. The present one is chosen because it is the simplest (the number of straight lines were smallest with decent matches with the elliptic compartment boundaries). Finally, we put low curvatures to those straight lines so that the elliptic compartments visually fit the lattice meshwork as much as possible.
The compartments defined by the collection of ellipses and lattices appear to generally coincide with each other. Obvious problems occur in [1, 1], where there seem to exist two elliptic compartments, and in [4, 3], where no independent single ellipse exists (but which is covered by the edges of two ellipses [3, 3] and [5, 3]). The presence of two compartments within [1, 1] may have been induced by the binding of an actin filament coming out from the deeper part of the membrane skeleton. Regarding [4, 3], the presence of a single elliptic compartment may have been missed due to the statistical problem: the particle passed there twice, but in both cases, the clear hop across the compartment boundaries with [3, 3] and [5, 3] could not be detected.
Further, assuming the actin-based compartment boundaries and the low levels of branching of actin filaments or bundles, the compartments in rows 5 and 6 and columns of 2 and 3 may be in a larger 730-nm compartment separate from the upper 730-nm compartment, and so a thick boundary was placed between rows 4 and 5. Detecting the larger 730-nm compartments is a more subtle issue than finding the smaller 210-nm compartments, as discussed in the Supplementary Material, Text 4.
Although we have no intention to insist that this proposed lattice is a highly probable or a unique model deduced from the trajectory shown in Fig. 5, a and c, the coincidence of the elliptic compartments and the lattice mesh is rather impressive, considering the primitive nature of the visual lattice fitting.
CONCLUSIONS
Almost all of the μOR molecules expressed in NRK cells undergo short-term (≈45 ms on average) confined diffusion within the membrane compartments (≈210 nm on average) and long-term hop diffusion over these compartments (Figs. 4–6).
The high-speed SPT data for gold-tagged μOR molecules are totally consistent with the video-rate observations for gold-tagged μOR and the SFVI of μOR-GFP (Figs. 2 and 3).
Anomaly analyses covering a timescale encompassing >5 orders of magnitude support the concept of a compartmentalized membrane (Fig. 7). This is likely to be due to membrane skeleton fences and transmembrane protein pickets anchored to and lined up along them (Fig. 1).
Molecular diffusion in the plasma membrane is anomalous, and only under the limited conditions of low time resolutions (video-rate observations and FRAP measurements) or insufficient length of observation durations, “apparent simple Brownian diffusion” of membrane molecules that can be described by an “effective” diffusion coefficient is observed. When the measurements are performed under these conditions or an attempt is made to describe diffusion using a single diffusion coefficient (+ an immobile fraction), one has to be keenly aware of the limitations and that the obtained values are “effective” parameters under limited conditions. It may be prudent to designate these “effective diffusion coefficients”, e.g., those determined by FRAP, single molecule (particle) observations with insufficient time resolutions or trajectory lengths, as Deff.
To detect hop diffusion in MSD-Δt plots, serious consideration should be given to the time resolution and the observation period (the sufficient number of measurements during the residency time and the observation period comparable to the average residency time) (Fig. 4 b). Otherwise, the hop feature may be hidden and easily missed, leading to the erroneous conclusion of “true” simple Brownian diffusion.
The compartment sizes that μOR detected were similar to those sensed by an unsaturated phospholipid, DOPE, and a transmembrane protein, TfR. Compartmentalization of the NRK cell membrane is rather complicated due to the nested double compartmentalization, which is unique for NRK cells thus far, but the compartment sizes that μOR detected were 210 nm for the smaller compartments and 730 nm for the larger compartments. These values are comparable to 230 (260) and 750 (710) nm, respectively, for DOPE (TfR) (Figs. 4–6, Tables 1 and 2).
The macroscopic diffusion coefficients for μOR observed here is consistent with the previous FRAP data for other GPCRs, suggesting that other GPCRs also undergo hop diffusion in the compartmentalized plasma membrane (Figs. 2 and 3, Table 1).
All of the results presented above are consistent with the corralling of GPCRs by the actin-based membrane-skeleton “fences” and by the associated transmembrane proteins that act as rows of “pickets” lined up along the membrane-skeleton fence (Fig. 4, Tables 1 and 2).
The long-term trajectories obtained by a high-speed SPT (>68,000 frames at a 25-μs resolution) are consistent with the compartments delimited by and lined up along rather straight boundaries of the order of a micron (Fig. 5 c), consistent with the long persistence length of the actin filaments (2–15 μm).
When performing SPT experiments using gold-tagged molecules, the SPT data always have to be substantiated by other methods using smaller, noncross-linking probes, such as fluorescent molecules (Figs. 2 and 3).
To avoid specific and/or nonspecific cross-linking by gold probes, cold preincubation of gold probes with the cells should not be performed. Probably due to cross-linking of the μOR molecules or that of μOR and/or other membrane-associated molecules (Fig. 8), the movement of the gold probes was substantially suppressed (Figs. 2 and 3, Table 1),). Such effects induced by prolonged cold preincubation were likely to have caused strong artifactual confinement within a compartment, reported by Daumas et al. (2003).
We recommend that the gold probes be added right before the microscopic observations (without cooling), and that one start the observations right away in the presence of the gold probes in the medium. It is always safer to observe gold particles that have just arrived on the membrane surface.
FIGURE 8.

A gold particle attached to a single μOR molecule is likely to undergo rapid hop diffusion over the membrane compartments delimited by the membrane skeleton “fence” and various transmembrane protein “pickets” anchored to and lined up along the membrane skeleton (center). In contrast, those bound to more than one molecule of μOR (specifically) and/or those that formed multiple bonds to μOR (specifically) or other molecules (nonspecifically) may be strongly confined within a single compartment due to the enhanced corralling effect (left) and/or bound to the membrane skeleton due to the avidity effect (right). Single molecules of μOR (or perhaps even small oligomers of μOR) may hop across the compartment boundaries quite readily (center). Upon the formation of μOR clusters, which may include other molecules (via nonspecific binding, not shown in this figure), due to the enhanced corralling (left) and binding effects (right) of the membrane skeleton, the macroscopic diffusion of μOR clusters over the compartments may be slowed or blocked (the oligomerization-induced trapping model, as proposed by Kusumi and Sako (1996) and Iino et al. (2001)). If a two-dimensional continuum fluid model were applicable to the cell membrane (as well as to artificial reconstituted membranes), then such clustering should induce neither the slowing of diffusion nor the immobilization of μOR. Therefore, the cluster-induced reduction of the diffusion rate itself supports the concept of a compartmentalized fluid membrane model for the plasma membrane.
SUPPLEMENTARY MATERIAL
An online supplement to this article can be found by visiting BJ Online at http://www.biophysj.org.
Supplementary Material
Acknowledgments
We thank Prof. Rudiger Schülz (Institute of Pharmacology, University of Munich, Germany) for providing the cDNA for μOR, and Prof. Ken Jacobson (University of North Carolina, Chapel Hill, NC) for providing us with TCZ detection software he developed and typical trajectories that contain TCZs to test our implementation of the TCZ detection program. We also thank Ms. Junko Kondo of our laboratory for preparing figures.
References
- Bray, D. 1998. Signaling complexes: biophysical constraints on intracellular communication. Annu. Rev. Biophys. Biomol. Struct. 27:59–75. [DOI] [PubMed] [Google Scholar]
- Bussell, S. J., D. L. Koch, and D. A. Hammer. 1995. Effect of hydrodynamic interactions on the diffusion of integral membrane proteins: tracer diffusion in organelle and reconstituted membranes. Biophys. J. 68:1828–1835. [DOI] [PMC free article] [PubMed] [Google Scholar]
- Chang, C.-H., H. Takeuchi, T. Ito, K. Machida, and S. Ohnishi. 1981. Lateral mobility of erythrocyte membrane proteins studied by the fluorescence photobleaching recovery technique. J. Biochem. 90:997–1004. [DOI] [PubMed] [Google Scholar]
- Daumas, F., H. Mazarguil, C. Millot, A. Lopez, and L. Salome. 2002. Probing functionalized gold colloids for signal particle tracking experiments. Biochem. Biophys. Res. Commun. 295:610–615. [DOI] [PubMed] [Google Scholar]
- Daumas, F., N. Destainville, C. Millot, A. Lopez, D. Dean, and L. Salome. 2003. Confined diffusion without fences of a G-protein-coupled receptor as revealed by single particle tracking. Biophys. J. 84:356–366. [DOI] [PMC free article] [PubMed] [Google Scholar]
- De Mey, J. 1983. Colloidal gold probes in immunocytochemistry. In Immunocytochemistry (Practical Applications in Pathology and Biology). J. M. Polak and S. van Noorden, editors. Wright PSG, Bristol, UK. 83–112.
- Derrick, J. P., and D. B. Wigley. 1994. The third IgG-binding domain from Streptococcal protein G. J. Mol. Biol. 243:906–918. [DOI] [PubMed] [Google Scholar]
- Dietrich, C., B. Yang, T. Fujiwara, A. Kusumi, and K. Jacobson. 2002. Relationship of lipid rafts to transient confinement zones detected by single particle tracking. Biophys. J. 82:274–284. [DOI] [PMC free article] [PubMed] [Google Scholar]
- Dodd, T. L., D. A. Hammer, A. S. Sangani, and D. L. Koch. 1995. Numerical simulations of the effect of hydrodynamic interactions on diffusivities of integral membrane proteins. J. Fluid Mech. 293:147–180. [Google Scholar]
- Edidin, M., S. C. Kuo, and M. P. Sheetz. 1991. Lateral movements of membrane glycoproteins restricted by dynamic cytoplasmic barriers. Science. 254:1379–1382. [DOI] [PubMed] [Google Scholar]
- Edidin, M., M. C. Zuniga, and M. P. Sheetz. 1994. Truncation mutants define and locate cytoplasmic barriers to lateral mobility of membrane glycoproteins. Proc. Natl. Acad. Sci. USA. 91:3378–3382. [DOI] [PMC free article] [PubMed] [Google Scholar]
- Edidin, M. 2003. Lipids on the frontier: a century of cell-membrane bilayers. Nat. Rev. Mol. Cell Biol. 4:414–418. [DOI] [PubMed] [Google Scholar]
- Feder, T. J., I. Brust-Mascher, J. P. Slattery, B. Baird, and W. W. Webb. 1996. Constrained diffusion or immobile fraction on cell surfaces: a new interpretation. Biophys. J. 70:2767–2773. [DOI] [PMC free article] [PubMed] [Google Scholar]
- Felsenfeld, D., D. Choquet, and M. P. Sheetz. 1996. Ligand binding regulates the directed movement of beta1 integrins on fibroblasts. Nature. 383:438–440. [DOI] [PubMed] [Google Scholar]
- Fujiwara, T., K. Ritchie, H. Murakoshi, K. Jacobson, and A. Kusumi. 2002. Phospholipids undergo hop diffusion in compartmentalized cell membrane. J. Cell Biol. 157:1071–1081. [DOI] [PMC free article] [PubMed] [Google Scholar]
- Gelles, J., B. J. Schnapp, and M. P. Sheetz. 1988. Tracking kinesin-driven movements with nanometer-scale precision. Nature. 331:450–453. [DOI] [PubMed] [Google Scholar]
- Gittes, F., B. Mickey, J. Nettleton, and J. Howard. 1993. Flexural rigidity of microtubules and actin filaments measured from thermal fluctuations in shape. J. Cell. Biol. 120:923–934. [DOI] [PMC free article] [PubMed] [Google Scholar]
- Holowka, D., and B. Baird. 1996. Antigen-mediated IGE receptor aggregation and signaling: a window on cell surface structure and dynamics. Annu. Rev. Biophys. Biomol. Struct. 25:79–112. [DOI] [PubMed] [Google Scholar]
- Horvat, R. D., S. Nelson, C. M. Clay, B. G. Barisas, and D. A. Roess. 1999. Intrinsically fluorescent luteinizing hormone receptor demonstrates hormone-driven aggregation. Biochem. Biophys. Res. Commun. 255:382–385. [DOI] [PubMed] [Google Scholar]
- Iino, R., I. Koyama, and A. Kusumi. 2001. Single molecule imaging of green fluorescent proteins in living cells: E-cadherin forms oligomers on the free cell surface. Biophys. J. 80:2667–2677. [DOI] [PMC free article] [PubMed] [Google Scholar]
- Jacobson, K., E. D. Sheets, and R. Simson. 1995. Revisiting the fluid mosaic model of membranes. Science. 268:1441–1442. [DOI] [PubMed] [Google Scholar]
- Kenworthy, A. K., B. J. Nichols, C. L. Remmert, G. M. Hendrix, M. Kumar, J. Zimmerberg, and J. Lippincott-Schwartz. 2004. Dynamics of putative raft-associated proteins at the cell surface. J. Cell Biol. 165:735–746. [DOI] [PMC free article] [PubMed] [Google Scholar]
- Kusumi, A., Y. Sako, and M. Yamamoto. 1993. Confined lateral diffusion of membrane receptors as studied by single particle tracking (nanovid microscopy). Effects of calcium-induced differentiation in cultured epithelial cells. Biophys. J. 65:2021–2040. [DOI] [PMC free article] [PubMed] [Google Scholar]
- Kusumi, A., and Y. Sako. 1996. Cell surface organization by the membrane skeleton. Curr. Opin. Cell Biol. 8:566–574. [DOI] [PubMed] [Google Scholar]
- Kusumi, A., I. Koyama-Honda, and K. Suzuki. 2004. Molecular dynamics and interactions for creation of stimulation-induced stabilized rafts from small unstable steady-state rafts. Traffic. 5:213–230. [DOI] [PubMed] [Google Scholar]
- Kusumi, A., C. Nakada, K. Ritchie, K. Murase, K. Suzuki, H. Murakoshi, R. S. Kasai, J. Kondo, and T. Fujiwara. 2005. Paradigm shift of the plasma membrane concept from the two-dimensional continuum fluid to the partitioned fluid: high-speed single-molecule tracking of membrane molecules. Annu. Rev. Biophys. Biomol. Struct. In press. [DOI] [PubMed]
- Ladha, S., P. S. James, D. C. Clark, E. A. Howes, and R. Jones. 1997. Lateral mobility of plasma membrane lipids in bull spermatozoa: heterogeneity between surface domains and rigidification following cell death. J. Cell Sci. 110:1041–1050. [DOI] [PubMed] [Google Scholar]
- Laporte, S. A., R. H. Oakley, J. Zhang, J. A. Holt, S. S. Ferguson, M. G. Caron, and L. S. Barak. 1999. The β2-adrenergic receptor/βarrestin complex recruits the clathrin adaptor AP-2 during endocytosis. Proc. Natl. Acad. Sci. USA. 96:3712–3717. [DOI] [PMC free article] [PubMed] [Google Scholar]
- Lee, G. M., F. Zhang, A. Ishihara, C. L. McNeil, and K. Jacobson. 1993. Unconfined lateral diffusion and an estimate of pericellular matrix viscosity revealed by measuring the mobility of gold-tagged lipids. J. Cell Biol. 120:25–35. [DOI] [PMC free article] [PubMed] [Google Scholar]
- Leunissen, J. L. M., and J. R. D. Mey. 1989. Preparation of gold probes. In Immuno-Gold Labeling in Cell Biology. A. J. Verkleij and J. L. M. Leunissen, editors. CRC Press, Boca Raton, FL. 3–16.
- Lindblom, G., L. B. Johansson, and G. Arvidson. 1981. Effect of cholesterol in membranes. Pulsed nuclear magnetic resonance measurements of lipid lateral diffusion. Biochemistry. 20:2204–2207. [DOI] [PubMed] [Google Scholar]
- Liu, X., and G. H. Pollack. 2002. Mechanics of F-actin characterized with microfabricated cantilevers. Biophys. J. 83:2705–2715. [DOI] [PMC free article] [PubMed] [Google Scholar]
- Lommerse, P. H., G. A. Blab, L. Congnet, G. S. Harms, B. E. Snaar-Jagalska, H. P. Spaink, and T. Schmidt. 2004. Single-molecule imaging of the H-ras membrane-anchor reveals domains in the cytoplasmic leaflet of the cell membrane. Biophys. J. 86:609–616. [DOI] [PMC free article] [PubMed] [Google Scholar]
- Murakoshi, H., R. Iino, T. Kobayashi, T. Fujiwara, C. Ohshima, A. Yoshimura, and A. Kusumi. 2004. Single molecule imaging analysis of Ras activation in living cells. Proc. Natl. Acad. Sci. USA. 101:7317–7322. [DOI] [PMC free article] [PubMed] [Google Scholar]
- Murase, K., T. Fujiwara, Y. Uemura, K. Suzuki, R. Iino, H. Yamashita, M. Saito, H. Murakoshi, K. Ritchie, and A. Kusumi. 2004. Ultrafine membrane compartments for molecular diffusion as revealed by single molecule techniques. Biophys. J. 86:4075–4093. [DOI] [PMC free article] [PubMed] [Google Scholar]
- Nagle, J. F. 1992. Looking tail kinetics in biophysics? Biophys. J. 63:366–370. [DOI] [PMC free article] [PubMed] [Google Scholar]
- Nakada, C., K. Ritchie, Y. Oba, M. Nakamura, Y. Hotta, R. Iino, R. S. Kasai, K. Yamaguchi, T. Fujiwara, and A. Kusumi. 2003. Accumulation of anchored proteins forms membrane diffusion barriers during neuronal polarization. Nat. Cell Biol. 5:626–632. [DOI] [PubMed] [Google Scholar]
- Nelson, S., R. D. Horvat, J. Malvey, D. A. Roess, B. G. Barisas, and C. M. Clay. 1999. Characterization of an intrinsically fluorescent gonadotropin-releasing hormone receptor and effects of ligand binding on receptor lateral diffusion. Endocrinology. 140:950–957. [DOI] [PubMed] [Google Scholar]
- Powles, J. G., M. J. D. Mallett, G. Rickayzen, and W. A. B. Evans. 1992. Exact analytic solutions for diffusion impeded by an infinite array of partially permeable barriers. Proc. R. Soc. Lond. A. 436:391–403. [Google Scholar]
- Perosa, F., G. Luccarelli, M. Neri, and F. Dammacco. 1997. The Fab region of IgG2 human myeloma proteins does not bear the streptococcal protein G-specific determinant. J. Immunol. Methods. 203:153–155. [DOI] [PubMed] [Google Scholar]
- Peters, R., and R. J. Cherry. 1982. Lateral and rotational diffusion of bacteriorhodopsin in lipid bilayers: Experimental test of the Saffman-Delbrück equations. Proc. Natl. Acad. Sci. USA. 79:4317–4321. [DOI] [PMC free article] [PubMed] [Google Scholar]
- Pralle, A., P. Keller, E. L. Florin, K. Simons, and J. K. Horber. 2000. Sphingolipid-cholesterol rafts diffuse as small entities in the plasma membrane of mammalian cells. J. Cell Biol. 148:997–1008. [DOI] [PMC free article] [PubMed] [Google Scholar]
- Qian, H., M. P. Sheetz, and E. L. Elson. 1991. Single particle tracking Analysis of diffusion and flow in two-dimensional systems. Biophys. J. 60:910–921. [DOI] [PMC free article] [PubMed] [Google Scholar]
- Saffman, P. G., and M. Delbrück. 1975. Brownian motion in biological membranes. Proc. Natl. Acad. Sci. USA. 72:3111–3113. [DOI] [PMC free article] [PubMed] [Google Scholar]
- Sako, Y., and A. Kusumi. 1994. Compartmentalized structure of the plasma membrane for receptor movements as revealed by a nanometer-level motion analysis. J. Cell Biol. 125:1251–1264. [DOI] [PMC free article] [PubMed] [Google Scholar]
- Sako, Y., and A. Kusumi. 1995. Barriers for lateral diffusion of transferrin receptor in the plasma membrane as characterized by receptor dragging by laser tweezers: fence versus tether. J. Cell Biol. 129:1559–1574. [DOI] [PMC free article] [PubMed] [Google Scholar]
- Sako, Y., A. Nagafuchi, S. Tsukita, M. Takeichi, and A. Kusumi. 1998. Cytoplasmic regulation of the movement of E-cadherin on the free cell surface as studied by optical tweezers and single particle tracking: corralling and tethering by the membrane skeleton. J. Cell Biol. 140:1227–1240. [DOI] [PMC free article] [PubMed] [Google Scholar]
- Sako, Y., S. Mizoguchi, and T. Yanagida. 2001. Single molecule imaging of EGFR signalling on the surface of living cells. Nat. Cell Biol. 2:168–172. [DOI] [PubMed] [Google Scholar]
- Santini, F., I. Gaidarov, and J. H. Keen. 2002. G protein-coupled receptor/arrestin3 modulation of the endocytic machinery. J. Cell Biol. 156:665–676. [DOI] [PMC free article] [PubMed] [Google Scholar]
- Saxton, M. J. 1989a. Lateral diffusion in an archipelago. Distance dependence of the diffusion coefficient. Biophys. J. 56:615–622. [DOI] [PMC free article] [PubMed] [Google Scholar]
- Saxton, M. J. 1989b. The spectrin network as a barrier to lateral diffusion in erythrocytes. A percolation analysis. Biophys. J. 55:21–28. [DOI] [PMC free article] [PubMed] [Google Scholar]
- Saxton, M. J. 1990. The membrane skeleton of erythrocytes. A percolation model. Biophys. J. 57:1167–1177. [DOI] [PMC free article] [PubMed] [Google Scholar]
- Saxton, M. J. 1994. Anomalous diffusion due to obstacles: a Monte Carlo study. Biophys. J. 66:394–401. [DOI] [PMC free article] [PubMed] [Google Scholar]
- Saxton, M. J. 1996. Anomalous diffusion due to binding: a Monte Carlo study. Biophys. J. 70:1250–1262. [DOI] [PMC free article] [PubMed] [Google Scholar]
- Saxton, M. J. 1997. Anomalous diffusion due to binding: The distribution of diffusion coefficients. Biophys. J. 72:1744–1753. [DOI] [PMC free article] [PubMed] [Google Scholar]
- Saxton, M. J. 2001. Anomalous subdiffusion in fluorescence photobleaching recovery: a Monte Carlo study. Biophys. J. 81:2226–2240. [DOI] [PMC free article] [PubMed] [Google Scholar]
- Saxton, M. J., and K. Jacobson. 1997. Single-particle tracking: applications to membrane dynamics. Annu. Rev. Biophys. Biomol. Struct. 26:373–399. [DOI] [PubMed] [Google Scholar]
- Schiweck, W., B. Buxbaum, C. Schatzlein, H. G. Neiss, and A. Skerra. 1997. Sequence analysis and bacterial production of the anti-c-myc antibody 9E10: the V(H) domain has an extended CDR-H3 and exhibits unusual solubility. FEBS Lett. 414:33–38. [DOI] [PubMed] [Google Scholar]
- Schülz, R., A. Wehmeyer, and K. Schülz. 2002. Opioid receptor types selectively cointernalize with G protein-coupled receptor kinases 2 and 3. J. Pharmacol. Exp. Ther. 300:376–384. [DOI] [PubMed] [Google Scholar]
- Schütz, G. J., G. Kada, V. P. Pastushenko, and H. Schindler. 2000. Properties of lipid microdomains in a muscle cell membrane visualized by single molecule microscopy. EMBO J. 19:892–901. [DOI] [PMC free article] [PubMed] [Google Scholar]
- Sheets, E. D., G. M. Lee, R. Simson, and K. Jacobson. 1997. Transient confinement of a glycosylphosphatidylinositol-anchored protein in the plasma membrane. Biochemistry. 36:12449–12458. [DOI] [PubMed] [Google Scholar]
- Sheetz, M. P. 1983. Membrane skeleton dynamics: role in modulation of red cell deformability, mobility of transmembrane proteins, and shape. Semin. Hematol. 20:175–188. [PubMed] [Google Scholar]
- Sheetz, M. P., S. Turney, H. Qian, and E. L. Elson. 1989. Nanometre-level analysis demonstrates that lipid flow does not drive membrane glycoprotein movements. Nature. 340:284–288. [DOI] [PubMed] [Google Scholar]
- Sheetz, M. P. 1993. Glycoprotein motility and dynamic domains in fluid plasma membranes. Annu. Rev. Biophys. Biomol. Struct. 22:417–431. [DOI] [PubMed] [Google Scholar]
- Shvartsman, D. E., M. Kotler, R. D. Tall, M. G. Roth, and Y. I. Henis. 2003. Differently anchored influenza hemagglutinin mutants display distinct interaction dynamics with mutual rafts. J. Cell Biol. 163:879–888. [DOI] [PMC free article] [PubMed] [Google Scholar]
- Simson, R., E. D. Sheets, and K. Jacobson. 1995. Detection of temporary lateral confinement of membrane proteins using single-particle tracking analysis. Biophys. J. 69:989–993. [DOI] [PMC free article] [PubMed] [Google Scholar]
- Singer, S. J., and G. L. Nicolson. 1972. The fluid mosaic model of the structure of cell membranes. Science. 175:720–731. [DOI] [PubMed] [Google Scholar]
- Spector, I., N. R. Shochet, Y. Kashman, and A. Groweiss. 1983. Latrunculins: novel marine toxins that disrupt microfilament organization in cultured cells. Science. 219:493–495. [DOI] [PubMed] [Google Scholar]
- Steinmetz, M. O., K. N. Goldie, and U. Aebi. 1997. A correlation analysis of actin filament assembly, structure, and dynamics. J. Cell Biol. 138:559–574. [DOI] [PMC free article] [PubMed] [Google Scholar]
- Suzuki, K., and M. P. Sheetz. 2001. Binding of cross-linked glycosylphosphatidylinositol-anchored proteins to discrete actin-associated sites and cholesterol-dependent domains. Biophys. J. 81:2181–2189. [DOI] [PMC free article] [PubMed] [Google Scholar]
- Swaisgood, M., and M. Schindler. 1989. Lateral diffusion of lectin receptors in fibroblast membranes as a function of cell shape. Exp. Cell Res. 180:515–528. [DOI] [PubMed] [Google Scholar]
- Tomishige, M., Y. Sako, and A. Kusumi. 1998. Regulation mechanism of the lateral diffusion of band 3 in erythrocyte membranes by the membrane skeleton. J. Cell Biol. 142:989–1000. [DOI] [PMC free article] [PubMed] [Google Scholar]
- Tsuji, A., K. Kawasaki, S.-I. Ohnishi, H. Merkle, and A. Kusumi. 1988. Regulation of band 3 mobilities in erythrocyte ghost membranes by protein association and cytoskeletal meshwork. Biochemistry. 27:7447–7452. [DOI] [PubMed] [Google Scholar]
- Tsuji, A., and S.-I. Ohnishi. 1986. Restriction of the lateral motion of band 3 in the erythrocyte membrane by the cytoskeletal network: dependence on spectrin association state. Biochemistry. 25:6133–6139. [DOI] [PubMed] [Google Scholar]
- Vaz, W. L. C., M. Criado, V. M. C. Madeir, G. Schoellman, and T. M. Jovin. 1982. Size dependence of the translational diffusion of large integral membrane proteins in liquid-crystalline phase lipid bilayers. A study using fluorescence recovery after photobleaching. Biochemistry. 21:5608–5612. [DOI] [PubMed] [Google Scholar]
- Vrljic, M., S. Y. Nishimura, S. Brasselet, W. E. Moerner, and H. M. McConnell. 2002. Translational diffusion of individual class II MHC membrane proteins in cells. Biophys. J. 83:2681–2692. [DOI] [PMC free article] [PubMed] [Google Scholar]
- Vrljic, M., S. Y. Nishimura, W. E. Moerner, and H. M. McConnell. 2005. Cholesterol depletion suppresses the translational diffusion of class II major histocompatibility complex proteins in the plasma membrane. Biophys. J. 88:334–347. [DOI] [PMC free article] [PubMed] [Google Scholar]
- Yanagida, T., M. Nakase, K. Nishiyama, and F. Oosawa. 1984. Direct observation of motion of single F-actin filaments in the presence of myosin. Nature. 307:58–60. [DOI] [PubMed] [Google Scholar]
- Young, S. H., J. H. Walsh, E. Rozengurt, and L. W. Slice. 2001. Agonist-dependent immobilization of chimeric bombesin/GRP receptors: dependence on c-Src activity and dissociation from internalization. Exp. Cell Res. 267:37–44. [DOI] [PubMed] [Google Scholar]
Associated Data
This section collects any data citations, data availability statements, or supplementary materials included in this article.