

Abstract
We present a three-dimensional computational study of whole-cell equilibrium shape and deformation of human red blood cell (RBC) using spectrin-level energetics. Random network models consisting of degree-2, 3, …, 9 junction complexes and spectrin links are used to populate spherical and biconcave surfaces and intermediate shapes, and coarse-grained molecular dynamics simulations are then performed with spectrin connectivities fixed. A sphere is first filled with cytosol and gradually deflated while preserving its total surface area, until cytosol volume consistent with the real RBC is reached. The equilibrium shape is determined through energy minimization by assuming that the spectrin tetramer links satisfy the worm-like chain free-energy model. Subsequently, direct stretching by optical tweezers of the initial equilibrium shape is simulated to extract the variation of axial and transverse diameters with the stretch force. At persistence length p = 7.5 nm for the spectrin tetramer molecule and corresponding in-plane shear modulus μ0 ≈ 8.3 μN/m, our models show reasonable agreement with recent experimental measurements on the large deformation of RBC with optical tweezers. We find that the choice of the reference state used for the in-plane elastic energy is critical for determining the equilibrium shape. If a position-independent material reference state such as a full sphere is used in defining the in-plane energy, then the bending modulus κ needs to be at least a decade larger than the widely accepted value of 2 × 10⁻¹⁹ J to stabilize the biconcave shape against the cup shape. We demonstrate through detailed computations that this paradox can be avoided by invoking the physical hypothesis that the spectrin network undergoes constant remodeling to always relax the in-plane shear elastic energy to zero at any macroscopic shape, at some slow characteristic timescale. We have devised and implemented a liquefied network structure evolution algorithm that relaxes shear stress everywhere in the network and generates cytoskeleton structures that mimic experimental observations.
INTRODUCTION
The deformation of the human erythrocyte or red blood cell (RBC) has been the topic of detailed investigation for many decades. Interest in the mechanics of RBC can be attributed to several factors. Firstly, changes in the propensity for large deformation of the erythrocyte are known to influence disease states (Mohandas and Evans, 1994) in such cases as sickle cell anemia (Platt, 1995) and malaria (Cooke et al., 2001; Suresh et al., 2005). Secondly, the relatively simple structure (Byers and Branton, 1985; Marchesi, 1985; Liu et al., 1987, 1990) of RBC serves as a model system for the development of quantitative analysis of large deformation whereby complexities associated with nucleated cell types (Elson, 1988) can be avoided. Consequently, a large number of experimental (Rand and Burton, 1964; Hochmuth et al., 1973; Discher et al., 1994; Dobereiner et al., 1997; Henon et al., 1999; Lee et al., 1999; Sleep et al., 1999; Lee and Discher, 2001; Lenormand et al., 2003; Mills et al., 2004), theoretical (Canham, 1970; Evans, 1973; Helfrich, 1973; Skalak et al., 1973; Zarda et al., 1977; Peterson, 1985; Elgsaeter et al., 1986; Seifert et al., 1991; Miao et al., 1994; Hansen et al., 1997), and computational (Boal et al., 1992; Boey et al., 1998; Discher et al., 1998; Lim et al., 2002; Mukhopadhyay et al., 2002; Dao et al., 2003) studies have aimed at the elucidation of elastic and viscoelastic deformation characteristics of the red blood cell.
The basic building block of the RBC cytoskeleton is the spectrin heterodimer, consisting of intertwined α (280 kDa) and β (246 kDa) polypeptide chains running antiparallel to one other (Winkelmann and Forget, 1993). The α-chain consists of ∼22 tandem repeats of triple-helical units of 106 amino acids, whereas the β-chain consists of ∼17 such repeat units (Grum et al., 1999). Two heterodimers can self-associate head-to-head in solution to form a tetramer. These tetramers only bind weakly to short F-actin protofilaments. However, upon the addition of band 4.1, strong spectrin-4.1-actin associations called junction complexes can form. In addition to tetramers, heterodimers, hexamers, and other spectrin oligomers exist and can link adjacent junction complexes in RBC as well, but they are the minority species (Liu et al., 1990). The total count of spectrin tetramers, dimers, hexamers, etc., that link to one particular junction complex is named the functionality of that complex (Sleep et al., 1999); each junction complex may be regarded as an actin vertex, and its functionality the degree of the vertex. Some electron microscopy results suggest that healthy RBC favors degree-6 vertices (Byers and Branton, 1985; Marchesi, 1985; Liu et al., 1987, 1990). According to Liu and co-workers, there are only 3% degree-5 and 8% degree-7 defect vertices seen in the cytoskeletal network extracted from healthy RBC, which is heavily dominated by degree-6 vertices. However, recent atomic force microscopy (AFM) images (Takeuchi et al., 1998; Swihart et al., 2001; Liu et al., 2003) suggest a more disordered network with significantly lower average vertex degree, between 3 and 4.
Advances in experimental techniques capable of quantifying the force-displacement response during the mechanical stretch of single DNA, protein, or receptor-ligand complex (Evans and Ritchie, 1997; Grandbois et al., 1999; Bustamante et al., 2003) have prompted computational simulations with molecular-structure-informed models (Hansen et al., 1997; Discher et al., 1998). It is now quite feasible to simulate the entire RBC cytoskeleton in a desktop workstation based entirely on the ∼105 constituent spectrins, with some appropriate treatment for the lipid bilayers and cytosol. Furthermore, advances in optical tweezers and other methods (Bao and Suresh, 2003) have enabled direct mechanical loading of living cells in large deformation to a force resolution on the order of 1 pN, during which the overall state of stress can be manipulated in a controlled manner (Mills et al., 2004). The above considerations have led to the motivation for the present work: to develop a three-dimensional full-cell model for equilibrium shape and deformation of RBC where the architecture of the spectrin network is directly incorporated. The level of detail addressed by the model is such that the structure is a network of a large number of individual spectrin molecules (Hansen et al., 1997; Discher et al., 1998). The constitutive response of each of these flexible molecules and the manner in which the interactions arise for the specific geometry of the network form the basis for guiding energy minimization steps through which the equilibrium shape of the RBC and its deformation induced by stretching with optical tweezers are determined (Dao et al., 2003; Mills et al., 2004).
MODEL FORMULATION
The starting point for the formulation adapted here is the work of Discher and co-workers, although many aspects of the present work depart significantly from the approach outlined in their articles (Discher et al., 1997, 1998; Boey et al., 1998; Lee et al., 1999). They invoked a spectrin-based model that is intermediate between continuum and atomic scales. The approach is particularly modified here to incorporate the effects of random spectrin network, structural relaxation of the in-plane shear energy, and to include the spontaneous curvature of the lipid bilayers material (Helfrich, 1973; Boal, 2002; Mukhopadhyay et al., 2002).
The degrees of freedom of the model are the actin vertex coordinates {xn}, n∈1..N, which can move freely in three-dimensional Cartesian space according to the generalized force on each vertex. This is schematically illustrated in Fig. 1. Between a vertex pair (m, n), there can be a spectrin link i∈1..S whose length is Li ≡ |xm − xn|, the assembly of which forms a two-dimensional network. A vertex triplet (l, m, n), mutually connected by spectrin molecules, forms a triangle α∈1..Π, whose area is Aα = |( xm − xl) × ( xn − xl)|/2 and center of mass is xα ≡ (xl + xm + xn)/3, and whose normal nα points toward cell exterior. Two triangles α and β are considered to be adjacent if they share a common spectrin link. In the original model (Discher et al., 1997), the topological connectivities of the vertices are assigned at the start of a simulation and are not changed during deformation, assuming that the spectrin links are unbreakable even at large extensions. This could be a good approximation for some problems but not for others, such as aging and death of the cell where one observes significant changes in network connectivity and order (Liu et al., 2003). To address this issue, we propose in this work a computational procedure whereby network connectivity can be altered.
FIGURE 1.

Illustration of the model using the potential from Eq. 1 for triangle-dominated cytoskeleton. Here i∈1..S labels a spectrin link connecting two adjacent junction complexes, which exerts an entirely attractive force fWLC(Li). The expression α∈1..Π labels triangular plaquette of lipid material with area Aα. It leads to a repulsive energy  that counterbalances the spectrin attraction. Two adjacent lipid plaquettes with normal vectors nα and nβ also give rise to a bending energy Fbending that depends on the angle between nα and nβ, in reference to a spontaneous curvature angle θ0.
Assuming that the triangles tessellate the surface of one contiguous volume, leaving no significant holes, the total area of the cell can be defined as  The total volume of the cell is computed as
  on the basis of the continuum divergence theorem:
  which is a reference-frame independent and numerically robust formula, even when the RBC undergoes a shape change from convex shapes (such as a sphere) to nonconvex shapes (such as discocyte or stomatocyte).
Discher et al. (1998) proposed the total coarse-grained Helmholtz free energy of the system to be
 |
(1) |
in which
 |
(2) |
effectively imposes a constraint on the total volume Ωtotal of the cell, thereby incorporating the effect of the nearly incompressible cytosol inside the RBC. The average equilibrium length of a spectrin link L0 is 75 nm. Similarly,
 |
(3) |
imposes a constraint on the total surface area of the cell that reflects the conservation of the total number of lipid molecules at the cell surface. The exact values of the prefactors kvolume and ksurface are unimportant; they are both chosen to be 600.
Although the lipid bilayers cannot sustain steady-state shear stress, they possess compressional and bending stiffnesses. In the present model we assume that these two stiffnesses are imparted to the cytoskeleton by the anchoring transmembrane proteins. In other words the effects of the lipid bilayer are assumed to be represented as coarse-grained local free energies, so that only the degrees of freedom of the cytoskeleton need to be tracked explicitly. The bending free energy is written as
 |
(4) |
in which  and κ = κc+κg/2 is the average bending modulus (Boal and Rao, 1992) of lipid membrane, and θ0 is the spontaneous curvature angle between two adjacent triangles (positive θ0 means preference for a convex shell shape). In the numerical evaluation of Fbending and its resultant forces on {xn}, we use the formula
 |
(5) |
where cosθαβ = nα · nβ and sinθαβ = ±|nα × nβ| with the + sign taken if (nα − nβ) · (xα − xβ) ≥ 0. If a spherical surface is tessellated with equilateral triangles, the same bending energy of magnitude 8πκ is obtained (with reference to a flat plate) through Eq. 4, as with the continuum bending energy functional (Boal and Rao, 1992),
 |
(6) |
in which C1, C2 are the two principle curvatures, and C0 is the spontaneous curvature constant. Note that the so-called nonlocal bending energy (Seifert et al., 1991; Miao et al., 1994; Mukhopadhyay et al., 2002) is not included for the sake of simplicity. This term appears in the area-difference elasticity model of bending energy, but not in the classical spontaneous curvature model (Helfrich, 1973).
Although the three free-energy terms in Eqs. 2–4 above are not markedly different from traditional cell elasticity models, the point of departure is in the in-plane free energy, Fin-plane. This choice is appropriate in the context of large deformation studies such as optical tweezers experiments, since Fin-plane is the dominant active term in Eq. 1. The spectrin network plus the bilayer membrane is assumed to have a total free energy of
 |
(7) |
where Li is the length of spectrin link i and Aα is the area of triangular plaquette α. (Discher et al., 1998, define Aα as twice the actual triangle area. This could be somewhat confusing in practice. Consequently, Aα is taken to be the actual spectrin triangular plaquette area in this article.) The first sum includes all spectrin links and is the total entropic free energy stored in the spectrin proteins, where WLC stands for worm-like chain (Marko and Siggia, 1995; Bustamante et al., 2003). The WLC form is adopted here merely because it is a widely used and tested form for DNA and certain proteins. The second sum is the elastic energy stored in the lipid membrane and other protein materials, with constant Cq and exponent q to be selected. Because the second term depends only on the plaquette areas {Aα}, there is no shear stress contribution coming from this term since incremental shear strain would not change {Aα}. Discher et al. (1998) have used q = 1 in their models, in which case the ratio between area dilatational modulus K and shear modulus μ is fixed to be 2. A more general model could easily be developed with q ≠ 1 to fit both the shear and dilatational moduli. In this article we use q = 1.
The worm-like chain model of Marko and Siggia (1995) provides the force versus chain length relationship as
 |
(8) |
in which Lmax is the maximum or contour length of the chain, L is the instantaneous chain length (x is the dimensionless ratio between L and Lmax), and p is the persistence length. Integration of Eq. 8 gives the result (Discher et al., 1998) that
 |
(9) |
When x is small,
 |
(10) |
and hence,
 |
(11) |
which corresponds to a phenomenological picture where N = Lmax/p rigid monomers of length p are connected in a random walk (Discher et al., 1998). Because, in this description, the directions of the nth and the n+1th monomers are deemed completely independent, p is also defined as the characteristic decay length of the line-tangent autocorrelation function 〈l(L) · l(L + x)〉.
Previous simulations (Boal and Rao, 1992; Boey et al., 1998; Discher et al., 1998; Lim et al., 2002) used the Monte Carlo method to explore the free-energy landscapes of RBC shape. For the total free energy F({xn}) expressed in Eq. 1, we are able to derive the forces
 |
(12) |
in analytical forms, and implement them to perform coarse-grained molecular dynamics (CGMD) simulations (Rudd and Broughton, 1998) at T = 300 K. In the present CGMD method, we integrate the Newtonian equations of motion,
 |
(13) |
using the sixth-order Gear predictor-corrector algorithm (Allen and Tildesley, 1987) to follow the trajectories of all junction complexes {xn} with time, where  are externally applied forces on the vertices, which are set to zero for equilibrium shape determination, but are nonzero for some vertices in optical tweezers stretching simulations. Since Eq. 13 is only meant to be an efficient scheme to sample free-energy landscapes, mn is the fictitious mass of the vertex (instead of a real kinetic mass) that is arbitrarily chosen to be 107 Dalton. A constant temperature of 300 K is maintained using a feedback control scheme (Berendsen et al., 1984), with the characteristic temperature-control time constant chosen to be 300 time steps.
CYTOSKELETON STRUCTURE GENERATION
The degree of an actin vertex is defined to be the number of spectrin links that connect to it; the vertex at the center shown in Fig. 1 is a degree-6 vertex. From experimental images (Byers and Branton, 1985; Liu et al., 1987, 1990, 2003; Swihart et al., 2001), it seems reasonable to assume that the cell surface is tessellated by non-overlapping polygons, formed by joining vertices by spectrin links. Currently, the potential given in Eq. 1 can only be applied if the surface is tessellated by triangles, since only the topological triangles are guaranteed to be planar, so that Aα in the in-plane energy and nα, nβ in the bending energy are always well-defined. In contrast, the vertices of a topological square may not lie in one plane, making Aα, nα, nβ ill-defined. By partitioning topological polygons into triangles, the potential in Eq. 1 in principle may be extended in its original form to other networks; however, this partition is not unique and the computation involved seems excessive. Thus, a simpler potential using quantities similar to Aα, nα, nβ, but differing in details, may be necessary for future investigations. In this article, we construct different network structures that satisfy certain macroscopic requirements (such as isotropy, thus giving zero in-plane shear elastic energy), and analyze the general issues associated with elasticity and strength, but will stop short of doing direct stretch CGMD simulations to them due to lack of potential, except with the degree-6 dominated network, for which Eq. 1 is adapted.
A model cytoskeleton that covers an entire closed surface needs to be produced by an automated structure generator. Two kinds of network generation schemes have been used: 1), an ordered network generated by recursively dividing an icosahedron and projecting the vertices onto a spherical surface, referred to as the icosahedron network, and 2), random networks generated by adapting the inherent structure (Stillinger, 1999) of a two-dimensional liquid equilibrated on any closed surface, hereafter referred to as the random network or liquefied network. Macroscopic cell shape artifacts have been found to result with the adoption of the ordered network (Scheme 1), due to internal residual stress fields generated by the 12 topologically necessary degree-5 defects (disclinations) (Bausch et al., 2003; Gov and Safran, 2005), which are long-ranged and thus difficult to correct. Therefore, the description of the Scheme-1 generator is left in the Supplementary Materials that accompanies this article. Its only connection to the present results is that we use the Scheme-1 structure to jump-start the random network generation via random decimation and melting.
To generate a random network, we employ CGMD simulations of fictitious points constrained to move on a parametric surface, such as that of a sphere or biconcave shape. These points interact with each other via the Lennard-Jones (Allen and Tildesley, 1987) or Stillinger-Weber (Stillinger and Weber, 1985) potentials. The system of points is gradually heated until it melts to a liquid and uniformly covers the surface. This serves several purposes. First, a randomized structure is generated. Second, any possible initial long-range inhomogeneity such as a residual stress field is quickly relaxed as the particles diffuse around. At the particle level, there are local inhomogeneities; at coarser levels, there is no difference between any parts of the surface. A liquid structure ensures that the particles are neither too close nor too far away from their nearest neighbors, which is not the case for a completely random sample of points on the surface.
The CGMD simulations performed here are different from those in Results, below, for we use the Lennard-Jones or Stillinger-Weber potential instead of Eq. 1, which allows the network connectivities to change with time. (Two particles are considered nearest neighbors and connect by a bond whenever their distance is less than a cutoff distance RC, usually chosen to be the locale of the minimum between the first and second peaks of the radial distribution function.) These potentials do not have out-of-plane bending energy and surface area/volume constraints yet, so we must artificially constrain the points to move on an analytical surface. We use the three-dimensional surface formula of
 |
(14) |
which can describe a variety of surface shapes. The parameter set (R,c0,c1,c2) = (3.27 μm, 1,0,0) describes a spherical surface, whereas another parameter set (R,c0,c1,c2) = (3.91 μm, 0.1035805, 1.001279, −0.561381) describes the experimentally measured average unstressed biconcave shape (Evans and Skalak, 1980). By smoothly varying from the first parameter set to the second parameter set using a linear interpolation schedule with time, one may continuously morph a spherical surface into a biconcave surface.
The initial structure is taken from the icosahedron network with 40,962 vertices on the spherical surface. Among them, 12,289 vertices are randomly deleted. The remaining 28,673 vertices are taken to be the fictitious particles constrained to move only on the analytical surface, and interact with each other via the Lennard-Jones potential, which naturally prefers a close-packed triangular lattice at zero temperature. The lengthscale σ of the Lennard-Jones potential is chosen so the equilibrium lattice constant (a0 = 1.11145σ) of the said triangular lattice is exactly L0 = 75 nm. We then raise the temperature until the structure melts. The sphere's radius R is simultaneously shrunk continuously from 3.98 μm to 3.27 μm from beginning to the end of the simulation. We observe the onset of melting by linear growth of the mean-squared displacement of a vertex with time: |xn (t) − xn(0)|2 ∝ t, signifying the onset of self-diffusion. Inspection of configurational snapshots, e.g., Fig. 2 a, shows completely homogeneous and disordered structures, which have 61.1% degree-6 vertices, 31.7% degree-5 vertices, 6.2% degree-4 vertices, and <1% in total of degree-2, 3, 7 vertices (two vertices are considered connected if their separation is <103 nm).
FIGURE 2.
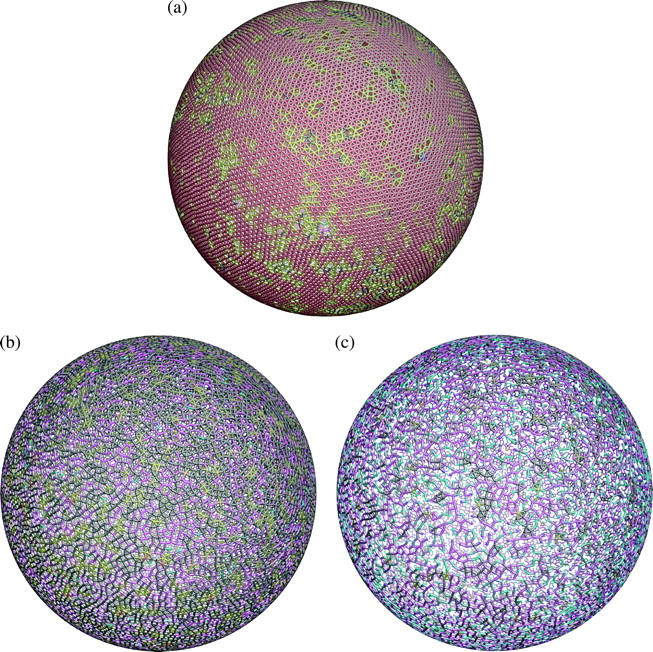
Random networks generated by equilibrating various fictitious two-dimensional liquids on a spherical surface (diameter 6.53 μm). The color of each ball labels the degree of the actin vertex (2, cyan; 3, magenta; 4, black; 5, yellow; 6, red; 7, blue; 8, green; and 9, white). (a) Degree-6 dominant network (28,673 vertices) generated by spreading Lennard-Jones liquid on the spherical surface. This network has 61.1% degree-6, 31.7% degree-5, 6.2% degree-4, and <1% in degree-2,3,7 vertices. The surface is still mainly tessellated by triangles, which allows us to use the Discher potential later on. (b) Degree-4 dominant network (24,372 vertices) with 52.8% degree-4, 30.2% degree-3, 14.2% degree-5, and 2.0% degree-2 vertices. This network has a large number of squares and pentagons, which cannot be modeled by a potential similar to Eq. 1. (c) Degree-3 dominant random network (18,637 vertices) with 46.0% degree-3, 30.4% degree-2, 15.6% degree-4, 6.4% degree-1, and 1.1% degree-5 vertices. Observe the occurrence of topological polygons with 10 sides and up, some of which have large aspect ratios. Panels b and c are created using the Stillinger-Weber potential.
We employ the network structures shown in Fig. 2 a (and Fig. 3 a) for subsequent equilibrium shape and optical tweezers stretching simulations. Since they have no residual shear stress, they do not exhibit shape artifacts like with the ordered icosahedron network (see Supplementary Materials). It is not possible to generate degree-3 or -4 dominant liquids using the Lennard-Jones potential without cavitation. Therefore, we invoke another generic potential with angular forces—the Stillinger-Weber potential (Stillinger and Weber, 1985), which naturally prefers lower coordination numbers. At the beginning of the structure generation we remove an additional 4301 and 10,036 vertices from the 28,673-vertex network shown in Fig. 2 a, so only 24,372 and 18,637 vertices remain in Fig. 2, b and c, respectively. These structures are then evolved in CGMD above the melting point on a spherical surface of radius R = 3.27 μm with the Stillinger-Weber potential, whose basic lengthscale σ is taken to be identical to that of the Lennard-Jones potential. Subsequently, after sufficiently long equilibration, the network is dominated by Fig. 2 b, degree-4; and Fig. 2 c, degree-3 vertices. Cytoskeletal networks as imaged by AFM (Takeuchi et al., 1998; Swihart et al., 2001; Liu et al., 2003) appear to be dominated by degree-3 and 4 vertices with square, pentagon, and hexagon-like tessellations. So on a phenomenological level we have created similar cytoskeleton structures in the computer, in the same spirit as the Monte Carlo methods for microstructure reconstruction (Yeong and Torquato, 1998; Torquato, 2002) and diffraction data inversion (McGreevy, 2001). Lacking guiding principles based on the underlying biochemical and physical mechanisms, our liquefied random network generator seems to be the best approach available at this time.
FIGURE 3.
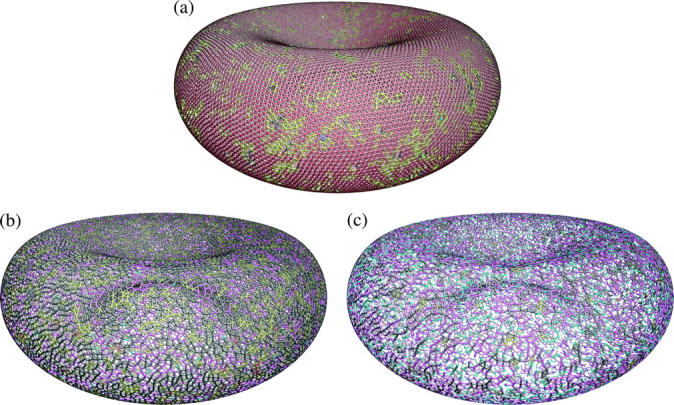
Similar as Fig. 2 except the various liquids live on a biconcave surface described by analytical formula (Eq. 14) with parameters (R,c0,c1,c2) = (3.91 μm, 0.1035805, 1.001279, and −0.561381). The same color encoding scheme as Fig. 2 is used. (a) Degree-6 dominant network (28,673 vertices). (b) Degree-4 dominant random network (24,372 vertices). (c) Degree-3 dominant random network (18,637 vertices).
The above algorithm is also related to a physical hypothesis that we propose here and will partially justify by numerical evidence later: over a timescale that is long compared to the timescale of the optical tweezers experiments, the actin vertices of the RBC do behave like a liquid as they relax the in-plane shear elastic energy, for any whole-cell shape. An equivalent analogy would be that the cytoskeleton is like a slowly-flowing two-dimensional glass, which cannot hold any shear elastic energy indefinitely. However, if fast deformation is imposed, it can manifest a large instantaneous shear modulus. This happens if the imposed deformation rate far exceeds the cytoskeleton remodeling rate, which theoretically should proceed (albeit very slowly) in the direction of relaxing the in-plane shear elastic energy according to the thermodynamic principle of maximum dissipation. A topologically frozen spectrin network thus seems to be a reasonable assumption to model optical tweezers stretching, which occurs experimentally over a timescale of seconds, and if the applied load is less than what can break individual spectrin molecules (displacement excursions beyond the WLC-like continuous force-displacement curve) by brute force. The in-plane hydrostatic energy, however, cannot be relaxed because of the overall area constraint. Swapping neighbors and changing the connectivity under the total area constraint can relax the shear energy but will do nothing to the stored hydrostatic energy. Furthermore, it seems difficult to relax the bending energy because it resides in the membrane, and molecular exchange between the two lipid layers is difficult (Mukhopadhyay et al., 2002).
Another important consequence of the present hypothesis is that when evaluating competing RBC equilibrium shapes based on free-energy minimization, we do not need to take the in-plane shear elastic energy into account since it always relaxes to zero. One only needs to consider the bending energy and in-plane hydrostatic elastic energy contributions, which cannot be relaxed by cytoskeleton remodeling, at least if the surface is to remain fully covered by a uniform cytoskeleton (no fracture occurs). Thus, even though the instantaneous in-plane shear elastic energy will be shown later to overwhelm the bending energy in optical tweezers stretching experiments, it has no bearing on determining the long-term equilibrium shape at zero stress, e.g., biconcave versus cup shape competition. This assertion agrees with the traditional bending-energy minimization concept of RBC equilibrium shape determination (Canham, 1970; Helfrich, 1973). Were this not the case, i.e., if a significant portion of the in-plane shear energy could be permanently stored with respect to a certain reference shape, then it would be nearly impossible to obtain the biconcave shape as the ground-state shape. (The trivial exception occurs when the biconcave shape is set to be the reference state.) For example, we will show that if we use the sphere as the permanent reference state for in-plane elastic energy, the bending modulus κ needs to be revised upward by a decade compared to the experimental consensus, to >2 × 10⁻¹⁸ J, to stabilize the biconcave shape versus the cup shape. The slow-liquid network hypothesis is a physically transparent and numerically consistent way to understand these disparate results.
In the next section we will show that by turning off the in-plane energy in Eq. 1, upon volume deflation of the Fig. 2 a sphere, the simulation using Eq. 1 will spontaneously give the biconcave shape as the equilibrium ground-state, confirming the classic continuum bending-energy minimization shape prediction (Canham, 1970; Helfrich, 1973). Unfortunately, we cannot use that particular biconcave cytoskeleton for deformation simulation because upon turning on the in-plane energy, which we must do to compute the optical tweezers stretching response, the biconcave cytoskeleton remembers its reference state to be the spherical state (since during the volume deflation using the Discher potential, the topology has not changed), and subsequently the biconcave shape gives way to the cup shape as we just start to stretch the cell. Theoretically, a reliquification process should accompany the volume deflation and shape changes. However, at present the random network generator can only work with analytical surface formulas. This means that to get a shear-stress relaxed biconcave cytoskeleton, we are not, at this time, able to use the numerical volume deflation with Eq. 1, but must use an analytic volume deflation scheme that can work with the random network.
We therefore morph an analytic surface from spherical to biconcave by slowly changing the parameters (R,c0,c1,c2) = (3.27 μm, 1,0,0) → (3.91 μm, 0.1035805, 1.001279, −0.561381) in Eq. 14, with Fig. 2, a–c, configurations as the starting configurations, and running CGMD on the time-varying parametric surface using the Lennard-Jones or Stillinger-Weber potential above the melting point. The surface area and coordination number of the cytoskeleton remain largely unchanged during the morphing process (see the final results Fig. 3, a–c), but the volume steadily decreases from 146 μm3 to 94.1 μm3. The Lennard-Jones and Stillinger-Weber potentials do not have the bending energy and area/volume constraints, so the shape evolution here is governed by an analytic formula rather than from the energetic model itself. The justification for this process is that once we switch on the potential in Eq. 1 for the cytoskeleton structure of a given shape, the free-standing, relaxed structure has nearly the same shape as the analytic formula, as illustrated in Fig. 4, a and b, for the biconcave shape before and after Eq. 1 relaxation, respectively. We have now achieved in Fig. 4 b configuration the ultimate goal of a free-standing biconcave cytoskeleton relaxed with the Eq. 1 potential, which is free of shear elastic energy anywhere. One can now commence optical tweezers stretching simulations with the Eq. 1 potential, using the fixed Fig. 4 b cytoskeleton connectivity.
FIGURE 4.
(a) Cross-sectional view of Fig. 3 a configuration, obtained by constraining the CGMD vertices to an analytical surface formula, Eq. 14. (b) Relaxed cytoskeleton after removing the Eq. 14 analytical constraint and turning on the Eq. 1 potential. The vertices can no longer change their connectivities in b, in contrast to in a. The shape of b is not entirely symmetric due to thermal fluctuations. The parameters used are: L0 = 75 nm, Lmax = 3.17 L0 = 237.75 nm, p = 0.1 L0 = 7.5 nm, q = 1, ksurface = 600, kvolume = 600, and kbend = 200 kBT, θ0 = 1°. (c) Relaxed cytoskeleton if we use Eq. 15 bending energy expression instead of Eq. 4. Panels b and c have nearly the same shape, and deviate only slightly from the analytic shape (a).
There are legitimate concerns about the validity of using Eq. 4 when the triangles are not of equal sizes and shapes. This issue falls in the general category of how to properly express bending energy in terms of the discrete vertices of topological polygons. A complete treatment of this problem may involve least-square fitting of all the vertices of adjacent topological polygons by a smooth surface patch to extract the local curvatures, and also obtaining the projected areas of these topological polygons onto that fitted mathematical surface. Although this problem inevitably requires detailed further study, for the present purposes, we test a simple variation of Eq. 4,
 |
(15) |
in which the bending energy contribution from two adjacent triangles is weighted by their area product and normalized by the mean product over all such triangle pairs, to reflect the fact that smaller adjacent plaquettes should give smaller contributions. Although Eq. 15 is far from a rigorous approximation of Eq. 6 for all limiting cases, the fact that the final relaxed shape shown in Fig. 4 c using the Eq. 15 bending energy expression is only very slightly different from Fig. 4 b using Eq. 4, suggests that this correction may not be very important numerically.
For reference, the low-coordination cytoskeletons on the biconcave surface are shown in Fig. 3, b and c, obtained using the same analytic morphing procedure as the configuration in Fig. 3 a and Fig. 4 a. We note that as the average coordination number decreases, larger and larger holes appear in the network. For instance, we can easily find 10-sided-and-up polygons in Fig. 3 c, which are absent in Fig. 3, a or b. By inspecting the AFM micrographs (Takeuchi et al., 1998; Swihart et al., 2001), it appears that Fig. 3 b best resembles real cytoskeleton micrographs. We have also performed CGMD liquefied structure simulations at even lower spectrin densities, and found that large holes start to percolate when the average vertex coordination drops below 3.
RESULTS
In the CGMD simulations given below using the potential from Eq. 1, we use degree-6 dominated random networks. In the program we simply ignore polygons that are not triangles, which are small minorities in these networks (Figs. 2 a, 3 a, and 4 b), and do not add their contributions in the Hamiltonian. Note that the network topology is fixed in the ensuing simulation. Therefore, if the starting cytoskeleton happens to have zero shear elastic energy such as Fig. 2 a, that state essentially serves as the permanent reference state of in-plane shear energy for the ensuing simulations using Eq. 1.
Equilibrium shape determination
Our simulations in this section employ full-cell models without imposing any artificial constraints such as axisymmetric shape or even planar reflection symmetry (half-cell model). To eliminate as much of any possible bias toward any particular shape as possible, the starting geometry for the simulation is a perfect sphere whose surface comprises the triangulated spectrin network. The surface area of this sphere is intended to be the same as the actual RBC, which is achieved almost exactly in the random network ( μm2) such as Fig. 2 a. The RBC is initially completely filled with cytosol. The initial volume of the cytosol is thus significantly higher than that in a biconcave RBC. As the simulation progresses with time t, the cytosol volume
  is reduced slowly using what is termed here as volume deflation. The initial desired volume is
  with
with  being the volume of the perfect sphere with surface area
  The final desired volume is set to be
  to match the RBC volume. The simulation is performed with a linear deflation schedule,
 |
(16) |
while keeping  fixed.
Since prior calculations (Discher et al., 1998; Lee et al., 1999) did not report the generation of biconcave equilibrium shape for the RBC, we first seek to obtain the equilibrium shape directly by the original formulation, Eq. 1. The parameters used in the initial simulations (L0 = 75 nm, Lmax = 3.17 L0 = 237.75 nm, p = 0.075 L0 = 5.625 nm, q = 1, ksurface = 600, kvolume = 600, kbend = 69 kBT, θ0 = 0) are identical to those employed in the earlier stress-free model (see Discher et al., 1998). This parameter set leads to the following linear elastic properties for the cytoskeleton-lipid bilayers composite cell wall: shear modulus μ = 11 μN/m; area dilatational modulus K = 22 μN/m; uniaxial tension Young's modulus E = 29 μN/m; Poisson's ratio ν = 1/3; and average bending modulus κ = 8.3 × 10⁻²⁰ J. In deriving the above properties we have followed the approach of Discher et al. (1997) and Hansen et al. (1997). The analytic derivations are described briefly in the Supplementary Materials and in detail in J. Li, M. Dao, and S. Suresh (unpublished data).
If the original formulation is used, and if we adopt the spherical state as the reference state for in-plane shear energy (because the connectivity of the deflated cytoskeleton is inherited from the spherical cytoskeleton), then the biconcave shape cannot be stabilized using the original parameter set. Instead, the cup-shape (Fig. 5) is the ground state. At kbend = 69 kBT, the biconcave shape is metastable and is so weak that even a small thermal fluctuation can transform it into the cup shape, via a long-wavelength soft mode (Peterson, 1985) that breaks the top-bottom reflection symmetry of the biconcave cell.
FIGURE 5.

Cup-shape cytoskeleton as the global energy minimum obtained using Eq. 1, and with the spherical cytoskeleton Fig. 2 a as the initial (and therefore the reference) state, after deflation procedure at 65% cytosol volume. The parameters used are: L0 = 75 nm, Lmax = 3.17 L0 = 237.75 nm, p = 0.075 L0 = 5.625 nm, q = 1, ksurface = 600, kvolume = 600, and kbend = 69 kBT, θ0 = 0, which gives the shear modulus μ = 11 μN/m; area dilatational modulus K = 22 μN/m; uniaxial tension Young's modulus E = 29 μN/m; Poisson's ratio ν = 1/3; and average bending modulus κ = 8.3 × 10⁻²⁰ J. The cup-shape is found to be the ground-state unless we increase κ beyond 2 × 10⁻¹⁸ J keeping other parameters fixed, or if we use another reference state, such as Fig. 4 b, which already has the in-plane shear stress relaxed to zero.
As we raise kbend from 69 kBT to 1000 kBT while keeping the other parameters fixed, we observe active competition between the biconcave and the cup shape. However, it is not until kbend ≈ 4000 kBT, or κ ≈ 5 × 10⁻¹⁸ J, that the biconcave ground state becomes dominant, in the sense that from any random shape the cell quickly relaxes to a biconcave shape that looks similar to Fig. 4 b.
Assuming the fixed-topology cytoskeleton with the spherical cytoskeleton as the reference state is the correct model, we realize that the equilibrium shape is mainly controlled by the competition between the bending energy Fbending and the in-plane elastic energy Fin-plane in the Hamiltonian (Eq. 1). From dimensional analysis, it can be argued that the total bending energy for the whole cell scales as κ, whereas the total in-plane deformation energy scales with  For the discocyte shape to occur as possible global energy minimum, the dimensionless ratio,
 |
(17) |
must be greater than a critical value λd, with λd ∼10−3. Otherwise, the stomatocyte (cup) shape easily wins over the discocyte shape by virtue of lower free energy. Lim et al. (2002) used μ = 2.5 μN/m and κ = 2.0 × 10⁻¹⁹ J, which gives λ = 6 × 10⁻⁴. However, their model is slightly different, using an ellipsoidal state as the shear stress-free reference state. They also noted that the biconcave ground state is nontrivial to achieve, with necessary fine-tuning in the stress-free reference state.
As will be seen next, our optical tweezers experiments indicate that μ is in the range of 4–10 μN/m (Mills et al., 2004). If the fixed-topology model with the sphere as the reference state is correct, then κ needs to be at least 1 × 10⁻¹⁸ J for the biconcave shape to be stable; and for the minimum to be really robust, κ needs to be ∼2 × 10⁻¹⁸ J. However, recent experimental measurements of κ seem to converge on ∼2 × 10⁻¹⁹ J (Ben-Jacob, 2002; Humpert and Baumann, 2003). Thus, it seems that the spherical reference state for in-plane elastic energy is likely to be incorrect.
Another popular choice of the zero shear energy reference state is the discocyte itself (Zarda et al., 1977), in which case the stabilization of the discocyte as ground state is almost trivial because any other shape would have positive shear strain energy. Therefore, one only needs to make sure that the discocyte has lower bending energy than other shapes to guarantee it to be the ground state. This is the case for a rather wide range of cell volume and θ0 (Canham, 1970; Helfrich, 1973; Seifert et al., 1991). To independently check this we artificially scale Fin-plane down to 1% of its original magnitude in the CGMD simulation, effectively turning off Fin-plane. We then perform volume deflation, and indeed observe spontaneous shape change from spherical to biconcave, and that the biconcave shape minimum is stable against very large random shape disturbances. This confirms the bending-energy minimization concept (Canham, 1970; Helfrich, 1973) of RBC equilibrium shape selection.
We thus face a dilemma in choosing a material reference state for the in-plane elastic energy. Although it is appealing to use a problem-independent reference state such as a flat plate, or a spherical surface, it deviates from experimental range of parameters. On the other hand, although using a position-dependent reference state gives the correct behavior, it seems too trivial because one easily obtains the shape one puts in. It therefore seems that a good policy is to ignore the in-plane shear energy (assuming it to be zero) during equilibrium shape optimization, but turn it on in subsequent optical tweezers stretching simulation. This dichotomy can be rationalized microscopically if we assume that cytoskeleton remodeling occurs at a timescale much slower than the optical tweezers loading rate; thus, whereas the long time behavior of the cytoskeleton could be like a liquid or a glass, the short time behavior is elastic. This completes the rationale for the hypothesis proposed in the last section. Phenomenological models are invoked here to describe the network structure evolution for fixed shapes and during shape morphing, by simulating various two-dimensional liquids on the surface, which, given enough time, always relaxes the shear strain energy to zero, for any shape.
Optical tweezers simulation
It is well known that for the RBC (equilibrium diameter ∼8 μm) to pass through small capillaries, the narrowest of which is only ∼3 μm in inner diameter, the cell needs to transform from the equilibrium biconcave shape to a bullet or parachute shape (Fung, 1993), with maximum in-plane strain in some part of the membrane on the order of 100%. This condition is somewhat mimicked in our optical tweezers experiments. A back-of-the-envelope calculation indicates that when stretched by the optical tweezers to a maximum axial strain of ∼100%, elastic energy on the order of 5000 eV (∼200 pN × 8 μm/2) is injected into the cell. This energy is mostly taken up by the in-plane shear elastic energy, which overwhelms the original bending energy that is on the order of 10–100 eV.
In the optical tweezers experiments (Mills et al., 2004) with which our computations are compared, two diametrically opposite ends of an RBC are firmly and nonspecifically attached to silica beads; one bead is translated through contact with a glass slide, whereas the other is trapped by the laser. In the present simulations, we apply time-dependent total force Fext(t) to N+ = 0.05N vertices of the cytoskeleton in the x-direction (an arbitrary axial diameter direction shown in Fig. 6 a), which are chosen to be 5% of vertices that have the largest x-coordinates at the beginning of the simulation. Correspondingly, apply −Fext(t) total force to N− = 0.05N vertices that have the smallest x-coordinates at the beginning of the simulation. Thus,  if vertex n is in N+/N−, and 0 if otherwise. The axial diameter is computed as a function of time by |xmax − xmin|, where xmax is the maximum x position among the N+ atoms, and xmin is the minimum x position among the N− atoms. The transverse diameter is computed as
  when the coordinate frame origin is placed at the center of mass of the RBC.
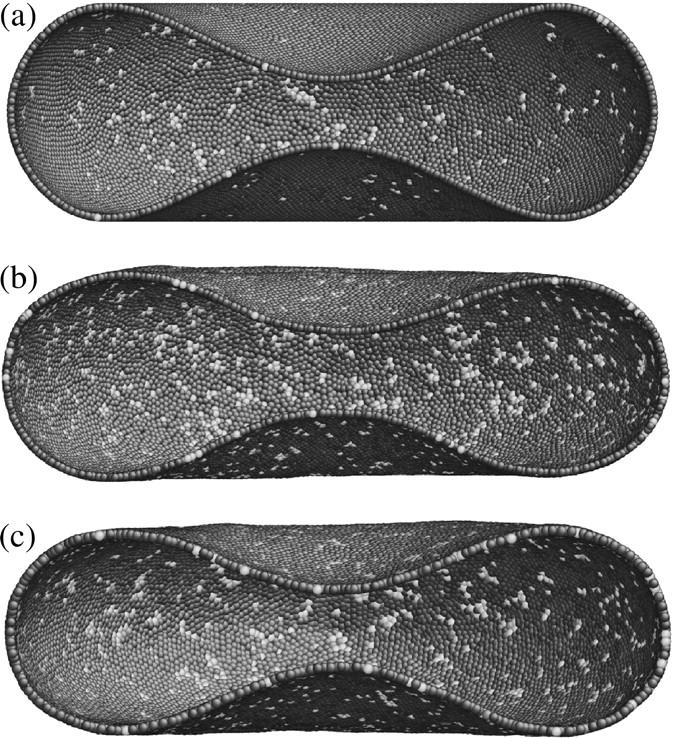
FIGURE 6.
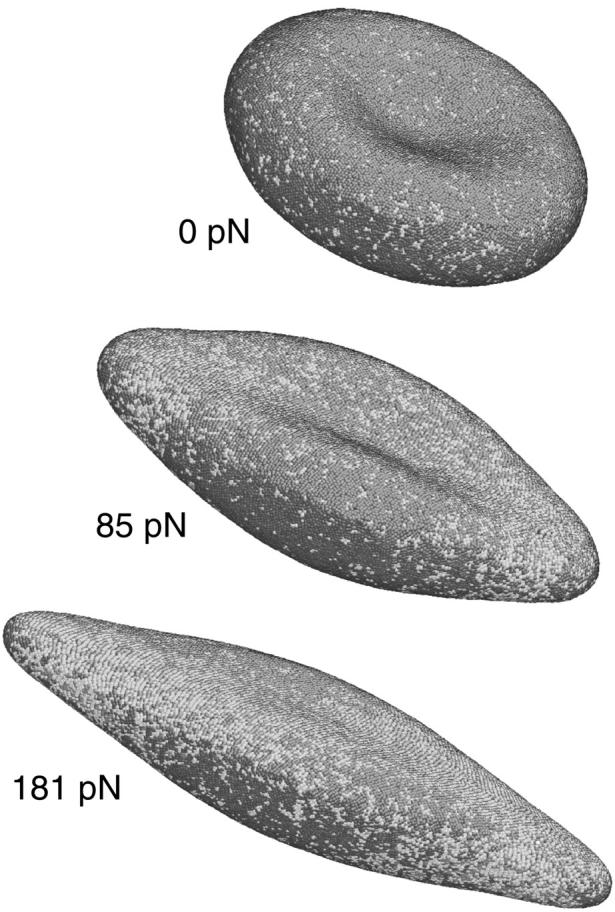
RBC shape evolution at different optical tweezers stretch forces using Eq. 1 and Fig. 4 b cytoskeleton initial state. The parameters used are: L0 = 75 nm, Lmax = 3.17 L0 = 237.75 nm, p = 0.1 L0 = 7.5 nm, q = 1, ksurface = 600, kvolume = 600, and kbend = 200 kBT, θ0 = 1°. This parameter set gives shear modulus μ = 8.3 μN/m; area dilatational modulus K = 16.6 μN/m; uniaxial tension Young's modulus E = 22.1 μN/m; Poisson's ratio ν = 1/3; and average bending modulus κ = 2.4 × 10⁻¹⁹ J.
The CGMD simulation is carried out with the following parameters: L0 = 75 nm, Lmax = 3.17 L0 = 238 nm, p = 0.1 L0 = 7.5 nm, q = 1, ksurface = 600, kvolume = 600, kbend = 200 kBT, θ0 = 1°. This parameter set leads to the following linear elastic properties for the cytoskeleton-lipid bilayers composite: shear modulus μ = 8.3 μN/m; area dilatational modulus K = 16.6 μN/m; uniaxial tension Young's modulus E = 22.1 μN/m; Poisson's ratio ν = 1/3; and average bending modulus is κ = 2.4 × 10⁻¹⁹ J. Snapshots of the cytoskeleton at intermediate stretching forces are shown in Fig. 6. To retest the issue of the choice of bending energy expression used, we compared the cross sections obtained using Eq. 4 and Eq. 15 in Fig. 7, at the intermediate load of 100 pN. We see that the differences are rather small.
FIGURE 7.
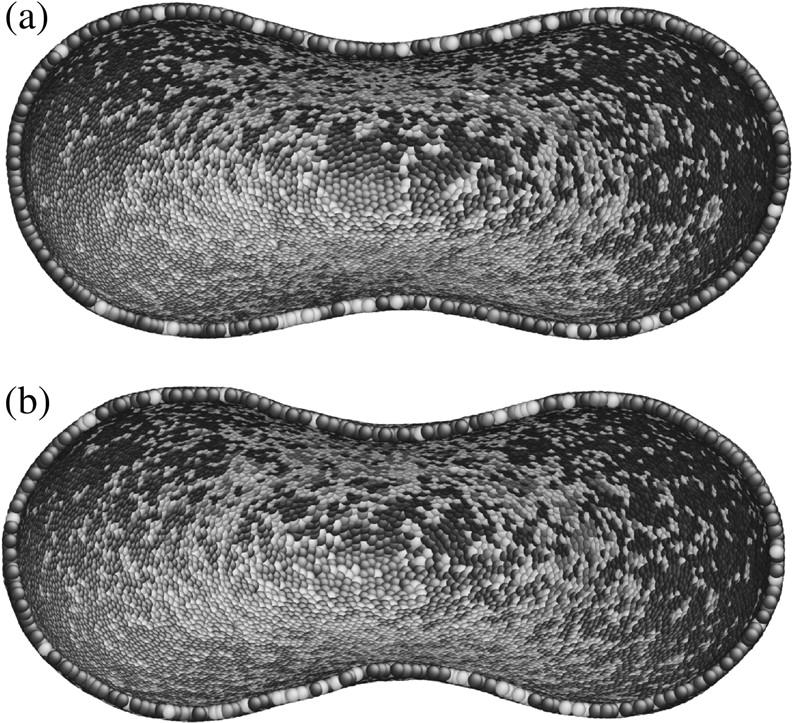
RBC cross sections calculated at optical tweezers stretch load of 100 pN, with the parameters of Fig. 6, using (a) bending energy expression Eq. 4, or (b) bending energy expression Eq. 15.
Fig. 8 shows the computed variation, for the initial free-standing cytoskeleton shown in Fig. 4 b, of the increase in the axial diameter and the decrease in the transverse diameter of the RBC as a function of the force applied by the optical tweezers up to a maximum value of ∼200 pN. Also superimposed on these predictions, for comparison, are the experimental measurements of changes in these diameters as a function of the optical force and a fully three-dimensional finite-element simulation based on a continuum, large deformation, third-order hyperelasticity model for the deformation of the RBC membrane comprising the cytosol of fixed volume (see Dao et al., 2003 and Mills et al., 2004 for further details). In the finite-element simulations, the key parameters of interest in the characterization of large deformation of the RBC are the in-plane shear modulus μ and the bending modulus κ. For the accepted range of literature values of κ = 1 × 10⁻¹⁹ ∼9 × 10⁻¹⁹ J for the human red blood cell (Evans and Skalak, 1980; Sleep et al., 1999), negligible influences were found in both the axial and transverse responses with respect to κ (Dao et al., 2003; Mills et al., 2004). The finite-element results were thus computed using a typical value of bending modulus with κ = 2 × 10⁻¹⁹ J. The third-order hyperelasticity model (Mills et al., 2004) used in finite-element simulations entails an initial in-plane shear modulus (μ0) and one at large stretch ratios (μf). From Mills et al. (2004), we estimate that μ0 = 7.3 μN/m (5.3 ∼11.3 μN/m range covers most of the data scatter). Fig. 8 shows the finite-element model predictions of the axial and transverse cell diameters using an initial shear modulus value of 8.0 μN/m. The finite-element model curve shown here takes the third-order hyperelasticity constant C3 to be G0/20 in Eq. 4 b of Mills et al. (2004).
FIGURE 8.

Optical tweezers stretching response up to a maximal tensile load of 200 pN. The figure shows experimental data of stretching force versus axial and transverse diameters of the RBC, from Mills et al. (2004). Also shown are the three-dimensional finite-element simulations of the large deformation of RBC using a hyperelasticity constitutive model for the cell membrane (Dao et al., 2003; Mills et al., 2004). See text for further discussion of this model and for choice of material parameters. Results from the present spectrin-level simulations using CGMD techniques are shown as solid lines.
Fig. 8 also reveals the predicted variation, from the present spectrin-level model, of axial and transverse diameters of the RBC subjected to large deformation by optical tweezers. The shear modulus of 8.3 μN/m so estimated is fully consistent with values of 4–9 μN/m reported in the literature (e.g., Boal, 2002) on the basis of micropipette aspiration experiments. CGMD simulations of increase in axial diameter during large deformation match experiments well, whereas the attendant decrease in transverse diameter overpredicts experimental and finite-element results by ∼15%.
There are also some significant discrepancies at small-to-intermediate strain ranges, namely the CGMD response appears to be too stiff initially. In the finite-element simulations (Dao et al., 2003; Mills et al., 2004), it is necessary to adopt a third-order hyperelasticity model to fit the experimental data well; that is, to capture the hardening effect at large stretch ratios. The close matching of simulations versus experiments depends on the detailed strain hardening response of the hyperelasticity model. The uniaxial stress-strain response of the homogenized WLC sheet (see Supplementary Materials) indeed hardens, but at above 50% tensile strain and comes too late to allow a better match between the CGMD simulation and the experimental results in Fig. 8. The purely entropic WLC spring is, therefore, not likely to be a perfect representation of the spectrin molecule and associated proteins, and some enthalpic contributions may be necessary to initiate the hardening response earlier. The present formulation allows easy replacement of the WLC relation Eq. 8 by any other single-molecule force-displacement response that can be measured experimentally (Evans and Ritchie, 1997; Grandbois et al., 1999; Bustamante et al., 2003).
CONCLUSION
This article reports fully three-dimensional, spectrin-level random network models of full-cell equilibrium shape evolution and large elastic deformation in human red blood cells. In addition, we have formulated a new network generation algorithm that relaxes shear stress everywhere in the network and generates cytoskeleton structures that are consistent with microscopy observations. A significant outcome of the computational simulations predicated on this exercise is the realization that when the spectrin network is permitted to undergo constant remodeling so as to fully relax the in-plane elastic energy at any macroscopic shape, accepted literature values of elastic moduli values stabilize the stress-free equilibrium discocyte shape. We also demonstrate the evolution of discocyte and stomatocyte shapes based on the approach of Discher and co-workers (Discher et al., 1997, 1998; Boey et al., 1998; Lee et al., 1999) and discuss the competitions between these shapes in relation to the potential parameters and reference state used. The computational methods of this work are also used to develop spectrin-level simulations of RBC deformation using optical tweezers. The predicted deformation characteristics are seen to compare reasonably with recent experimental data.
SUPPLEMENTARY MATERIALS
Description of the icosahedron network generation scheme and the analytical derivations of the elastic constants and nonlinear stress-strain responses of homogenized WLC sheet can be found in an online supplement to this article, at BJ Online at http://www.biophysj.org.
Supplementary Material
Acknowledgments
The hospitality of colleagues at Institut Pasteur, Ecole Polytechnique, Centre Nationale Recherche Scientifique, and Ecole Nationale Superieure des Mines in Paris during the sabbatical leave of S.S., is gratefully acknowledged. The work also involved use of computational facilities in the Laboratory for Experimental and Computational Micromechanics at the Massachusetts Institute of Technology.
J.L. acknowledges support by Honda R&D Co., Ltd., the National Science Foundation, Air Force Office of Scientific Research, Office of Naval Research, and the Ohio Supercomputer Center. S.S. acknowledges support from the Singapore-MIT Alliance and the Ford Endowed Professorship.
References
- Allen, M. P., and D. J. Tildesley. 1987. Computer Simulation of Liquids. Clarendon Press, New York.
- Bao, G., and S. Suresh. 2003. Cell and molecular mechanics of biological materials. Nature Mater. 2:715–725. [DOI] [PubMed] [Google Scholar]
- Bausch, A. R., M. J. Bowick, A. Cacciuto, A. D. Dinsmore, M. F. Hsu, D. R. Nelson, M. G. Nikolaides, A. Travesset, and D. A. Weitz. 2003. Grain boundary scars and spherical crystallography. Science. 299:1716–1718. [DOI] [PubMed] [Google Scholar]
- Ben-Jacob, E. 2002. When orders come naturally. Nature. 415:370. [Google Scholar]
- Berendsen, H. J. C., J. P. M. Postma, W. F. Vangunsteren, A. Dinola, and J. R. Haak. 1984. Molecular dynamics with coupling to an external bath. J. Chem. Phys. 81:3684–3690. [Google Scholar]
- Boal, D. H. 2002. Mechanics of the Cell. Cambridge University Press, New York.
- Boal, D. H., and M. Rao. 1992. Topology changes in fluid membranes. Phys. Rev. A. 46:3037–3045. [DOI] [PubMed] [Google Scholar]
- Boal, D. H., U. Seifert, and A. Zilker. 1992. Dual network model for red blood cell membranes. Phys. Rev. Lett. 69:3405–3408. [DOI] [PubMed] [Google Scholar]
- Boey, S. K., D. H. Boal, and D. E. Discher. 1998. Simulations of the erythrocyte cytoskeleton at large deformation. I. Microscopic models. Biophys. J. 75:1573–1583. [DOI] [PMC free article] [PubMed] [Google Scholar]
- Bustamante, C., Z. Bryant, and S. B. Smith. 2003. Ten years of tension: single-molecule DNA mechanics. Nature. 421:423–427. [DOI] [PubMed] [Google Scholar]
- Byers, T. J., and D. Branton. 1985. Visualization of the protein associations in the erythrocyte-membrane skeleton. Proc. Natl. Acad. Sci. USA. 82:6153–6157. [DOI] [PMC free article] [PubMed] [Google Scholar]
- Canham, P. B. 1970. The minimum energy of bending as a possible explanation of the biconcave shape of the human red blood cell. J. Theor. Biol. 26:61–81. [DOI] [PubMed] [Google Scholar]
- Cooke, B. M., N. Mohandas, and R. L. Coppell. 2001. The malaria-infected red blood cell: structural and functional changes. Advances in Parasitology. 26:1–86. [DOI] [PMC free article] [PubMed] [Google Scholar]
- Dao, M., C. T. Lim, and S. Suresh. 2003. Mechanics of human red blood cell deformed by optical tweezers. J. Mech. Phys. Solids. 51:2259–2280. Also see Erratum, 53:493–494. [Google Scholar]
- Discher, D. E., D. H. Boal, and S. K. Boey. 1997. Phase transitions and anisotropic responses of planar triangular nets under large deformation. Phys. Rev. E. 55:4762–4772. [Google Scholar]
- Discher, D. E., D. H. Boal, and S. K. Boey. 1998. Simulations of the erythrocyte cytoskeleton at large deformation. II. Micropipette aspiration. Biophys. J. 75:1584–1597. [DOI] [PMC free article] [PubMed] [Google Scholar]
- Discher, D. E., N. Mohandas, and E. A. Evans. 1994. Molecular maps of red-cell deformation—hidden elasticity and in-situ connectivity. Science. 266:1032–1035. [DOI] [PubMed] [Google Scholar]
- Dobereiner, H. G., E. Evans, M. Kraus, U. Seifert, and M. Wortis. 1997. Mapping vesicle shapes into the phase diagram: A comparison of experiment and theory. Phys. Rev. E. 55:4458–4474. [Google Scholar]
- Elgsaeter, A., B. T. Stokke, A. Mikkelsen, and D. Branton. 1986. The molecular basis of erythrocyte shape. Science. 234:1217–1223. [DOI] [PubMed] [Google Scholar]
- Elson, E. L. 1988. Cellular mechanics as an indicator of cytoskeletal structure and function. Annu. Rev. Biophys. Biophys. Chem. 17:397–430. [DOI] [PubMed] [Google Scholar]
- Evans, E., and K. Ritchie. 1997. Dynamic strength of molecular adhesion bonds. Biophys. J. 72:1541–1555. [DOI] [PMC free article] [PubMed] [Google Scholar]
- Evans, E. A. 1973. New membrane concept applied to analysis of fluid shear-deformed and micropipette-deformed red blood cells. Biophys. J. 13:941–954. [DOI] [PMC free article] [PubMed] [Google Scholar]
- Evans, E. A., and R. Skalak, editors. 1980. Mechanics and Thermodynamics of Biomembranes. CRC Press, Boca Raton, FL.
- Fung, Y. C. 1993. Biomechanics: Mechanical Properties of Living Tissues, 2nd Ed. Springer-Verlag, New York.
- Gov, N. S., and S. A. Safran. 2005. Red blood cell membrane fluctuations and shape controled by ATP-induced cytoskeletal defects. Biophys. J. 88:1859–1874. [DOI] [PMC free article] [PubMed] [Google Scholar]
- Grandbois, M., M. Beyer, M. Rief, H. Clausen-Schaumann, and H. E. Gaub. 1999. How strong is a covalent bond? Science. 283:1727–1730. [DOI] [PubMed] [Google Scholar]
- Grum, V. L., D. N. Li, R. I. MacDonald, and A. Mondragon. 1999. Structures of two repeats of spectrin suggest models of flexibility. Cell. 98:523–535. [DOI] [PubMed] [Google Scholar]
- Hansen, J. C., R. Skalak, S. Chien, and A. Hoger. 1997. Influence of network topology on the elasticity of the red blood cell membrane skeleton. Biophys. J. 72:2369–2381. [DOI] [PMC free article] [PubMed] [Google Scholar]
- Helfrich, W. 1973. Elastic properties of lipid bilayers—theory and possible experiments. Z. Naturforschung C. 28:693–703. [DOI] [PubMed] [Google Scholar]
- Henon, S., G. Lenormand, A. Richert, and F. Gallet. 1999. A new determination of the shear modulus of the human erythrocyte membrane using optical tweezers. Biophys. J. 76:1145–1151. [DOI] [PMC free article] [PubMed] [Google Scholar]
- Hochmuth, R. M., N. Mohandas, and P. I. Blackshe. 1973. Measurement of elastic-modulus for red-cell membrane using a fluid mechanical technique. Biophys. J. 13:747–762. [DOI] [PMC free article] [PubMed] [Google Scholar]
- Humpert, C., and M. Baumann. 2003. Local membrane curvature affects spontaneous membrane fluctuation characteristics. Mol. Membr. Biol. 20:155–162. [DOI] [PubMed] [Google Scholar]
- Lee, J. C. M., and D. E. Discher. 2001. Deformation-enhanced fluctuations in the red cell skeleton with theoretical relations to elasticity, connectivity, and spectrin unfolding. Biophys. J. 81:3178–3192. [DOI] [PMC free article] [PubMed] [Google Scholar]
- Lee, J. C. M., D. T. Wong, and D. E. Discher. 1999. Direct measures of large, anisotropic strains in deformation of the erythrocyte cytoskeleton. Biophys. J. 77:853–864. [DOI] [PMC free article] [PubMed] [Google Scholar]
- Lenormand, G., S. Henon, A. Richert, J. Simeon, and F. Gallet. 2003. Elasticity of the human red blood cell skeleton. Biorheology. 40:247–251. [PubMed] [Google Scholar]
- Lim, H. W. G., M. Wortis, and R. Mukhopadhyay. 2002. Stomatocyte-discocyte-echinocyte sequence of the human red blood cell: evidence for the bilayer-couple hypothesis from membrane mechanics. Proc. Natl. Acad. Sci. USA. 99:16766–16769. [DOI] [PMC free article] [PubMed] [Google Scholar]
- Liu, F., J. Burgess, H. Mizukami, and A. Ostafin. 2003. Sample preparation and imaging of erythrocyte cytoskeleton with the atomic force microscopy. Cell Biochem. Biophys. 38:251–270. [DOI] [PubMed] [Google Scholar]
- Liu, S. C., L. H. Derick, P. Agre, and J. Palek. 1990. Alteration of the erythrocyte-membrane skeletal ultrastructure in hereditary spherocytosis, hereditary elliptocytosis, and pyropoikilocytosis. Blood. 76:198–205. [PubMed] [Google Scholar]
- Liu, S. C., L. H. Derick, and J. Palek. 1987. Visualization of the hexagonal lattice in the erythrocyte-membrane skeleton. J. Cell Biol. 104:527–536. [DOI] [PMC free article] [PubMed] [Google Scholar]
- Marchesi, V. T. 1985. Stabilizing infrastructure of cell membranes. Annu. Rev. Cell Biol. 1:531–561. [DOI] [PubMed] [Google Scholar]
- Marko, J. F., and E. D. Siggia. 1995. Stretching DNA. Macromolecules. 28:8759–8770. [Google Scholar]
- McGreevy, R. L. 2001. Reverse Monte Carlo modelling. J. Phys. Condens. Matter. 13:R877–R913. [DOI] [PubMed] [Google Scholar]
- Miao, L., U. Seifert, M. Wortis, and H. G. Dobereiner. 1994. Budding transitions of fluid-bilayer vesicles—the effect of area-difference elasticity. Phys. Rev. E. 49:5389–5407. [DOI] [PubMed] [Google Scholar]
- Mills, J. P., L. Qie, M. Dao, C. T. Lim, and S. Suresh. 2004. Nonlinear elastic and viscoelastic deformation of the human red blood cell with optical tweezers. Mech. Chem. Biosys. 1:169–180. [PubMed] [Google Scholar]
- Mohandas, N., and E. Evans. 1994. Mechanical properties of the red cell membrane in relation to molecular structure and genetic defects. Annu. Rev. Biophys. Biomol. Struct. 23:787–818. [DOI] [PubMed] [Google Scholar]
- Mukhopadhyay, R., G. Lim, and M. Wortis. 2002. Echinocyte shapes: bending, stretching, and shear determine spicule shape and spacing. Biophys. J. 82:1756–1772. [DOI] [PMC free article] [PubMed] [Google Scholar]
- Peterson, M. A. 1985. An instability of the red-blood cell shape. J. Appl. Phys. 57:1739–1742. [Google Scholar]
- Platt, O. S. 1995. The Sickle Syndrome. J.B. Lippincott, Philadelphia, PA.
- Rand, R. P., and A. C. Burton. 1964. Mechanical properties of red cell membrane. I. Membrane stiffness and intracellular pressure. Biophys. J. 4:115–135. [DOI] [PMC free article] [PubMed] [Google Scholar]
- Rudd, R. E., and J. Q. Broughton. 1998. Coarse-grained molecular dynamics and the atomic limit of finite elements. Phys. Rev. B. 58:R5893–R5896. [Google Scholar]
- Seifert, U., K. Berndl, and R. Lipowsky. 1991. Shape transformations of vesicles—phase-diagram for spontaneous-curvature and bilayer-coupling models. Phys. Rev. A. 44:1182–1202. [DOI] [PubMed] [Google Scholar]
- Skalak, R., A. Tozeren, R. P. Zarda, and S. Chien. 1973. Strain energy function of red blood cell membranes. Biophys. J. 13:245–264. [DOI] [PMC free article] [PubMed] [Google Scholar]
- Sleep, J., D. Wilson, R. Simmons, and W. Gratzer. 1999. Elasticity of the red cell membrane and its relation to hemolytic disorders: an optical tweezers study. Biophys. J. 77:3085–3095. [DOI] [PMC free article] [PubMed] [Google Scholar]
- Stillinger, F. H. 1999. Exponential multiplicity of inherent structures. Phys. Rev. E. 59:48–51. [Google Scholar]
- Stillinger, F. H., and T. A. Weber. 1985. Computer simulation of local order in condensed phases of silicon. Phys. Rev. B. 31:5262–5271. [DOI] [PubMed] [Google Scholar]
- Suresh, S., J. Spatz, J. P. Mills, A. Micoulet, M. Dao, C. T. Lim, M. Beil, and T. Seufferlein. 2005. Connections between single cell biomechanics and human disease states: gastrointestinal cancer and malaria. Acta Biomaterialia. 1:15–30. [DOI] [PubMed] [Google Scholar]
- Swihart, A. H., J. M. Mikrut, J. B. Ketterson, and R. C. MacDonald. 2001. Atomic force microscopy of the erythrocyte membrane skeleton. J. Microsc. (Oxford). 204:212–225. [DOI] [PubMed] [Google Scholar]
- Takeuchi, M., H. Miyamoto, Y. Sako, H. Komizu, and A. Kusumi. 1998. Structure of the erythrocyte membrane skeleton as observed by atomic force microscopy. Biophys. J. 74:2171–2183. [DOI] [PMC free article] [PubMed] [Google Scholar]
- Torquato, S. 2002. Random Heterogeneous Materials: Microstructure and Macroscopic Properties. Springer, New York.
- Winkelmann, J. C., and B. G. Forget. 1993. Erythroid and nonerythroid spectrins. Blood. 81:3173–3185. [PubMed] [Google Scholar]
- Yeong, C. L. Y., and S. Torquato. 1998. Reconstructing random media. Phys. Rev. E. 57:495–506. [Google Scholar]
- Zarda, P. R., S. Chien, and R. Skalak. 1977. Elastic deformations of red blood cells. J. Biomech. 10:211–221. [DOI] [PubMed] [Google Scholar]
Associated Data
This section collects any data citations, data availability statements, or supplementary materials included in this article.