

Abstract
Microtubule-based transport is critical for trafficking of organelles, organization of endomembranes, and mitosis. The driving force for microtubule-based transport is provided by microtubule motors, which move organelles specifically to the plus or minus ends of the microtubules. Motor proteins of opposite polarities are bound to the surface of the same cargo organelle. Transport of organelles along microtubules is discontinuous and involves transitions between movements to plus or minus ends or pauses. Parameters of the movement, such as velocity and length of runs, provide important information about the activity of microtubule motors, but measurement of these parameters is difficult and requires a sophisticated decomposition of the organelle movement trajectories into directional runs and pauses. The existing algorithms are based on establishing threshold values for the length and duration of runs and thus do not allow to distinguish between slow runs and pauses, making the analysis of the organelle transport incomplete. Here we describe a novel algorithm based on multiscale trend analysis for the decomposition of organelle trajectories into plus- or minus-end runs, and pauses. This algorithm is self-adapted to the characteristic durations and velocities of runs, and allows reliable separation of pauses from runs. We apply the proposed algorithm to compare regulation of microtubule transport in fish and Xenopus melanophores and show that the general mechanisms of regulation are similar in the two pigment cell types.
INTRODUCTION
Intracellular transport is critical for the delivery of organelles to various cellular destinations and for the spatial organization of the cytoplasm (Lane and Allan, 1998). The driving force for the transport is provided by molecular motors of kinesin, dynein, and myosin families (Vale, 2003) that are bound to the surface of cargo organelles (Kamal and Goldstein, 2002; Karcher et al., 2002). Molecular motors interact with cytoskeletal elements, microtubules (MTs), or actin filaments, which serve as “rails” for the transport (Lane and Allan, 1998). The direction of transport is determined by polarity of MTs and actin filaments and the ability of molecular motors to read this polarity and move cargoes specifically to plus or minus ends of the cytoskeletal tracks.
Opposite-polarity MT motors are bound to the surface of the same cargo organelles (Lane and Allan, 1998). As a result, MT-based transport is discontinuous and involves transitions between the three states—displacements to MT plus or minus ends and pauses (Gross et al., 2002; Morris and Hollenbeck, 1993; Welte et al., 1998). Net direction of the movement is regulated by second messengers such as cAMP or Ca2+ ions (reviewed in Reilein et al., 2001). Changes in the movement parameters that are induced by variations in the second-messenger levels are cell type-specific. Global regulation of the transport direction in some cells involves control over the runs of organelles only to MT plus or minus ends (Kamal and Goldstein, 2002; Karcher et al., 2002; Lane and Allan, 1998; Vale, 2003), whereas in others uninterrupted runs in both directions are affected (Rodionov et al., 2003). Information about the changes in the movement parameters in response to intracellular signals is therefore essential for the identification of MT motors subjected to regulation. The measurement of the movement parameters involves recording of living cells at a high temporal and spatial resolution, tracking of moving organelles, and decomposition of the resulting trajectories into periods of runs and pauses (Morris and Hollenbeck, 1993; Welte et al., 1998).
Decomposition of the movement trajectories has proved to be a difficult task because of the random fluctuations in the positions of organelles in the cytoplasm as well as self-similar scale-free structure of typical trajectories. Here we introduce an algorithm for automatic detection of runs and pauses within organelle trajectories. The algorithm is based on the multiscale trend analysis (MTA) that extracts “trends”—piecewise linear approximations of particle trajectories. The proposed algorithm is automatic and self-adapted to the characteristic durations and velocities of runs. We apply the algorithm to MT-dependent movement of pigment particles in melanophores and pigment cells of fish and amphibia, which provide a remarkable example of regulated MT-based transport (reviewed in Nascimento et al., 2003).
The major function of melanophores is fast and synchronous redistribution of thousands of membrane-bounded organelles, pigment granules, which serves the purpose of chromatic adaptation of the animal. The granules either aggregate at the cell center or redisperse uniformly throughout the cytoplasm. Aggregation involves movement of granules along MTs by means of minus-end-directed MT motor cytoplasmic dynein (Nilsson and Wallin, 1997). Dispersion combines transport of granules to the MT plus ends by a kinesin family motor (Rodionov et al., 1991; Tuma et al., 1998) and movement along actin filaments powered by a myosin (Rodionov et al., 1998; Rogers and Gelfand, 1998). Regulation of pigment transport involves changes in the levels of cAMP, which regulates the activity of MT and actin motors (reviewed in Nascimento et al., 2003).
Previous analysis of the movement of pigment granules in melanophores has shown that aggregation and dispersion stimuli do not induce significant changes in the movement velocities, but have a profound effect on the length of uninterrupted runs (Gross et al., 2002; Rodionov et al., 2003). In fish melanophores, dispersion signal shortens minus-end and increases plus-end run length, whereas aggregation signal induces the opposite changes (Rodionov et al., 2003). In contrast, in Xenopus melanophores only the length of minus-end runs appears to be regulated, leaving the length of plus-end runs constant throughout pigment aggregation and dispersion (Gross et al., 2002). These observations suggest important differences in the mechanisms of regulation of net pigment transport direction between the two pigment cell types. Here we use MTA to reinvestigate regulation of pigment transport in melanophores and directly compare the movement of pigment granules in the two pigment cell types. We find that despite the differences in the values of the pigment granule movement parameters, the general patterns of regulation of MT motors are similar in fish and Xenopus melanophores.
MATERIALS AND METHODS
Cell culture
Fish melanophores were cultured from the scales of black tetra (Gymnocorymbus ternetzi) onto carbon-coated glass coverslips as described previously (Rodionov et al., 1994). Briefly, scales were incubated in Ringer's solution supplemented with collagenase (1 mg/ml, Type II, Worthington Biochemical, Lakewood, NJ) and bovine serum albumin (5 mg/ml, Fraction V, Sigma Chemical, St. Louis, MO). Melanophores were removed from collagenase-treated scales by pipetting, washed 3–5 times with Ringer's solution, placed onto carbon-coated coverslips, and incubated overnight in fish tissue culture medium (Dulbecco's modified Eagle's medium supplemented with antibiotics and 20% fetal bovine serum) to allow spreading.
Permanent cell lines of Xenopus melanophores were obtained as described in (Daniolos et al., 1990) and cultured in Xenopus tissue culture medium (70% L15 medium supplemented with antibiotics, 20% fetal bovine serum, and 5 μg/ml insulin).
Pigment aggregation was induced with 5 × 10⁻⁷ M adrenalin (fish melanophores) or 10−8 M melatonin (frog melanophores). Pigment dispersion in fish melanophores was induced by washing out adrenalin via 5–6 changes of fish tissue culture medium. In some experiments, caffeine (5 mM) was introduced into the last washing solution to facilitate dispersion. To induce pigment dispersion in frog melanophores, cells were washed 3–5 times with Xenopus tissue culture medium to remove melatonin and treated with melanocyte stimulating hormone (10−8 M).
Real-time analysis of MT-based transport of pigment granules
The movement of pigment granules was recorded with a Nikon TE300 inverted microscope (Nikon, Tokyo, Japan) equipped with a 100× 1.25 NA Plan Achromat objective lens. Time series (15 s long) of phase contrast images were acquired at a video rate of 30 frames/s with a Watec-902B CCD video camera (Watec, Tokyo, Japan) via stream acquisition option of Metamorph image acquisition and analysis software (Universal Imaging, Downington, PA). To increase the spatial resolution of images, an additional projection lens (2×) was placed in front of the camera chip.
Pigment granules were tracked with the particle tracking module of Metamorph software. Tracking was performed at the edge of expanding or retracting pigment mass where individual granules could be observed. To avoid artifacts introduced by interaction of pigment granules with each other, only trajectories of granules that never collided with their neighbors were used for the analysis.
RESULTS
Cultured melanophores isolated from scales of a freshwater fish (black tetra) or from frog embryos (Xenopus) distribute pigment granules throughout the cytoplasm or accumulate them in the cell center in response to dispersion or aggregation stimuli (Fig. 1). These two experimental systems are commonly used for studies of intracellular transport and its regulation. However, it is unclear how similar are the mechanisms that regulate the relative activities of the molecular motors in fish versus frog.
FIGURE 1.
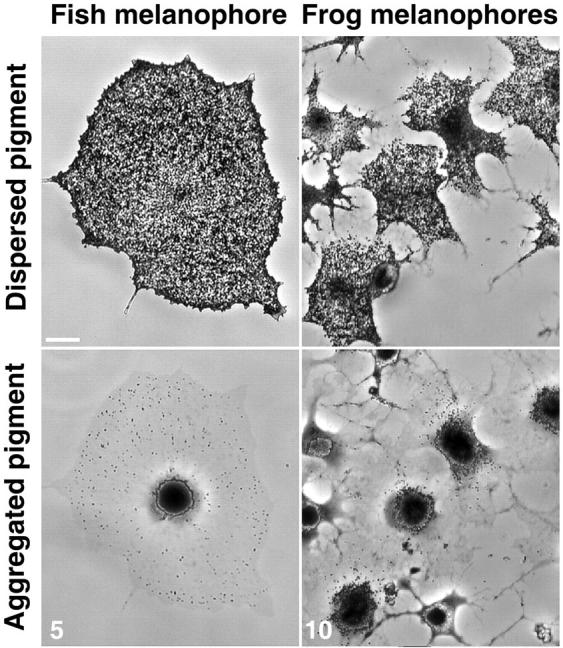
Phase-contrast images of melanophores with dispersed or aggregated pigment granules. Fish (black tetra, left images) and frog (Xenopus, right images) melanophores before (top) or after (bottom) stimulation of pigment aggregation. Aggregation was induced with adrenalin (5 × 10⁻⁷ M) in fish and with melatonin (10−8 M) in frog melanophores. Numbers indicate time in minutes after the stimulation. Bar, 25 μm.
To address this question and to find the parameters of the movement of pigment granules along MTs that change in response to applied signals for aggregation or dispersion, short (15-s) time sequences of images of pigment granules were acquired at increasing time intervals after stimulation. Granule trajectories as a function of time {x(t), y(t)} were then obtained by tracking individual pigment granules using Metamorph image analysis software. Projections P(t) of the granule trajectories onto the best-fitting lines were then calculated to approximate the displacement along the linear MTs (Welte et al., 1998). A novel algorithm, MTA, was then used to decompose the calculated linear displacements of pigment granules into runs and pauses and to analyze the mechanisms of the regulation of pigment transport in fish and frog melanophores.
Multiscale trend analysis
MTA is a general statistical method (Zaliapin et al., 2004) that involves construction of a sequence of embedded piecewise linear approximations of time series; it is shown to possess a series of well-defined statistical properties nicely connected to the self-affine structure of the time series. In this work, we apply MTA to intracellular transport of pigment granules of melanophores and develop a new method of pigment granule analysis. The method is based on constructing a hierarchy of piecewise linear approximations of the granule trajectories with progressively increasing accuracy; this hierarchy is then used for detection of pauses and runs.
Specifically, the zero level of the hierarchy is formed by the best least-square linear approximation L0(t) of P(t) over the entire observational interval; L0(t) consists of a single linear segment. We define the approximation error for L0(t) as
 |
(1) |
where the integration is taken over the entire observational interval. At the next step MTA evaluates the most prominent deviations of P(t) from its global linear fit L0(t) and depicts them by the first-level approximation, L1(t), which consists of N1 linear segments and has the approximation error E1 defined as in Eq. 1. Here we face two problems: the first is how to determine the optimal N1; the second is how to construct the optimal piecewise linear approximation with N1 segments. We discuss here only the theoretical approach to resolving these problems; the details of a corresponding computationally effective algorithm are given in Zaliapin et al. (2004).
Formally, to construct the approximation L1(t) we first introduce the quality measure for an arbitrary piecewise linear approximation L(t; N,E) consisting of N linear segments and having total fitting error E:
 |
(2) |
where E0 is the fitting error of the global linear approximation L0(t). Next, we seek such approximation L(t; N*,E*) that maximizes H(N,E):
 |
(3) |
In the plane (N, log(E/E0)) the global linear approximation L0(t) corresponds to the point p0 = (1,0), whereas an arbitrary piecewise approximation Li(t) corresponds to the point pi = (Ni, log(Ei/E0)), Ni ≥ 1, Ei ≤ E0. The slope of the linear segment [p0,pi] shows the increase of the fitting quality per one additional segment of approximation. By the criteria in Eqs. 2 and 3, we choose the approximation with the maximal quality increase. Finally, N1 linear segments of the approximation L1(t) comprise the first level of our hierarchy.
To construct the next approximation, L2(t), we apply the above procedure to one of N1 segments of the first-level approximation L1(t). The choice of this segment corresponds to the maximization of the corresponding error decrease (E1 − E2). The N2 segments of this approximation comprise the second level of the hierarchy. Similarly, at each consecutive step, we apply the above procedure to one of the segments of the current approximation Lk(t) to form the next approximation Lk+1(t). Each segment of the approximation Lk+1(t) is embedded into or coincides with a segment from Lk(t); this is why we call the system of our approximations embedded and this is why they form a well-defined hierarchy.
As a result, a series of piecewise linear approximations Lk(t)k = 0, 1, … of the original series P(t) is obtained. The approximations are of increasing detail and the larger the index k the larger the number Nk of linear segments within Lk(t), and the smaller their characteristic duration.
For the correct decomposition of granule trajectories it is critical to choose the appropriate level k0 of the approximation hierarchy. If the k0 is too small, there is a risk that individual runs will be combined, whereas too large k0 values will lead to the depiction of irrelevant low-amplitude oscillations in the granule positions. The problem of choosing right k0 can be solved using the MTA spectrum: a graph showing the fitting error Ek of approximation Lk(t) as a function of the number Nk of its linear segments. By definition, this function is monotonously decreasing. For purely self-affine time series characterized by a single Hurst exponent H, the error Ek and scale Nk are connected via (Zaliapin et al., 2004):
 |
(4) |
This power-law relationship reflects the absence of characteristic scale in agreement with the well-known general properties of self-affine time series (Mandelbrot, 1982). This equation suggests that the dependence of Ek on Nk should be considered in bilogarithmic scale, where the relation (Eq. 4) takes linear form:
 |
The value of H = 0.5 corresponds to a random walk with no persistence, such as Brownian walk with uncorrelated increments, whereas H > 0.5 corresponds to persistent displacement with positively correlated increments, and H < 0.5 to antipersistent displacement with negatively correlated increments. It is clear that the typical pigment granule trajectory is not a pure self-affine scale-free series. The existence of preferable velocities and durations of pigment granule runs create characteristic scale in the granule dynamics. As a result, the typical MTA spectrum for the observed trajectories is not linear but rather is characterized by the presence of a corner point k0, at which the spectrum slope breaks from a higher to a lower value. Such a break is typical for time series that describe a well-shaped motion accompanied by a random noise (see Zaliapin et al., 2004). Existence of a corner point signals that the dynamics of a trajectory change at this scale. Therefore, we choose the level at the spectrum corner point for further analysis and interpret the scales >k0 (larger segment durations) as corresponding to the motor runs, and the scales <k0 as random noise within the system. The corner point is formally defined as the point of maximal deviation from the best linear approximation to the spectrum.
The above procedure was applied to the 988 trajectories of frog granules and 666 trajectories of fish granules, producing, respectively, 12,381 and 9272 individual runs.
An example of pigment granule spectrum is given in the Fig. 2 A inset. It is clear that the spectrum breaks into two almost linear segments at the level k0 = 6. Fig. 2 shows the granule trajectory on the background of the MTA decomposition at this level. The piecewise linear approximation at corner level k0 = 6 accurately reflects prominent segments of distinct velocities within the analyzed trajectory. We therefore used this decomposition level for the analysis of pigment granule movement along MTs. Other trajectories have different corner levels; nevertheless, the corner level is present in every analyzed trajectory and can be easily and reliably detected. In fact, the very existence of runs, i.e., movements of a granule at a preferred speed for significant time, does ensure the existence of a spectrum corner point, since such runs facilitate the efficiency of piecewise linear approximation at scales >k0.
FIGURE 2.

Detection of runs of pigment granules using multiscale trend analysis. The plot shows an example of MTA decomposition at corner point (level 6) of a trajectory of a pigment granule recorded during pigment aggregation. Plus-end runs are color-coded in blue, minus-end runs in red, and pauses in green. Insert shows the MTA spectrum (the least-square fitting error E as a function of the number N of segments of a piecewise linear approximation in bilogarithmic scale), which demonstrates the existence of a corner point at level k = 6. A larger slope of the spectrum to the left of the corner point reflects the existence of a well-pronounced shape of the trajectory at larger timescales (larger segment durations), whereas the lower slope to the right of the corner point reflects noisy random fluctuations at smaller scales. We interpret the large-scale structure as pigment runs, and the small-scale structure as a system noise.
Once the decomposition level k0 is determined, each trajectory P(t) can be broken into a sequence of linear segments with positive or negative slopes of different values. The next step of analysis involves the classification of these linear segments into uninterrupted runs and pauses. The most straightforward way for this classification involves the assignment of a threshold value for the slopes to distinguish between the two states, but this approach leaves room for error in the definition of pauses and runs. Fortunately, the histogram of segment velocities provides a clue about the velocity value that should be used as a threshold. Fig. 3 shows the data for ∼12,000 segments for 988 individual trajectories (356 for aggregation, 632 for dispersion). It is clear that the velocity distribution is strikingly bimodal, with peaks at 50 nm/s and 390 nm/s. The same bimodal distribution was observed when the data for aggregation and dispersion was examined separately. We conclude that the low- and the high-velocity peaks on the histogram correspond, respectively, to pauses and runs and therefore the value V0 = 100 should be used as a velocity threshold. It is helpful to consider run velocities in logarithmic scale because it makes the two peaks of the velocity distribution approximately normal (so-called log-normal distribution).
FIGURE 3.

Distribution of segment velocities of pigment granules obtained by MTA decomposition. The bimodal distribution suggests that the left peak, with average V ∼ 50 nm/s, corresponds to pauses and the right peak, with average V ∼ 390nm/s, to runs. Runs and pauses are separated by velocity threshold V = 100 nm/s. Note that the velocity is shown in logarithmic scale, which visually separates the velocities of the pauses from zero.
The natural separation between pauses and runs is evident from Fig. 3. Note, however, that the histogram mixes runs from different experimental time points. This, along with possible individual features of trajectories, suggests that the threshold value implied by Fig. 3 may be further improved if we take into account individual features of the trajectories. Thus, to make the threshold value selection more reliable, we have determined the velocity threshold individually for each trajectory. Specifically, we seek the velocity threshold V0 that maximizes the following oversimplified separation measure:
 |
(5) |
Here, M< (M>) and D< (D>) are mean ± SD of logarithms of absolute velocities such that V < u (V > u). The analysis was done in logarithmic scale due to the approximate log normality of the velocity distribution (see Fig. 3). After the velocity threshold is established, the consecutive minus-end runs, plus-end runs, and pauses were merged to obtain the final division. It is clear from Fig. 2 that the breaks indeed correspond to major changes in the velocities of the granules.
Amazingly, the results of both “individual” and “group” threshold selections led to similar numerical values, illustrating the objective existence of different movement regimes as well as stability of threshold-selection procedure.
Fig. 4 A shows two-dimensional scatter plots of run durations versus displacements based on the data obtained for 220 individual runs of aggregating pigment granules in Xenopus melanophores using the above procedure. Diagonal lines on the plot indicate constant velocities of runs. It is clear that a threshold velocity of ∼100 nm/s separates the two nonoverlapping velocity clusters, a fast component (upper cluster on the plot) that likely corresponds to the active motor-based transport and a slow component (lower cluster) that does not result in significant granule displacement and in this analysis was designated as pauses. The separation of runs and pauses based on the analysis of individual trajectories (Fig. 4) is in a good agreement with statistical data shown in Fig. 3, which confirms that the velocity threshold V0 = 100.
FIGURE 4.
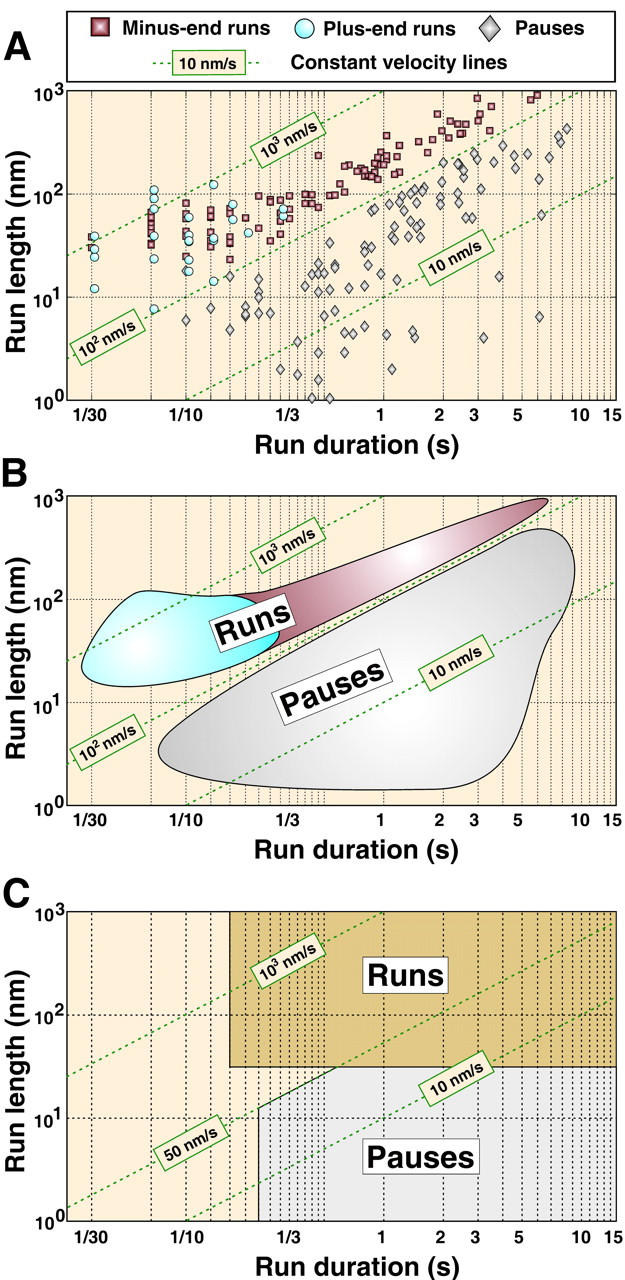
Length-duration diagram. (A) Length of individual runs (in nanometers) determined for several aggregation trajectories as a function of their duration (in seconds) in bilogarithmic scale. Each point corresponds to an individual plus-end (blue circle) or minus-end run (red square), or a pause (gray diamond). Most of the minus-end runs are longer than plus-end runs as would be expected for aggregation. Green dashed lines correspond to constant velocity lines. Velocity threshold V = 100 nm/s reliably separates runs (V > 100 nm/s) from pauses (V < 100 nm/s). (B) Schematic representation of run/pause domains detected by MTA for the aggregation process. The gray area corresponds to pauses, the red area to minus-end runs, and the blue area to plus-end runs. Long minus-end runs (red area) are seen only in cells that were stimulated to aggregate pigment granules and therefore reflect pigment transport regulation. (C) Run/pause domains corresponding to the fixed threshold method of Welte et al. (1998). In this method, the run domain covers a broad range of velocities, from 1 nm/s to >1000 nm/s.
MTA analysis and comparison of MT transport in fish and Xenopus melanophores
To compare pigment transport in fish and frog melanophores, we applied MTA to analyze the statistics of the movement of pigment granules during pigment aggregation and dispersion in these two systems.
Net pigment transport rates are significantly different in fish and Xenopus melanophores as evidenced from time sequences of phase contrast images of cells. Pigment aggregation and dispersion occur ∼2-fold faster in fish than in Xenopus pigment cells (∼5 and 10 min for aggregation and dispersion in fish melanophores compared to 10–15 and 20–30 min for frog cells; Fig. 1). Given the smaller size of Xenopus melanophores (Fig. 1), this means that it takes more time for pigment granules to cover shorter distances during aggregation and dispersion.
These differences in the net pigment transport rates can be caused by the lower velocities of the movement of pigment granules during uninterrupted runs or by more frequent pauses in Xenopus melanophores. Regulation of only one component of MT transport, as suggested for minus-end runs in frog melanophores (Gross et al., 2002), instead of simultaneous reciprocal regulation of both plus- and minus-end runs, as seen in fish cells (Rodionov et al., 2003), can also explain lower net transport rates. To find out which parameters of the granule movement are responsible for the observed differences, we tracked individual pigment granules in fish or frog melanophores at increasing time intervals after stimulation of pigment aggregation or dispersion and used MTA to decompose granule trajectories into periods of uninterrupted runs and pauses.
We found that the rates of uninterrupted runs averaged throughout dispersion or aggregation were slightly lower in frog than in fish melanopohores (Fig. 5 A). Average rates for frog were: plus-end runs, 458.4 ± 5.7 nm/s (n = 5479); minus-end runs, 552.8 ± 19.8 nm/s (n = 1006). Average rates for fish were: plus-end runs, 662.2 ± 8.4 nm/s (n = 4089); minus-end runs, 636.9 ± 23.5 nm/s (n = 2335). The difference in plus-end rates is consistent with the suggestion that plus-end pigment granule transport in fish and Xenopus melanophores is driven by different members of the kinesin family, kinesin 1 in fish (suggested in Rodionov et al., 1991) and kinesin 2 in frog (shown in Tuma et al., 1998). The difference in minus-end rates could be explained by the possible differences in the properties of the dynein motor molecules in the two experimental systems. However, such a difference in rates (20% overall) cannot fully explain the observed differences in net pigment displacement rates in the two experimental systems.
FIGURE 5.

Parameters of MT transport of pigment granules determined with MTA in fish and Xenopus melanophores during pigment aggregation and dispersion. (A) Mean velocity of minus-end runs (left pair of bars on each panel) or plus-end runs (right pair of bars on each panel) during pigment aggregation (open bars) or dispersion (solid bars) in fish (left panel) and frog (right panel) melanophores. Mean velocities of uninterrupted runs are comparable in fish and frog melanophores and are similar in aggregating and dispersing cells. (B) Mean duration of minus-end runs (left pair of bars on each panel), plus-end runs (middle pair of bars) and pauses (right pair of bars) during pigment aggregation (open bars) or dispersion (solid bars) in fish (left panel) or frog (right panel) melanophores. In both pigment cell types during pigment aggregation, minus-end runs are much longer and plus-end runs much shorter than during dispersion. Mean durations of uninterrupted runs are longer, and pauses shorter, in fish than in Xenopus melanophores.
Further analysis showed that a much more prominent difference between the two pigment cell types lay in the mean durations of uninterrupted runs and pauses (Fig. 5 B). The displacements of pigment granules whose direction matched the direction of the global pigment movement were on average twice as long, and the duration of pauses significantly shorter, in fish compared to frog melanophores (Fig. 5 B). We therefore conclude that faster pigment transport in fish melanophores is explained primarily by the longer periods of movement of pigment granules and shorter durations of pauses.
The differences in pause durations became particularly clear when we compared the kinetics of changes of the fraction of time that pigment granules spent in uninterrupted runs and pauses during pigment aggregation and dispersion. In fish melanophores, the fraction of time that granules spent in pauses was only 20% during aggregation and ∼40% during dispersion (Fig. 6 A). In contrast, in frog melanophores pigment granules were stationary most (60–80%) of the time (Fig. 6 B). Therefore, long pauses appear to be the major reason for the slow transport rate in Xenopus melanophores.
FIGURE 6.

Kinetics of changes in the fractions of time that pigment granules spend in uninterrupted runs or pauses during pigment aggregation or dispersion. The data for fish melanophores are shown in the top panel and for frog melanophores on the bottom panel. For each time point after the stimulation of aggregation (white area on each panel; time of aggregation increases from right to left) or dispersion (shaded area on each panel; time of dispersion increases from left to right) the fraction of time spent in minus-end runs, plus-end runs, and pauses are shown as open circles, black squares, and shaded triangles, respectively. In fish melanophores during pigment aggregation and dispersion, pigment granules spend most of the time in motion, whereas in frog melanophores pigment granules are generally stationary.
Despite these significant differences in transport rates the patterns of changes in the granule movement statistics induced by aggregation or dispersion signals were strikingly similar between the two pigment cell types. The average rates of uninterrupted runs were comparable in aggregating and dispersing cells (Fig. 5 A), but the mean duration of runs changed substantially in response to the stimulation (Fig. 5 B). Aggregation signal induced an increase in the average duration of the minus-end runs and concurrent decrease in the duration of plus-end runs both in fish and in frog melanophores, whereas dispersion signal caused opposite changes.
In fish melanophores, the length of plus-end MT runs displays distinct kinetics during pigment dispersion, which plays an important role in the switching between the MT and actin transport systems (Rodionov et al., 2003). A rapid increase of plus-end MT run length at early stages is followed by its slow decrease as the granules approach the cell margin. To find out whether similar fine tuning of plus-end run length occurs in Xenopus melanophores, we calculated the length of plus end runs at increasing time intervals after the stimulation of pigment dispersion. We found that the overall kinetics of changes in the length of plus-end runs was strikingly similar in fish and frog cells (Fig. 7, A and B). A rapid twofold increase in the plus-end run length in frog pigment cells was followed by a slow decrease to a low basal level (Fig. 7 B). We therefore conclude that the mechanisms of regulation of pigment transport are conserved among the pigment cell types.
FIGURE 7.
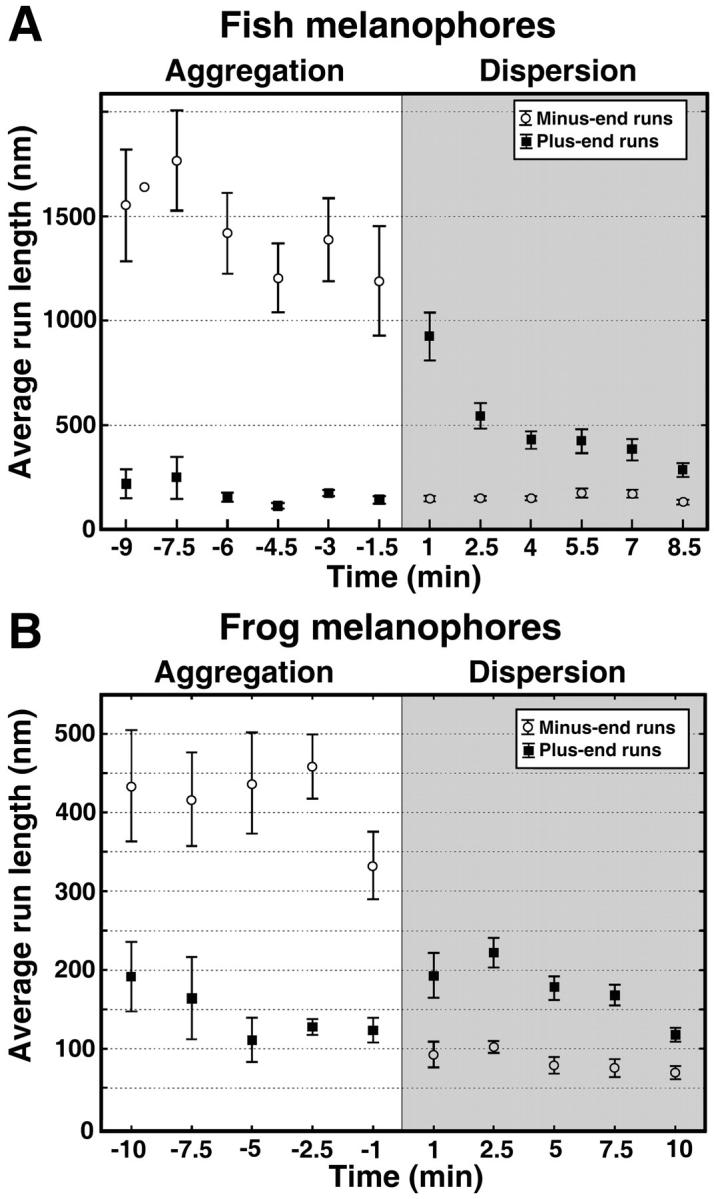
Kinetics of changes in the average length of uninterrupted runs. The data for fish and frog melanophores are shown in the top and bottom panels, respectively. The average length of minus-end (○) and plus-end (▪) runs is shown for each time point after the stimulation of aggregation (white area on each panel; aggregation time increases from right to left) or dispersion (shaded area on each panel; dispersion time increases from left to right). In both pigment cell types, stimulation of pigment aggregation leads to significant increase in the length of minus-end runs, which is maintained at a high steady-state level, whereas stimulation of dispersion decreases the length of minus-end runs and induces a transient increase in the length of plus-end runs.
DISCUSSION
Multiscale trend analysis
In this article, we describe a novel method, MTA, for the decomposition of the trajectories of particles moving along MTs into periods of uninterrupted runs and pauses. The most significant property of MTA is that this algorithm has no adjustable numerical parameters and that it is able to automatically construct optimal decomposition of the movement trajectories. Parameters of the granule movement determined by MTA for the complete separation of pauses and runs are similar to those used in a previous study of pigment transport that utilized different criteria for breaking down pigment granule trajectories (Gross et al., 2002). This indicates that MTA is indeed able to extract the movement parameters characteristic of the MT motors.
Remarkably, MTA decomposition detects the characteristic timescale created by pigment granule runs, which is uniquely determined by the corner level k0. Simplistically, the timescale can be defined as an average duration of the runs detected at the corner level. It should be stressed, however, that the durations of runs vary significantly within a given decomposition level and it is sometimes more efficient to describe them by a probabilistic distribution rather than a mere average, or to trace their time variability considering the original decomposition. The qualitative meaning of the term “timescale” should depend on a particular problem at hand. It is important that our analysis is capable of detecting important global scaling characteristics of the process under study. Analysis and comparison of such characteristics might be illuminating for deeper understanding of the intracellular processes.
The ability for self-adaptation to characteristic durations and velocities of runs sets MTA apart from other algorithms such as a threshold-based algorithm for the analysis of the movement trajectories. The advantages of MTA are clearly seen when we compare the results of decomposition of pigment granule trajectories obtained with the two algorithms (Fig. 4). Semilogarithmic plots of the lengths of uninterrupted runs as a function of run durations show that although the majority of the runs are identified by both methods (Fig. 4, B and C), the previously published analysis (Gross et al., 2002; Welte et al., 1998) (Fig. 4 C) has two drawbacks. First, it fails to recognize runs that have short (<1/10 s) duration; second, for slow-moving granules this analysis tends to confuse slow (<100 nm/s) runs and pauses. This leads to an overlap of values for the velocities of runs and pauses. In contrast, MTA uses a velocity-based approach that allows much better separation of runs and pauses (Fig. 4 B). Another advantage of MTA is that this method does not rely on information about the experimental system, whereas the previously published algorithm uses definition of runs and pauses that requires experimentally obtained numerical parameters measured in preliminary experiments and thus varies from system to system. We therefore believe that MTA is an advanced algorithm that can be widely used for the analysis of bidirectional transport of various organelles along MTs.
Comparison of MT transport in fish and Xenopus melanophores
The movement statistics extracted with MTA explain slower rates of net pigment transport in frog melanophores compared to fish pigment cells. The major cause of low net transport rates appears to be the very long time that pigment granules spend in pauses. Further, even when pigment granules in Xenopus melanophores move, the rate of their movements is on average 20% lower, and that of their runs ∼50% shorter, than in fish pigment cells. Therefore, differences in the durations of pauses and the rates and lengths of uninterrupted runs make transport far less efficient in Xenopus melanophores than in fish pigment cells.
Despite these significant differences in the values of the movement parameters and net pigment transport rates we find that general patterns of regulation of MT-based transport are similar in the two pigment cell types. The movement of pigment granules to the cell center during aggregation is driven by a rapid and dramatic increase in the length of minus-end runs, which is maintained at a high level throughout the pigment aggregation. Pigment dispersion is induced by a decrease in the length of minus-end runs and concurrent increase in the length of plus-end runs. However, this increase is temporal and the length of plus-end runs returns to a low basal level with time during dispersion. Our previous work has shown that in fish melanophores the kinetics of changes of plus-end runs determines the sequence in which the two major transport systems act during dispersion (Rodionov et al., 2003). Long runs at early stages determine predomination of MT transport, but as the run length drops the granules switch onto actin filaments. Our finding that kinetics of changes in plus-end run length is similar in Xenopus melanophores and fish pigment cells suggests conservation of the mechanisms responsible for the switching of pigment granules between the two major transport systems among pigment cells from different organisms.
The conclusion about the similarity of the mechanisms of MT transport regulation apparently contradicts the results of published studies that imply significant differences in regulation of MT transport direction in fish and Xenopus melanophores. First, the granule tracking analysis performed in Gross et al. (2002) indicated that in Xenopus melanophores only the length of minus-end runs is regulated by signaling events. Second, the balance of plus- and minus-end MT transport components seem to be different in fish and Xenopus melanophores, as evidenced from the experiments that involve complete depolymerization of actin cytoskeleton with latrunculin (Rodionov et al., 1998; Rogers and Gelfand, 1998). In fish melanophores latrunculin treatment induces redistribution of pigment granules to the cell rim as would be predicted from the prevalence of the plus-end-directed component of MT transport (Rodionov et al., 1998). Surprisingly, in frog melanophores actin depolymerization leads to accumulation of pigment granules in the cell center (Rogers and Gelfand, 1998).
To explain our results and the data obtained by others, we propose a hypothesis for the regulation of pigment transport in melanophores (Fig. 8). We suggest that regulation of plus-end runs was overlooked in the study of Gross et al. (2002), who compared the MT transport statistics at late stages of aggregation and dispersion, when plus-end runs returned to a low basal level, and that in both fish and frog cells regulation involves a transient increase in plus-end run length. We hypothesize, however, that implications of the suppression of the plus-end-directed component of MT transport at later stages of dispersion are different in the two pigment cell types. In fish melanophores, MT transport remains directed to the periphery even when dispersion is complete, whereas in frog melanophores, a drop in the plus-end run length leads to the reversal of net MT transport direction. Thus, actomyosin transport in fish melanophores prevents pigment granules from redistribution to the cell margin, whereas in frog melanophores it prevents granules from accumulation at the cell center. Future experiments will test this hypothesis and elucidate molecular mechanisms that are responsible for the regulation of MT motors in melanophores.
FIGURE 8.

Hypothesis about the regulation of net direction of MT transport in fish and frog melanophores during pigment dispersion. The plots show net displacement of pigment with time in fish (solid line) and frog (dashed line) melanophores. In both pigment cell types, dispersion signals stimulate the initial movement of pigment granules to the cell periphery because of an initial increase in the length of plus-end runs. As the plus-end run length gradually drops in fish melanophores, net pigment transport remains directed to the cell periphery. In contrast, in frog melanophores, plus-end transport decreases to a low level that results in reversal of net MT transport direction.
Acknowledgments
We thank Dr. Boris Slepchenko for critical reading of the manuscript. We are grateful to the editors of the Biophysical Journal and our anonymous reviewers for their helpful and inspiring comments.
This work was supported by National Institutes of Health grants GM-62290 and NCRR RR13186 to V.I.R.
References
- Daniolos, A., A. B. Lerner, and M. R. Lerner. 1990. Action of light on frog pigment cells in culture. Pigment Cell Res. 3:38–43. [DOI] [PubMed] [Google Scholar]
- Gross, S. P., M. C. Tuma, S. W. Deacon, A. S. Serpinskaya, A. R. Reilein, and V. I. Gelfand. 2002. Interactions and regulation of molecular motors in Xenopus melanophores. J. Cell Biol. 156:855–865. [DOI] [PMC free article] [PubMed] [Google Scholar]
- Kamal, A., and L. S. Goldstein. 2002. Principles of cargo attachment to cytoplasmic motor proteins. Curr. Opin. Cell Biol. 14:63–68. [DOI] [PubMed] [Google Scholar]
- Karcher, R. L., S. W. Deacon, and V. I. Gelfand. 2002. Motor-cargo interactions: the key to transport specificity. Trends Cell Biol. 12:21–27. [DOI] [PubMed] [Google Scholar]
- Lane, J., and V. Allan. 1998. Microtubule-based membrane movement. Biochim. Biophys. Acta. 1376:27–55. [DOI] [PubMed] [Google Scholar]
- Mandelbrot, B. 1982. The Fractal Geometry of Nature. W. H. Freeman, New York.
- Morris, R. L., and P. J. Hollenbeck. 1993. The regulation of bidirectional mitochondrial transport is coordinated with axonal outgrowth. J. Cell Sci. 104:917–927. [DOI] [PubMed] [Google Scholar]
- Nascimento, A. A., J. T. Roland, and V. I. Gelfand. 2003. Pigment cells: a model for the study of organelle transport. Annu. Rev. Cell Dev. Biol. 19:469–491. [DOI] [PubMed] [Google Scholar]
- Nilsson, H., and M. Wallin. 1997. Evidence for several roles of dynein in pigment transport in melanophores. Cell Motil. Cytoskeleton. 38:397–409. [DOI] [PubMed] [Google Scholar]
- Reilein, A. R., S. L. Rogers, M. C. Tuma, and V. I. Gelfand. 2001. Regulation of molecular motor proteins. Int. Rev. Cytol. 204:179–238. [DOI] [PubMed] [Google Scholar]
- Rodionov, V. I., F. K. Gyoeva, and V. I. Gelfand. 1991. Kinesin is responsible for centrifugal movement of pigment granules in melanophores. Proc. Natl. Acad. Sci. USA. 88:4956–4960. [DOI] [PMC free article] [PubMed] [Google Scholar]
- Rodionov, V. I., A. J. Hope, T. M. Svitkina, and G. G. Borisy. 1998. Functional coordination of microtubule-based and actin-based motility in melanophores. Curr. Biol. 8:165–168. [DOI] [PubMed] [Google Scholar]
- Rodionov, V. I., S. S. Lim, V. I. Gelfand, and G. G. Borisy. 1994. Microtubule dynamics in fish melanophores. J. Cell Biol. 126:1455–1464. [DOI] [PMC free article] [PubMed] [Google Scholar]
- Rodionov, V., J. Yi, A. Kashina, A. Oladipo, and S. P. Gross. 2003. Switching between microtubule- and actin-based transport systems in melanophores is controlled by cAMP levels. Curr. Biol. 13:1837–1847. [DOI] [PubMed] [Google Scholar]
- Rogers, S. L., and V. I. Gelfand. 1998. Myosin cooperates with microtubule motors during organelle transport in melanophores. Curr. Biol. 8:161–164. [DOI] [PubMed] [Google Scholar]
- Tuma, M. C., A. Zill, N. Le Bot, I. Vernos, and V. Gelfand. 1998. Heterotrimeric kinesin II is the microtubule motor protein responsible for pigment dispersion in Xenopus melanophores. J. Cell Biol. 143:1547–1558. [DOI] [PMC free article] [PubMed] [Google Scholar]
- Vale, R. D. 2003. The molecular motor toolbox for intracellular transport. Cell. 112:467–480. [DOI] [PubMed] [Google Scholar]
- Welte, M. A., S. P. Gross, M. Postner, S. M. Block, and E. F. Wieschaus. 1998. Developmental regulation of vesicle transport in Drosophila embryos: forces and kinetics. Cell. 92:547–557. [DOI] [PubMed] [Google Scholar]
- Zaliapin, I., A. Gabrielov, and V. Keilis-Borok. 2004. Multiscale trend analysis. Fractals. 12:275–292. [Google Scholar]