Abstract
The persistence length of titin from rabbit skeletal muscles was measured using a combination of static and dynamic light scattering, and neutron small angle scattering. Values of persistence length in the range 9–16 nm were found for titin-II, which corresponds to mainly physiologically inelastic A-band part of the protein, and for a proteolytic fragment with 100-nm contour length from the physiologically elastic I-band part. The ratio of the hydrodynamic radius to the static radius of gyration indicates that the proteins obey Gaussian statistics typical of a flexible polymer in a θ-solvent. Furthermore, measurements of the flexibility as a function of temperature demonstrate that titin-II and the I-band titin fragment experience a similar denaturation process; unfolding begins at 318 K and proceeds in two stages: an initial gradual 50% change in persistence length is followed by a sharp unwinding transition at 338 K. Complementary microrheology (video particle tracking) measurements indicate that the viscoelasticity in dilute solution behaves according to the Flory/Fox model, providing a value of the radius of gyration for titin-II (63 ± 1 nm) in agreement with static light scattering and small angle neutron scattering results.
INTRODUCTION
Titin is a giant single-chain muscle protein (Mw ∼ 3.0–3.5 MDa) and is one of the major constituents of the striated muscles of vertebrates (Bray, 1992; Wang et al., 2001). The protein is involved in a number of important regulatory mechanisms of muscle related to its development, structural organization, elasticity, and intracellular signaling (Tskhovrebova and Trinick, 2003; Granzier and Labeit, 2004). Titin's role in muscle elasticity is a major issue in current studies of the molecular mechanisms involved in muscle function.
A titin molecule is >1-μm long and spans half of the sarcomere, the repeating structural and contractile unit of muscle (Fig. 1). More than half of the molecule is an integral part of different sarcomere elements, i.e., of the thick filament and the Z- and M-line regions. The rest of the molecule is not bound to the other sarcomere proteins, but functions as an elastic connection between the thick filaments and the Z-line region. When the sarcomere contracts or elongates this part of titin coils up or extends in proportion. As a result, mechanical properties of the molecule are directly related to the elastic properties of the sarcomere. A full picture of the viscoelasticity of titin, therefore, is of vital importance in modeling the dissipative processes involved in the functioning of striated muscles.
FIGURE 1.
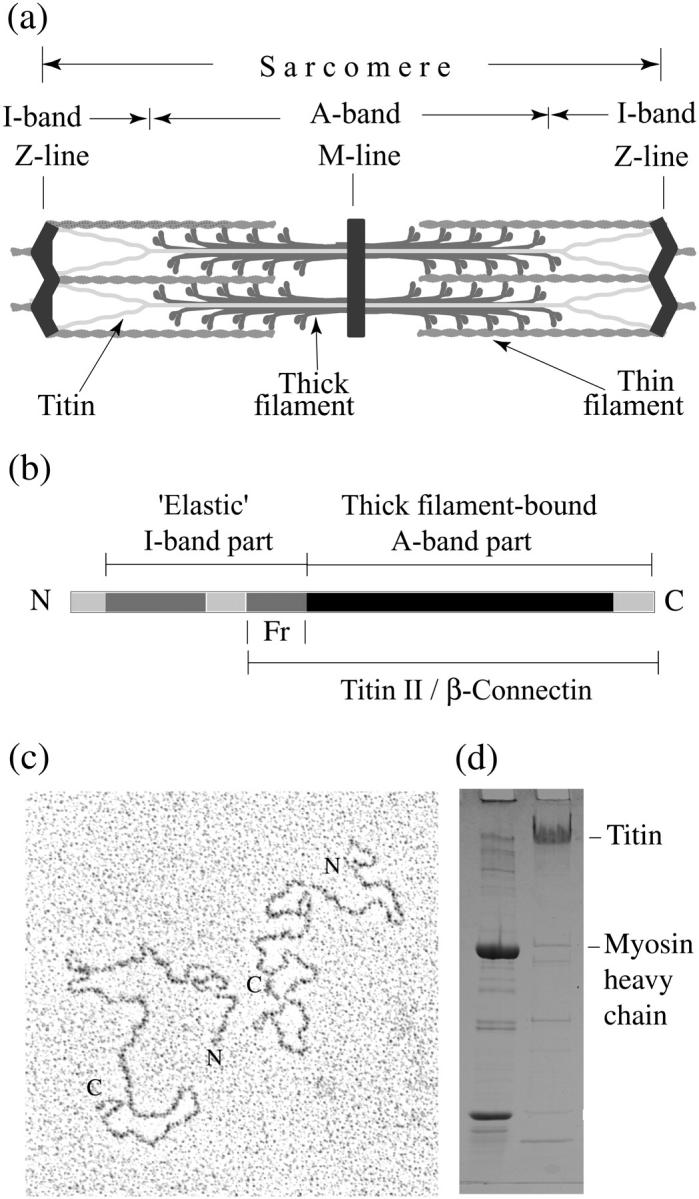
(a) Schematic arrangement of titin within the sarcomere, (b) diagram of titin structure, (c) electron micrograph of purified titin molecules, and (d) SDS-PAGE of titin preparation. (a) Single titin molecules span half of the sarcomere, with the N-terminus in the Z-line and C-terminus in the M-line. The A-band part of titin is bound to the thick/myosin filament and the I-band part forms an elastic connection between the tip of the thick filament and the Z-line. (b) The A-band part of titin (shown in black) contains both Ig and Fn3 domains; the elastic I-band part is formed by two segments of Ig domains arranged in tandems (medium gray) that are separated by unique sequences (light gray). The position of the proteolytical fragment that was isolated from the “elastic” part of titin is marked (Fr). (c) The contour length of the purified molecules is ∼1 μm. The C-terminals have characteristic small “heads”. (d) Left column shows sarcomere proteins as molecular weight markers. The titin preparation (right column) contains >90% of titin, most of which is in titin-II or β-connectin form.
Studies of the titin gene indicate that the majority of the polypeptide (>90%) is folded into a linear array of up to 300 immunoglobulin- and fibronectin-3-like domains, whereas the mechanically active part consists mainly of tandem Ig domains (Labeit and Kolmerer, 1995). The interdomain linker sequences are estimated to contain between two and five peptide residues along most of the length of titin. Flexibility of the linker regions may provide some interdomain mobility resulting in global flexibility of this multimodular protein.
The flexibility and extensibility of titin, its individual segments, and expressed small fragments have been studied previously using a series of techniques: dynamic light scattering (Higuchi et al., 1993), atomic force microscopy (AFM) (Rief et al., 1997), optical tweezers (Kellemayer et al., 1997; Tskhovrebova et al., 1997), and transmission electron microscopy (Tskhovrebova and Trinick, 2001). The estimates of the persistence length obtained, which is a quantitative measure of bending stiffness, vary for the native protein by almost a factor of 10, ranging from 42 nm from in situ mechanical measurements for the physiologically elastic region (Linke et al., 1998), to 3 nm, from single-molecule experiments as an average estimate over the majority of titin's length (Leake et al., 2004). The exact reasons for such a discrepancy remain unclear. It is likely, however, that they reflect both the structural and mechanical differences in the titin segments studied, and the shortcomings of different methodical approaches. Structural modeling does predict that interdomain mobility will differ to some extent in different regions of the molecule (Amodeo et al., 2001; Fraternali and Pastore, 1999). Immunoelectron microscopy also suggests that non-Ig/Fn3 regions of titin are significantly more compliant than the regions composed from Ig and Fn3 domains (Granzier et al., 1996), and thus the relative presence of these regions in a particular segment of the molecule will affect the average estimate. Additional complications are related to the extent the behavior of the molecule is compatible with models for its conformation, subsequently used for fitting experimental curves. In particular, there are a number of questions related to the effects of torsional modes (Yoshizaki and Yamakawa, 1980) and polyelectrolyte ionic strength effects (Odijk and Houwaart, 1978), which could play a role in determining the elasticity of this biopolymer and are not considered in current simplified approaches.
In this work we have applied scattering techniques, static and dynamic light scattering (Berne and Pecora, 2000; Hohenadl et al., 1999) and small angle neutron scattering (King, 1999), as well as video particle tracking microrheology (Goodman et al., 2002; MacKintosh and Schmidt, 1999) for the comparative study of purified titin-II corresponding to the mainly physiologically inelastic A-band part of the molecule, bound in situ to thick/myosin filament, and a proteolytically isolated fragment from the physiologically elastic I-band part of titin. In comparison to electron microscopy and mechanical experiments on single molecules, these techniques have the advantage that they minimally affect the equilibrium conformation of the protein and give ensemble averages over a whole series of molecules, thus producing accurate representative measurements. The techniques provide direct information regarding the size, viscosity, and diffusion coefficient of the protein and estimates of the persistence length. In comparison with light scattering, small angle neutron scattering is significantly more sensitive to small length scales, allowing access to the direct signature of the chains' flexibility (Higgins and Benoit, 1994) and providing better discrimination between possible models of the chains' conformations.
EXPERIMENTAL
Sample preparation
Titin was prepared as described before (Trinick et al., 1984). SDS-PAGE shows that the size of the purified protein in these preparations is smaller than the size of intact protein present in muscles. This is due to the loss of an N-terminal segment containing the Z-line and part of the I-band regions, due to the action endogenous proteinases during the purification. This preparation is therefore usually referred to as titin-II. The β-connectin preparation used in previous light scattering studies is similar (Higuchi et al., 1993). The titin-II includes the full length A-band part together with the C-terminal portion of the I-band part of the native molecule. The samples were kept in glycerol at −20°C and subsequently dialyzed for 24 h against selected buffers. The buffer recipes for titin-II in solution were: 1), buffer A (pH ∼ 7.4–7.5, Debye screening length  ) contained 0.5 M KCl, 10 mM TRIS, 1.0 mM DTT, 2.0 mM EGTA, 1.0 mM NaN3; and 2), buffer B (pH ∼ 7.4,
  ) contained 0.5 M NaCl, 20 mM TRIS, 0.3 mM DTT, and 1.0 mM EGTA.
A proteolytic fragment from the physiologically elastic part of titin (referred to further in the text as the “I-band titin fragment”) was prepared as described by Houmeida et al. (2003). From transmission electron microscopy measurements, the fragment length was 100 ± 20 nm. The fragment included the tandem Ig segment of the molecule starting at the Ig domain I20 (according to the annotation given by Labeit and Kolmerer, 1995) from the I-band region near the end of the thick filament (Fig. 1).
Measurements were performed at room temperature, except in dynamic light scattering experiments where the temperature dependence was studied.
Static/dynamic light scattering
An ALV-5000 goniometer was used for both static and dynamic light scattering experiments with a fast correlator (from 12.5 ns to 1000 s) and an argon ion laser (488 nm, 100 mW). The intensity of the scattered light was calibrated with respect to a toluene standard. The temperature control was accurate to ±0.1°C, and was provided by water circulating around the toluene bath and cuvette.
The dynamic light scattering/static light scattering (DLS/SLS) measurements were performed in the range of angles between 30 and 120° with an angular step of 10°. The collection time for each angle was 10–15 min, depending on the signal/noise ratio.
Titin-II at a concentration of 1.41 mg/mL in buffer B was centrifuged at 40,000 g at a temperature of 288 K for 2 h to remove dust contaminants and aggregates, as reported previously (Higuchi et al., 1993). After centrifugation, the solution was carefully transferred into the scattering cell. The elastic fragment at a concentration of 1.60 mg/mL in buffer B was filtered with polyethersulfone membranes (low binding protein filters) with 0.8-μm pore size to minimize the presence of aggregated protein.
Analysis of static light scattering data
The radius of gyration of titin-II was calculated from fits of the Debye function (P(x)) (Berne and Pecora, 2000) for the flexible polymers to the measured intensity versus scattering vector curves:
 |
(1a) |
 |
(1b) |
where q is the scattering vector defined as  ϑ is the scattered angle, n is the index of refraction of the solvent and λ is the wavelength. L indicates the contour length of the protein, lp is the persistence length, and Rg is the radius of gyration.
Analysis of dynamic light scattering data
In the dynamic light scattering experiments the normalized time autocorrelation function g2(q,t) of the scattered intensity (I(q,t)) is measured:
 |
(2) |
The latter can be expressed in terms of the field autocorrelation function g1(q,t) (i.e., the time autocorrelation function of the scattered electric field) through the Siegert relationship (Berne and Pecora, 2000)
 |
(3) |
where β is the coherent factor, which is ∼0.51 for the equipment employed.
Standard Contin analysis of the correlation curves showed a single relaxation time in the decay rate distribution versus time. Therefore, diffusion coefficients (D) were calculated from the field correlation functions g1(q,t) fitted with a single exponential decay.
 |
(4) |
where Γ is the relaxation rate and t is time.
Small angle neutron scattering
The experiments were carried out on two different large-scale facilities, KWS1 (FRJ2) (www.neutronscattering.de.) and D11 (ILL) (www.ill.fr/lss/grasp/grasp_main.html), at the Forschungszentrum Jülich (KWS1) and the Institute Laué Langevin (Lindner et al., 1992), respectively.
KWS1 (FRJ2)
A combination of three camera lengths (2, 8, and 20 m) was used, providing a momentum transfer q between 10−3 Å−1 and 0.2 Å−1. The raw two-dimensional data were corrected for the empty cell scattering and D2O background. The detector sensitivity corrections and the transformation to absolute scattering cross sections were made with a Lupolene standard (dΣ/dΩ = 1.78155 cm−1).
The specimens were dialyzed against D2O buffer to provide the correct contrast for the small angle neutron scattering (SANS) experiments, and ultraviolet absorption was used to calibrate the sample concentrations after dialysis. The samples in D2O were loaded in flat Helma cells with a 2-mm thickness of specimen to provide the optimal pathlength. The sample temperature was maintained at 296 K during the experiment.
D11 (ILL)
The camera lengths used were 2 and 8 m to insure overlap between the separate measurements and access to all the relevant length scales. Momentum transfers could be accessed in the range between 2.5 × 10⁻³ and 2 × 10⁻¹ Å−1. The software package Grasp was used combined with the MATHLAB 5.1 software to analyze the SANS data (D11) of the fragment. The flat field correction was taken from a 1-mm H2O sample. The empty cell background was subtracted; the beam center was calibrated with respect to the direct beam and absolute normalization was achieved relative to the water standard.
The scattering cross section (dΣ/dΩ) for neutrons is defined as:
 |
(5) |
where m is the number concentration of scattering centers, q is the momentum transfer, V is the volume of one scattering center, and  is the contrast factor between the polymer and the matrix solvent, calculated on the basis of tabulated values of the amino acid coherent scattering lengths (Jacrot, 1976); P(q) and S(q) indicate the intramolecular form and the intermolecular structure factors, respectively (Higgins and Benoit, 1994). In the specific case of the dilute regime S(q) ≡ 1.
The radius of gyration of titin-II was evaluated by Guinier analysis of the SANS data using Eq. 6, which is valid in the dilute regime, where the interparticle interactions are negligible, and in the limit of qRg < 1 (King, 1999):
 |
(6) |
Video particle tracking microrheology
Microrheology experiments were performed on titin-II in buffer A in the range of concentrations 0.12–0.50 mg/mL, using poly(amino) probe beads (Sigma Aldrich, St. Louis, MO) of 0.472 μm diameter. The experimental temperature was held constant at 296 K. Probe particles were tracked using an Olympus OH2 microscope and a modified version of the IDL tracking software of Weeks and co-workers. (http://glinda.lrsm.upenn.edu/∼weeks/idl/tracking.html). A 100× oil immersion lens was used to focus into the sample a few micrometers underneath the coverslip. The poly(amino) beads were chosen to reduce adsorption of titin-II onto the probes and improve phase stability of the colloid/protein mixtures. The displacement of the particle centroids was tracked in the focal plane of the objective at a rate of 25 frames per second.
Individual time-averaged mean-square displacements were calculated from the two-dimensional trajectories, and the viscosity was measured at a series of concentrations. Care was taken to provide a correct thermal equilibration of the specimens and removal of the effects of convection before recording a movie.
The viscosity of the buffer was measured to be 0.92 cP at 296 K.
RESULTS
Static light scattering
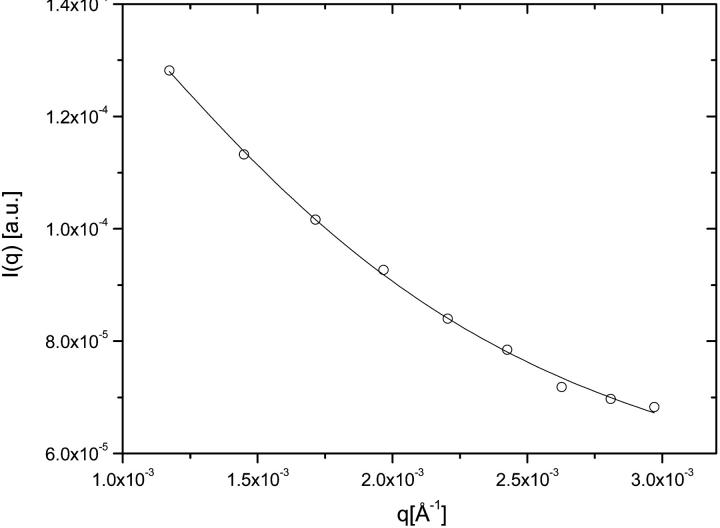
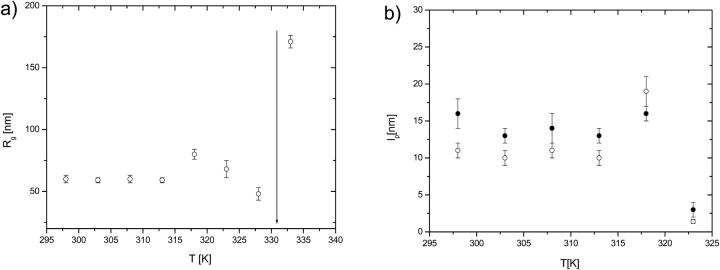
From the fits of Eq. 1a to experimental data the radius of gyration (Rg) of the titin-II molecule was calculated to be 60 ± 3 nm at a temperature of 298 K (Fig. 2). The temperature dependence of the radius of gyration is shown in Fig. 3 a; the exact values at each temperature are collected in Table 1. The persistence length of titin-II calculated from Eq. 1b was found to be 11 ± 1 nm at room temperature, for an average contour length of the protein of 1 μm, as indicated by electron microscopy (Tskhovrebova and Trinick, 1997). The temperature dependence of the persistence length is shown in Table 1 and Fig. 3 b. The persistence length remained constant up to 318 K (∼40°C), and then sharply changed its value to ∼1 nm, assuming the contour length of the unfolded titin-II polypeptide is 10 μm.
FIGURE 2.
Representative SLS curve (I(q) versus q) for titin in buffer A. The solid line is the fit to the data according to Eq. 1a.
FIGURE 3.
(a) The temperature dependence of the radius of gyration for titin-II in buffer B measured with static light scattering from fits to Eq. 1a. The arrow indicates the point at which the protein is denatured. (b) The temperature dependence of the persistence length from DLS/SLS measurements of titin-II in buffer B; ○ (Eq. 1b), • (Eq. 8).
TABLE 1.
The temperature dependence of the persistence length, diffusion coefficient hydrodynamic radius, and radius of gyration for titin-II from light scattering experiments
| T [K] | D [cm2/s] × 10−8 | Rh [nm] | Rg [nm] | lp[nm] (SLS) | lp[nm] (DLS) |
|---|---|---|---|---|---|
| 298 | 5.0 ± 0.2 | 49 ± 1 | 60 ± 3 | 11 ± 1 | 16 ± 2 |
| 303 | 6.3 ± 0.4 | 44 ± 3 | 59 ± 2 | 10 ± 1 | 13 ± 1 |
| 308 | 6.9 ± 0.3 | 46 ± 2 | 60 ± 3 | 11 ± 1 | 14 ± 2 |
| 313 | 7.9 ± 0.5 | 45 ± 3 | 59 ± 2 | 10 ± 1 | 13 ± 1 |
| 318 | 8.1 ± 0.5 | 50 ± 3 | 80 ± 4 | 19 ± 2 | 16 ± 1 |
| 323 | 6.5 ± 0.3 | 69 ± 3 | 68 ± 7 | 1.4 ± 0.3* | 3.0 ± 0.5* |
| 328 | 5.5 ± 0.3 | 91 ± 3 | 48 ± 5 | – | – |
| 333 | 1.4 ± 0.5† | 333 ± 10† | – | † | † |
Dynamic light scattering
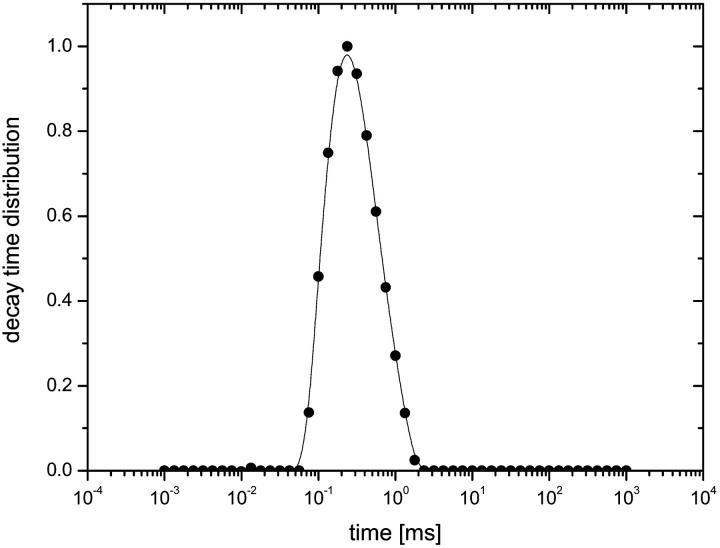
Fig. 4 shows a typical Contin analysis on the correlation functions from both titin-II and the I-band titin fragment indicating a single diffusive mode and suggesting a monodisperse protein preparation. The spectra width was quantified using a cumulant expansion of the correlation function (Koppel, 1972). The polydispersity index for both the whole molecular and fragments were on the order of 0.30, independent of angle and temperature (below the unfolding temperature). The diffusion coefficients were calculated from the gradient of the relaxation rate (Γ) versus q2 plots in the angular range 30–120°. The hydrodynamic radius was then evaluated from the diffusion coefficients using the Stokes-Einstein relationship:
 |
(7) |
where kB is the Boltzmann constant, T is the temperature, ηS is the solvent viscosity, and Rh is the protein's hydrodynamic size.
FIGURE 4.
Relaxation spectra from Contin analysis for titin-II in buffer B. Data refer to a representative scattering angle ϑ of 90°, at T = 298 K.
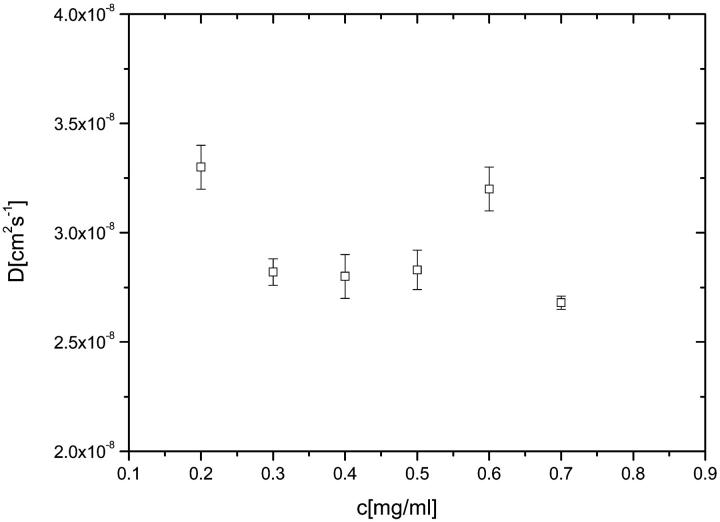
Under ambient conditions (temperature 298 K) we found that the translational diffusion coefficient (D) of titin-II is 5.0 ± 0.2 × 10⁻⁸ cm2s−1 and its hydrodynamic radius (Rh) is 49 ± 1 nm; for the fragment, values of D and Rh at T = 298 K are 2.0 ± 0.2 × 10⁻⁷cm2s−1 and 12.0 ± 0.5nm, respectively. The values of diffusion coefficients were not dependent on the concentration of the proteins, indicating negligible interchain interactions (Fig. 5).
FIGURE 5.
The concentration dependence of the diffusion coefficient (D) for titin-II in buffer A. Data refer to uncentrifuged solutions.
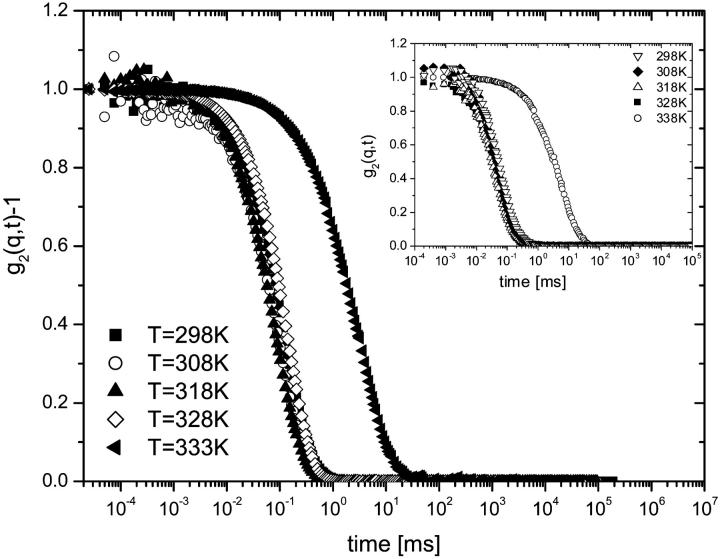
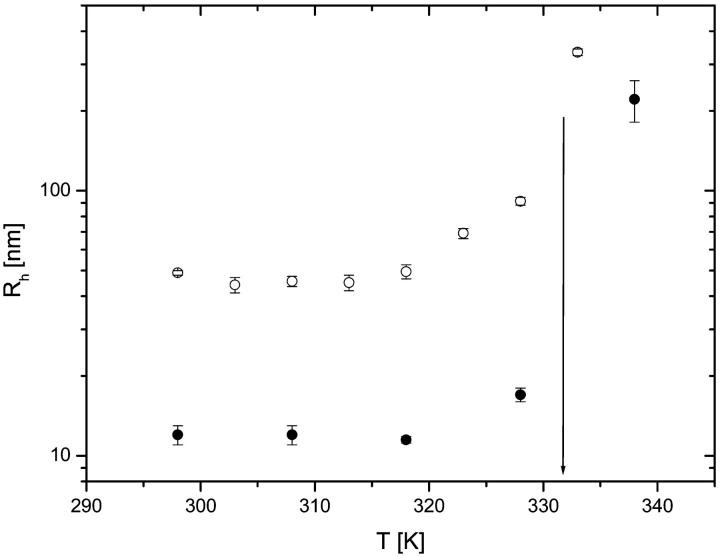
Intensity correlation functions g2(q,t) from solutions of both titin-II and the I-band titin fragment, as a function of temperature for a representative angle of 90°, are shown in Fig. 6. The values of the diffusion coefficients obtained are summarized in Table 1. The figure shows a noticeable slowing down of the dynamics with increasing temperature; a large change is observed around 333 K. The change was not related to aggregation effects, because our procedure to remove possible aggregates by centrifugation of the specimens did not affect the results, indicating that the temperature-related transition is intramolecular in nature and involves an increase in the hydrodynamic size of the proteins above 318 K (Fig. 7).
FIGURE 6.
DLS normalized correlation functions g2(q,t) from titin-II (c = 1.41 mg/mL) and the fragment from the I-band part of titin (c = 1.61 mg/mL) (inset) in buffer B. Data refer to a range of different temperatures (298–333 K) and scattering angle of 90°.
FIGURE 7.
The temperature dependence of the hydrodynamic radius: titin-II (○), and the fragment from the I-band part of titin (•). The arrow indicates the denaturated state of the protein. Both the data sets refer to preparations in buffer B.
To calculate persistence lengths of the proteins, the Kirkwood formula that relates the translational diffusion coefficient to the persistence length was used (Yamakawa, 1971):
 |
(8) |
where L is the contour length, ηS is the solvent viscosity, and γ is defined as 1/(2lp), where lp is the persistence length.
At 298 K, the persistence length was estimated to be ∼16 nm for titin-II and 10 nm for the fragment. The calculations were done with the assumptions that the contour length of titin-II and the I-band titin fragment were 1 μm and 100 nm, respectively. The values of lp of both proteins at different temperatures are collected in Tables 1 and 2. The temperature dependence of the persistence length for titin-II, calculated according to Eq. 8, is shown in Fig. 3 b (solid symbols). Initial experiments examined the effect of reducing the buffer concentration to physiological strengths (0.2 M KCl) and showed no effect on the resultant persistence length of the titin-II molecules with DLS and SLS.
TABLE 2.
The temperature dependence of the persistence length, diffusion coefficient, and hydrodynamic radius for the proteolytical fragment of titin from the I-band part of the molecule, from light scattering experiments
Small angle neutron scattering
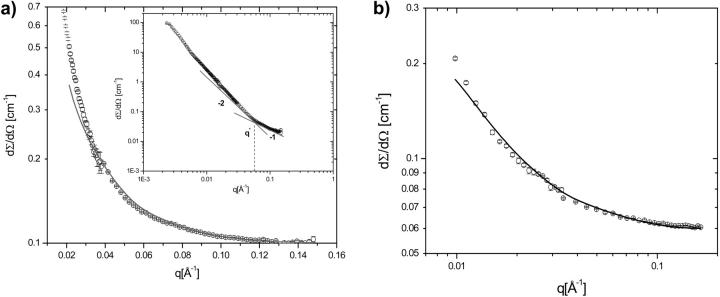
Neutron scattering profiles from solutions of titin-II (1.31 mg/mL, deuterated buffer A) and fragment (1 mg/mL, deuterated buffer B) are shown in Fig. 8, a and b. The data were fitted with the modified Sharp and Bloomfield equation in the limit L/2lp > 2 (Pedersen and Schurtenburger, 1996):
 |
(9) |
where Io is the forward scattering related to the molecular mass of the chain (Io = mV2Δρ2); Pcr(q) is the scattering function for a cylindrical shape ([2J1(qR)/(qR)]2), which approximates locally the finite cross section of the molecules;  q1 and p1 are empirical constants, and PDebye (q) is the Debye scattering function (Eq. 1a; see earlier text). Such an analysis has the advantage over the Kratky-Porod graphical method (Kratky, 1982), because it includes the effects of the cross section of the molecules. The graphical method does however clearly demonstrate the semiflexible nature of titin-II and the I-band titin fragment with a q−2 scaling (Gaussian coil) at large length scales and q−1 scaling (rodlike) at small length scales (see Fig. 8 a, inset). Fits of Eq. 9 to experimental data are shown in Fig. 8, a and b. This analysis provided values of the radius of gyration for titin-II and the I-band titin fragment of 50 and 17 nm, respectively. From these values the persistence lengths were estimated to be 10 and 9 nm for titin-II and the I-band titin fragment, assuming a contour length of 1 μm and 100 nm, respectively, and a cross-radius of 2 nm for both proteins.
FIGURE 8.
(a) SANS profiles (dΣ/dΩ vs. q) of titin-II (c = 1.31 mg/mL) in deuterated buffer A. The solid line indicates the fit of the experimental data to Eq. 9. The inset shows a Kratky-Porod representation, highlighting the crossover between rigid chain conformations (I ∼ q−1) at small length scales and Gaussian chains conformations (I ∼ q−2) at large length scales. (b) SANS profiles (dΣ/dΩ vs. q) of titin fragment from the I-band part of the molecule (c = 1 mg/mL) in deuterated buffer B. The solid line indicates the fit of the experimental data to Eq. 9.
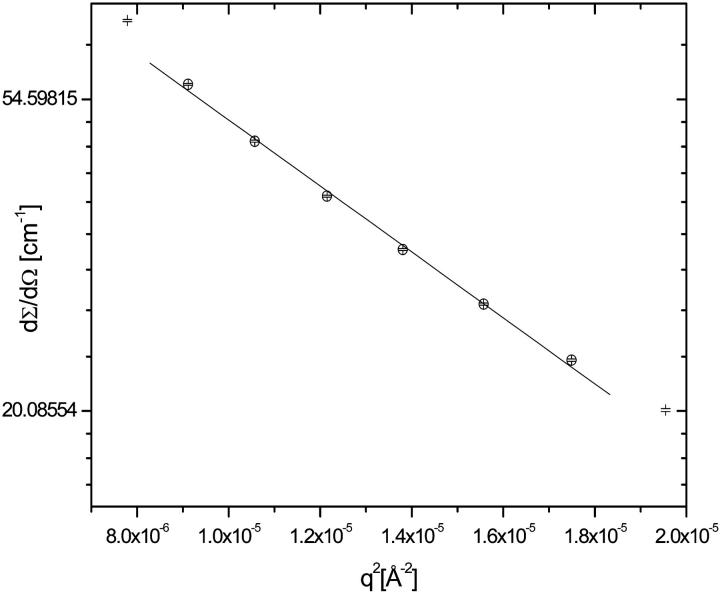
The values obtained were compared with the estimates made from the Guinier plot (Ln dΣ/dΩ vs. q2) as it is shown in Fig. 9. This analysis provided a value of 56 ± 5 nm. Using this estimate, the persistence length of 9 ± 2 nm of titin-II was calculated from the relation given for Gaussian coils (Eq. 1b), assuming a contour length of 1 μm. The Guinier analysis could not be applied to the fragment, because the condition qRg < 1 was not satisfied in the data set.
FIGURE 9.
Guinier plot (ln dΣ/dΩ vs. q2) of the low q section of the SANS data from titin in deuterated buffer A. The fit of the experimental data to Eq. 6 provides a value for Rg of 56 ± 5 nm.
The models for the chain scattering may only be applied in the limit of dilute concentrations, i.e., where S(q) ≅ 1. Using the estimated value of the radius of gyration from Guinier analysis and a nominal value of 3.0 MDa for the molecular weight of the protein, we evaluated the overlap concentration (c*), i.e., the concentration above which intermolecular interactions could not be neglected:
 |
(10) |
where Mw is the molecular weight of a chain, NA is the Avogadro's number, and Rg is the radius of gyration. We thus calculate c* to be ∼7 mg/mL and the measurements were in the dilute regime. We deduce that the SANS experiments were at sufficiently low concentrations to neglect interchain interference, because there is good agreement of the radius of gyration with results from other techniques (Table 3). The impact of concentration would be even smaller on higher q features such as the persistence length.
TABLE 3.
Comparison of Rg and lp for titin-II and the fragment from the elastic I-band part estimated from different experimental methods
| Titin-II
|
Fragment from the I-band part of titin
|
|||
|---|---|---|---|---|
| Methods | Rg [nm] | lp [nm] | Rg [nm] | lp [nm] |
| SANS-Guinier fit | 56 ± 5 | 9 ± 2 | – | – |
| SANS-Sharp and Bloomfield modified function | 50 ± 1 | 10 ± 0.3 | 17 ± 1 | 9 ± 1 |
| SLS-Guinier fit | 60 ± 3 | 11 ± 1 | – | – |
| Microrheology-Flory/Fox equation | 63 ± 1 | 12.0 ± 0.3 | – | – |
| DLS-Kirkwood formula | – | 16 ± 2 | – | 10 ± 1 |
Video particle tracking microrheology
The viscosity of the titin-II solutions was calculated via the definition of the diffusion coefficient (D) in two dimensions as a function of time (t) and the mean-square displacement (〈Δr2〉),
 |
(11) |
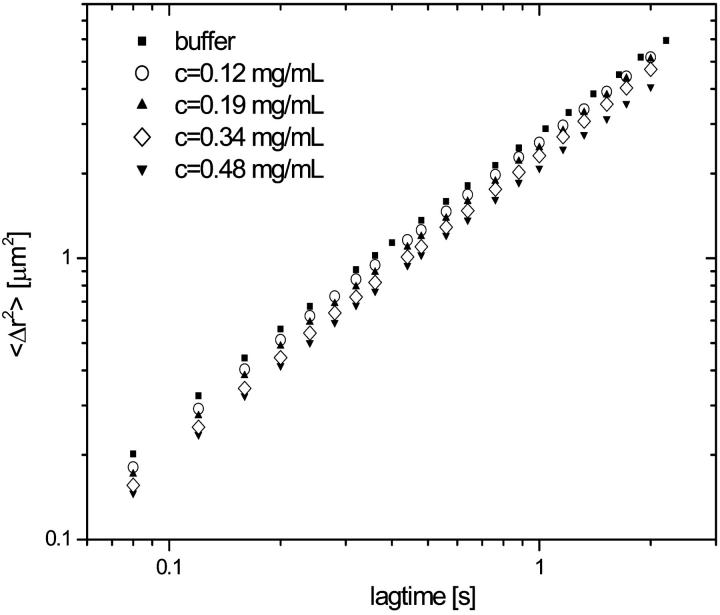
The mean-square displacement of the poly(amino) beads as a function of time for 0.12–0.50 mg/mL titin-II concentrations showed a pure viscous behavior (Fig. 10) (i.e., 〈Δr2〉∼t). Subsequently the viscosity was calculated from the Stokes-Einstein relationship (Eq. 7), where Rh is replaced by the radius of the probe particle.
FIGURE 10.
Mean-square displacement of poly(amino) beads from particle tracking microrheology as a function of time at a series of titin-II concentrations in buffer A for a range of concentrations between 0.12 and 0.50 mg/mL. The linear dependence indicates diffusion in a purely viscous solvent, i.e., 〈Δr2〉 = 4 Dt.
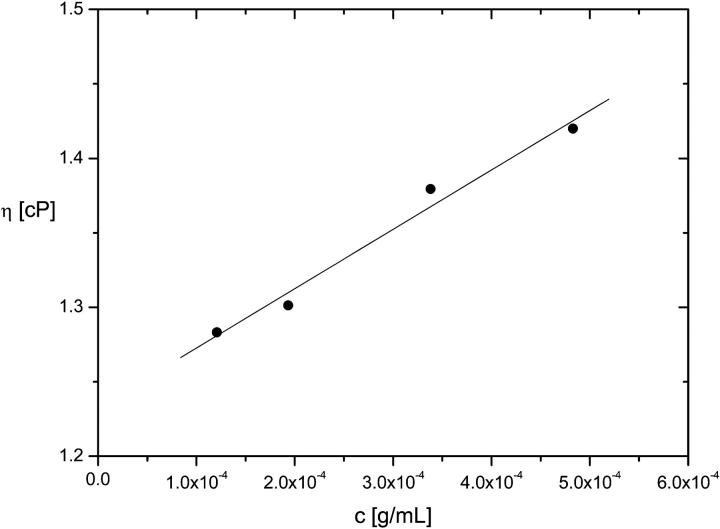
The intrinsic viscosity, [η], was then used as a means to estimate the size of titin-II in solution. [η] was determined from the intercept of a plot of the specific viscosity versus concentration according to the following relationship (Burchard, 1999; Goodman et al., 2002):
 |
(12) |
Mw is the protein molecular weight, NA is the Avogadro number, ηS is the solvent viscosity, and Rη is the protein size. Microrheology measurements provided a value for the specific viscosity [η] of 400 ± 40 mL/g, which is in agreement with the 410 mL/g estimated from previous light scattering data for β-connectin (Fujime and Higuchi, 1993). In Fig. 11 the specific viscosity is plotted versus concentration with a fit of Eq. 12.
FIGURE 11.
The intrinsic viscosity of the titin-II as a function of polymer concentration. The solid line indicates the best linear fit to the data according to Eq. 12.
The value ηS extrapolated from the experimental data fitted with Eq. 12 was 1.2 ± 0.1 cP, an accuracy of 20% on the measured value for the solvent. A value of 65 ± 5 nm was found for Rη. In Table 3 the main results obtained from the different experimental techniques for the persistence length are collected. The persistence length of titin-II, calculated as for Gaussian coils (Eq. 1b), gave a value of 12 ± 2 nm assuming a contour length of ∼1 μm.
DISCUSSION
Scattering studies of titin (titin-II) represent a challenging task, because preparations usually contain a mixture of monomers and oligomers of two or more molecules. Separation of these species is not easy due to the high molecular weight of the protein and its susceptibility to proteolysis, which not only disrupts the intermolecular interactions but also causes fragmentation of individual molecules. One of the most proteolytically sensitive sites is located in the middle of the elastic I-band part of titin that contains unique sequences (Kawamura et al., 1995), and its proteolysis during the preparation results in a loss of ∼1/3 of the length, producing what is known as titin-II or β-connectin. This corresponds to the mainly physiologically inelastic thick filament-bound part of titin formed by a linear chain of immunoglobulin and fibronectin-3 domains. Similar preparations (β-connectin of chicken breast muscle) were studied previously by means of dynamic light scattering by Higuchi et al. (1993) that provided estimates for the persistence length and other physical parameters of this part of the molecule. We analyzed the scattering properties of titin-II and of its fragment from the physiologically elastic I-band part to obtain a closer insight into the relationship between structure and flexibility of the molecule. The molecular homogeneity of the proteins was ensured by high-speed centrifugation before the experiments, and was confirmed by estimates of its molecular weight based on the parameters evaluated from the scattering data.
Persistence length
The range of scattering vectors used in this neutron study satisfy the condition 2π/q ∼ lp for lp between 10 and 20 nm, indicating that the experiments contain direct information on the semiflexibility of the molecules in this regime. The SANS data from titin-II and the I-band titin fragment allows robust self-consistent measurement of the persistence length.
Fits of a modified Sharp Bloomfeld model shown in Fig. 8, a and b, provided more accurate values of lp, than the Kratky/Porod graphical method (Fig. 8 a, inset), because they take better account of the chain's statistics (semiflexible nature) and include the cross section of the chain (Pedersen and Schurtenburger, 1996). Combining the results from DLS/SLS and SANS measurements the ratio between the hydrodynamic size and the radius of gyration was calculated, which allows information on the molecular geometry to be made (Rubinstein and Colby, 2003). Rg/Rh was evaluated as a function of temperature. The naïve theoretical calculation for a flexible Gaussian chain in a θ-solvent gives the expected value of Rg/Rh from Zimm theory is 1.5, whereas the accepted experimental value (Rubinstein and Colby, 2003) is measured to be 1.30. Our combination of SLS and DLS measurements at ambient temperature provides a value of 1.3 ± 0.1, in agreement with the accepted experimental value and with modern molecular dynamics simulations (Oono, 1983). This gives an additional proof of the flexible Gaussian nature of the titin-II molecules at large length scales. Within error we find no significant change in the persistence length between the titin I-band fragment and the titin-II molecules. We conclude that the I-band section of the titin molecule beyond its attachment point with the thick filament, is a semiflexible chain of 10.0 ± 0.3 nm persistence length (see Table 3), which globally acts in a Gaussian manner. Small differences in the persistence length derived from the different experimental techniques are probably due to the different weighting of the techniques to molecular specific features, e.g., torsional modes of rotation, hydrophilic/hydrophobic interdomain interactions, etc. Explanation of these subtle effects is a goal for future improved modeling.
Evidence for association was found for noncentrifuged samples as the forward scattering in SLS experiments dropped during temperature ramps, indicating fragmentation of the aggregates. In this behavior the molecules resemble the behavior of sticky charged hydrophobically modified polyelectrolytes (Di Cola et al., 2004).
Effect of temperature
The flexural rigidity (ɛ) of the titin-II was calculated as a function of the temperature according to the following relationship:
 |
(13) |
where kBT is the thermal energy. From our SLS/DLS measurements of lp at ambient temperature of 298 K, ɛ is calculated to be ∼5 and 7 × 10⁻²⁰ dynecm2 for titin-II and the I-band titin fragment, respectively, close to the value found for β-connectin (ɛ = 6 × 10⁻²⁰ dynecm2). The flexibility of titin-II depends on the temperature in a manner that is not explained by the standard temperature dependence expected for the modulus of a wormlike chain (Odijk and Houwaart, 1978). We deduce that a series of structural changes occur during its denaturation.
In Fig. 3 b the temperature dependence of the persistence length is shown; lp was calculated according to Eqs. 1.b and 8 assuming a contour length L of ∼1000 nm in the temperature range below 318 K; above this threshold the protein starts to denature. The denaturation process involves a change in the length of the molecules, due to the unfolding of titin domains. L in the fully unfolded state is expected to be ∼10 times the length in the native state. Thus a value of 10 μm was qualitatively assumed above 318 K, providing an upper bound for lp. Temperature measurements showed a gradual rather than a sharp transition between coil and uncoiled states (Fig. 3, a and b), which could reflect the unfolding of the domains in transient intermediate steps. Generally, large proteins composed of multiple structural domains lead to complex unfolding curves, because the independent domains unfold statistically depending on random localized thermal perturbations (Creighton, 1993).
It is important to highlight that at a temperature of 333 K the q2 dependence of the decay rate Γ was no longer observed; thus the value of the diffusion coefficient was calculated by the relaxation time at an angle ϑ of 90°. This only provides an estimate of the protein hydrodynamic size in the unfolded state.
The persistence length of the unfolded titin domains is measured to be at least 10 times shorter than that of the native state, indicating a high flexibility in the denatured state of the molecule (e.g., Rief et al., 1997). The DLS measurements offer another piece of experimental evidence for this feature of the protein dynamics.
Dynamic light scattering can be used as a molecular probe of the thermal denaturation of titin. The results are in agreement with the denaturation temperature (∼333 K) previously found for bovine and porcine titin using differential scanning calorimetry (Pospiech et al., 2002). A new result is that there is a gradual process of unwinding/decrease in persistence length, which occurs as a precursor to the DSC endotherm, in the range of temperatures between 318 and 333 K.
Viscoelasticity
Video particle microrheology examines the thermal motion of colloidal particles embedded in a material to extract the bulk rheological properties. Compared with conventional rheology and scattering techniques, only small amounts of material are required (order of μL) (MacKintosh and Schmidt, 1999).
The microrheology experiments allowed a robust measurement of the radius of gyration assuming the non-free-draining Flory/Fox model (Edwards and Doi, 1986; Goodman et al., 2002), for which the viscosity of a dilute suspension of flexible polymers increases linearly with concentration. The observed difference between the measured and the extrapolated value of the buffer viscosity in the microrheology experiments (ηs) could be explained by a small degree of adsorption of the protein onto the poly(amino) probe beads. Thus, a correction was made taking into account that an adsorbed layer with thickness h is formed onto the beads of size a. We assumed h was independent of the titin-II concentration in the range investigated and we note that this assumption only has a small effect on the calculated radius of gyration.
ηm is defined to be the viscosity measured with single particle tracking and is given by the Stokes-Einstein relationship (Eq. 7). However in the expression of the diffusion coefficient (Do) we now take into account that the dimension of the bead is (a + h):
 |
(14) |
Thus the comparison between the three equations (Eqs. 7, 12, and 14) leads to the correct form of the measured viscosity ηm:
 |
(15) |
Equation 15 provided a value for Rη of 63 ± 1 nm. The sizes found from microrheology measurements are compared in Table 3 with values of Rg calculated by Guinier analysis of both SANS and SLS data. Moreover, these experimental results compare well with the theoretical predictions for the end to end distance (〈R〉) of a completely flexible Gaussian chain in a θ-solvent, i.e., 〈R〉 = (2lp)(Lc/2lp)1/2. For a single titin-II molecule this leads to an estimate of 58 nm for Rg = (〈R2〉/6)1/2.
Action of titin in vivo
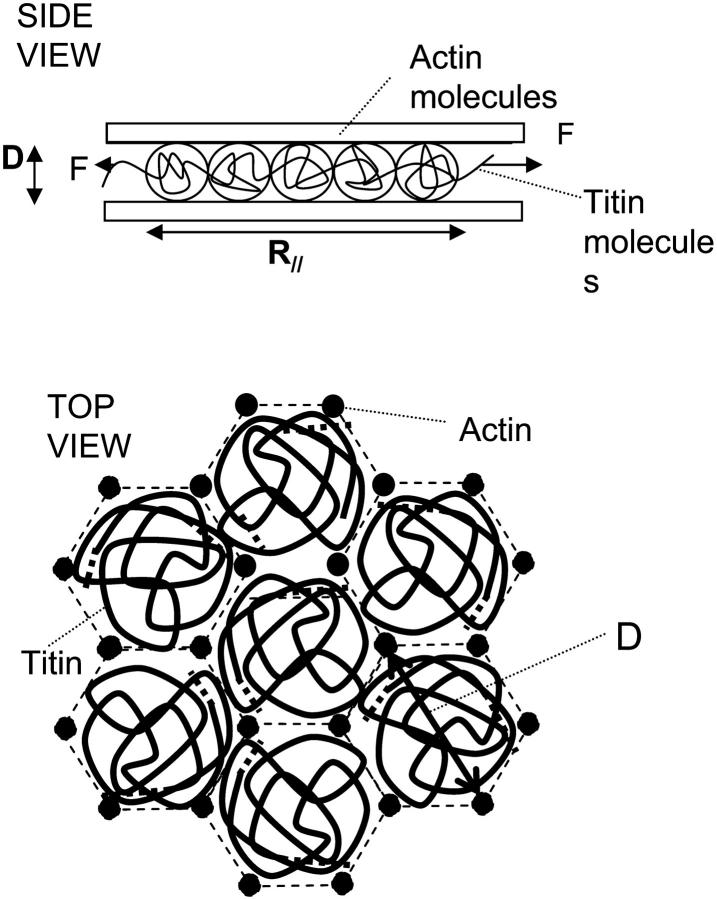
It is interesting to consider the statistical mechanics of the Gaussian titin chains in a pore, because this approximates to their behavior in vivo contained between actin filaments. A fundamental question is how the pore geometry will change the conformation of the flexible titin molecules. This has been previously explained in the synthetic polymer literature using the concept of thermal blobs (Cifra and Bleha, 1999; Daoud and de Gennes, 1977; Rubinstein and Colby, 2003). A rough schematic diagram of the molecular arrangement of the I-band part of titin in a pore formed by hexagonally packed actin filaments is shown in Fig. 12. We take an approximation for the diameter of the pore (Db) from the x-ray measurements of Millman (1998), i.e., Db ∼ 40 nm. The use of the cylindrical pore to approximate a hexagonal actin cage is justified, because the excluded volume of the blobs in the neighboring pores acts as a steric wall, prohibiting the escape of titin blobs through the bars of the actin cages.
FIGURE 12.
Schematic diagram of a section of titin molecule in a pore formed by hexagonally packed actin/thin filaments, i.e., near the I-/A-boundary of sarcomere beyond the myosin/thick filament. The blob concept is used to calculate the effect of the steric interactions with the actin filaments on the extension and entropic force of the chain.
The radius of gyration (R∥) of a flexible chain with its monomer length of the order of its persistence length within the pore is then given by (Cifra and Bleha, 1999; Daoud and de Gennes, 1977; Grosberg and Khokhlov, 1994):
 |
(16) |
N is the number of Kuhn segments (∼25), a is the Kuhn segment length (30 nm with ∼10 protein domains in a segment), and Db is the pore size. Using values from the scattering experiments this implies an increase in the ambient unstretched length of the chain (R∥ ∼ 600 nm compared to Rg ∼ 60 nm) when compressed inside the 40-nm pore. The end-to-end length is thus roughly 10 times longer due to steric interaction with the surrounding actin filaments.
The entropic force f exerted on the ends of the chain by the internal conformational fluctuations can be evaluated according to (Rubinstein and Colby 2003):
 |
(17) |
where b is the monomer size, F is the free energy, U is the internal free energy, S is the entropy, υ is an exponent that equals 1/2 for a θ-solvent (indicated by the measured ratio of Rg/Rh) (Rubinstein and Colby, 2003). We thus calculate that the force of an individual titin molecule is 5 pN at a temperature of 298 K.
Note that there is no change in the elasticity of the stretched titin chain confined to a pore, because the size of the tension blob (ξ = (Rx/(Nb1/υ))υ/υ−1 is 8 nm, much smaller than the steric blob size defined by the interaction with the walls of the pore (40 nm) (Rubinstein and Colby, 2003). Here Rx is the length of sarcomere section containing the I-band segment of titin molecule, N is the number of monomers in the free 600-nm length section, and b is the monomer length.
These calculations assume no repulsion/attraction of the titin molecules by the walls of the pores. A more sophisticated future analysis would require the consideration of the effect of more than one titin molecule in a pore, better definition of the effect of the persistence length, adsorption, and charge effects, but should be considered a future goal for the complete understanding of the molecules in vivo.
No change in the hydrodynamic radius and thus the persistence length of the free solution state titin-II was found for Debye screening lengths in the range 0.43–0.61 nm.
CONCLUSIONS
The persistence length of titin-II and a titin fragment from the elastic I-band part of the molecule were measured with neutron scattering and found to be 10 ± 0.3 and 9 ± 1 nm, respectively. Dynamic light scattering indicates that increasing the temperature causes two behaviors with the molecules; gradual unwinding with a 50% change in persistence length (318–333 K), followed by a sharp change at 333 K. Video particle tracking microrheology with amino derivatized beads was successfully used to measure the radius of gyration (63 ± 1 nm) of the titin-II in solution in agreement with DLS, SLS, and SANS results. Such measurements indicate that the viscoelasticity of titin-II in solution is that expected from a non-free-draining flexible chain. The SANS, DLS, SLS, and microrheology results all point to the flexible Gaussian chain nature of the whole chain titin and fragment conformations.
Acknowledgments
The authors thank Dave Bowyer for help with the SANS measurements on D11 beam line. We thank Aristedis Papagiannopoulos and Edoardo de Luca for their help in setting up the microrheology experiments. We acknowledge Nasir Khan for the titin preparations and Dr. Sabine Wilbold for the ultraviolet measurements.
References
- Amodeo, P., F. Fraterneli, A. M. Lesk, and A. Pastore. 2001. Modularity and homology: modelling of the titin type I modules and their interfaces. J. Mol. Biol. 311:283–296. [DOI] [PubMed] [Google Scholar]
- Berne, B. J., and R. Pecora. 2000. Dynamic Light Scattering. Dover Publications, New York, NY.
- Bray, D. 1992. Cell Movements. Garland, New York, NY.
- Burchard, W. 1999. Solution properties of branched macromolecules. Adv. Polym. Sci. 143:113–194. [Google Scholar]
- Cifra, P., and T. Bleha. 1999. Anisotropy in the dimensional and elastic parameters of confined macromolecules. Macomol. Theory Simul. 8:603–610. [Google Scholar]
- Creighton, T. 1993. Proteins. W. H. Freeman, New York, NY.
- Daoud, M., and P. G. de Gennes. 1977. Statistics of macromolecular solutions trapped in small pores. J. Phys. [E]. 38:85–93. [Google Scholar]
- Di Cola, E., N. Plucktaveesak, T. A. Waigh, R. H. Colby, J. Tan, R. K. Heenan, and W. Pyckhout-Hintzen. 2004. Structure and dynamics in aqueous solutions of amphiphilic sodium maleate-containing alternating copolymers. Macromolecules. 37:8457–8465. [Google Scholar]
- Edwards, S. F., and M. Doi. 1986. The Theory of Polymer Dynamics. Oxford University Press, Oxford, UK.
- Fraternali, F., and A. Pastore. 1999. Modularity and homology: modelling of the type II module family from titin. J. Mol. Biol. 290:581–593. [DOI] [PubMed] [Google Scholar]
- Fujime, S., and H. Higuchi. 1993. An analysis of the dynamic light scattering spectra of wormlike chain beta-connectin from striated muscle. Macromolecules. 26:6261–6266. [Google Scholar]
- Goodman, A., Y. Tseng, and D. Wirtz. 2002. Effect of length, topology, and concentration on the microviscosity and microheterogeneity of DNA solutions. J. Mol. Biol. 323:199–215. [DOI] [PubMed] [Google Scholar]
- Granzier, H., M. Helmes, and K. Trombitas. 1996. Nonuniform elasticity of titin in cardiac myocytes: a study using immunoelectron microscopy and cellular mechanics. Biophys. J. 70:430–442. [DOI] [PMC free article] [PubMed] [Google Scholar]
- Granzier, H., and S. Labeit. 2004. The giant protein titin. A major player in myocardial mechanics, signalling and disease. Circ. Res. 94:284–295. [DOI] [PubMed] [Google Scholar]
- Grosberg, A. Y., and A. R. Khokhlov. 1994. Statistical Physics of Macromolecules. AIP Press, Melville, NY.
- Higgins, J. S., and H. C. Benoit. 1994. Polymers and Neutron Scattering. Oxford University Press, Oxford, UK.
- Higuchi, H., Y. Nakauchi, K. Maruyama, and S. Fujime. 1993. Characterization of beta-connectin (titin-2) from striated-muscle by dynamic light-scattering. Biophys. J. 35:1906–1915. [DOI] [PMC free article] [PubMed] [Google Scholar]
- Hohenadl, M., T. Storz, H. Kirpal, K. Kroy, and R. Merkel. 1999. Desmin filaments studied by quasi-elastic light scattering. Biophys. J. 77:2199–2209. [DOI] [PMC free article] [PubMed] [Google Scholar]
- Houmeida, A., B. Thompson, S. Burgess, J. Keen, K. Thirumurugan, L. Tskhovrebova, P. J. Knight, and J. Trinick. 2003. Preparation of synthetic titin end-filaments. Biophys. J. 84:563A. [Google Scholar]
- Jacrot, B. 1976. Study of biological structures by neutron-scattering from solution. Rep. Prog. Phys. 39:911–953. [Google Scholar]
- Kawamura, Y., H. Kume, Y. Itoh, S. Ohtsuka, S. Kimura, and K. Maruyama. 1995. Localization of 3 fragments of connectin in chicken breast muscle sarcomeres. J. Biochem. (Tokyo). 117:201–207. [DOI] [PubMed] [Google Scholar]
- Kellemayer, M. S. Z., S. B. Smith, H. L. Granzier, and C. Bustamante. 1997. Folding-unfolding transitions in single titin molecules characterized with laser tweezers. Science. 276:1112–1116. [DOI] [PubMed] [Google Scholar]
- King, S. M. 1999. Small angle neutron scattering. In Modern Techniques for Polymer Characterisation. R. A. Pethrick, editor. John Wiley, Hoboken, NJ. 171–232.
- Koppel, D. E. 1972. Analysis of macromolecular polydispersity in intensity correlation spectroscopy: method of cumulants. J. Chem. Phys. 57:4814–4820. [Google Scholar]
- Kratky, O. 1982. In Small Angle X-ray Scattering. O. Glatter and O. Kratky, editors. Academic Press, Burlington, MA. 361–386.
- Labeit, S., and B. Kolmerer. 1995. Titins: giant proteins in charge of muscle ultrastructure and elasticity. Science. 270:293–296. [DOI] [PubMed] [Google Scholar]
- Leake, M. C., D. Wilson, M. Gautel, and R. M. Simmons. 2004. The elasticity of single titin molecules using a two-bead optical tweezers assay. Biophys. J. 87:1112–1135. [DOI] [PMC free article] [PubMed] [Google Scholar]
- Lindner, P., R. P. May, and P. A. Timmins. 1992. Upgrading of the SANS instrument D-11 at the ILL. Physica B. (Amsterdam). 180:967–972. [Google Scholar]
- Linke, W. A., M. R. Stockmeier, M. Ivemeyer, H. Hosser, and P. Mundel. 1998. Characterizing titin's I-band Ig domain region as an entropic spring. J. Cell Sci. 111:1567–1574. [DOI] [PubMed] [Google Scholar]
- MacKintosh, F. C., and C. F. Schmidt. 1999. Microrheology. Curr. Opin. Colloid Interface Sci. 4:300–307. [Google Scholar]
- Millman, B. M. 1998. The filament lattice of striated muscle. Physiol. Rev. 78:359–384. [DOI] [PubMed] [Google Scholar]
- Odijk, T., and A. A. Houwaart. 1978. Theory of excluded volume effect of a polyelectrolyte in a 1–1 electrolyte solution. J. Polym. Sci. [B]. 16:627–639. [Google Scholar]
- Oono, Y. 1983. Crossover-behaviour of transport-properties of dilute polymer solutions: renormalisation group approach. 3. J. Chem. Phys. 79:4629–4642. [Google Scholar]
- Pedersen, J. S., and P. Schurtenburger. 1996. Scattering functions of semiflexible polymers with and without excluded volume effects. Macromolecules. 29:7602–7612. [Google Scholar]
- Pospiech, E., M. L. Greaser, B. Mikolajczak, W. Chiang, and M. Krzywdzinska. 2002. Thermal properties of titin from porcine and bovine muscles. Meat Sci. 62:187–192. [DOI] [PubMed] [Google Scholar]
- Rief, M., M. Gautel, F. Oesterhelt, J. M. Fernandez, and H. E. Gaub. 1997. Reversible unfolding of individual titin immunoglobulin domains by AFM. Science. 276:1109–1112. [DOI] [PubMed] [Google Scholar]
- Rubinstein, M., and R. H. Colby. 2003. Polymer Physics. Oxford University Press, Oxford, UK.
- Trinick, J., P. Knight, and A. Whiting. 1984. Purification and properties of native titin. J. Mol. Biol. 180:331–356. [DOI] [PubMed] [Google Scholar]
- Tskhovrebova, L., and J. Trinick. 1997. Direct visualization of extensibility in isolated titin molecules. J. Mol. Biol. 265:100–106. [DOI] [PubMed] [Google Scholar]
- Tskhovrebova, L., and J. Trinick. 2001. Flexibility and extensibility in the titin molecule: analysis of electron microscope data. J. Mol. Biol. 310:755–771. [DOI] [PubMed] [Google Scholar]
- Tskhovrebova, L., and J. Trinick. 2003. Titins: properties and family relationships. Nat. Rev. Mol. Cell Biol. 4:679–689. [DOI] [PubMed] [Google Scholar]
- Tskhovrebova, L., J. Trinick, J. A. Sleep, and R. M. Simmons. 1997. Elasticity and unfolding of single molecules of the giant muscle protein titin. Nature. 387:308–312. [DOI] [PubMed] [Google Scholar]
- Wang, K., J. G. Forbes, and A. J. Jin. 2001. Single molecule measurements of titin elasticity. Prog. Biophys. Mol. Biol. 77:1–44. [DOI] [PubMed] [Google Scholar]
- Yamakawa, H. 1971. Modern Theory of Polymer Solutions. Harper and Row, New York, NY.
- Yoshizaki, T., and H. Yamakawa. 1980. Scattering functions of wormlike and helical wormlike chains. Macromolecules. 13:1518–1525. [Google Scholar]


