Abstract
We developed an optical probe for cross-polarized reflected light measurements and investigated optical signals associated with electrophysiological activation in isolated lobster nerves. The cross-polarized baseline light intensity (structural signal) and the amplitude of the transient response to stimulation (functional signal) measured in reflected mode were dependent on the orientation of the nerve axis relative to the polarization plane of incident light. The maximum structural signal and functional response amplitude were observed at 45°, and the ratio of functional to structural signals was approximately constant across orientations. Functional responses were measured in single trials in both transmitted and reflected geometries and responses had similar waveforms. Both structural and functional signals were an order of magnitude smaller in reflected than in transmitted light measurements, but functional responses had similar signal/noise ratios. We propose a theoretical model based on geometrical optics that is consistent with experimental results. In the model, the cross-polarized structural signal results from light reflection from axonal fibers and the transient functional response arises from axonal swelling associated with neural activation. Polarization-sensitive reflected light measurements could greatly enhance in vivo imaging of neural activation since cross-polarized responses are much larger than scattering signals now employed for dynamic functional neuroimaging.
INTRODUCTION
Brain imaging techniques with high spatial and temporal resolution are required to investigate the interactions between many thousands of neurons working together. A number of methodologies are currently available for recording dynamic activation patterns from large neural populations. High-density microelectrode arrays have spatial resolution limited by the number and spacing of electrodes and the conductivity properties of neural tissue. Penetrating electrode arrays requires invasive procedures for insertion, which can damage tissue. Noninvasive electrophysiological technologies such as EEG and MEG (electro- and magnetoencephalography) measure an integrated neural population response. They provide only limited spatial resolution and require solution of an ill-posed inverse problem for source localization. Existing MRI and optical techniques for functional imaging also tend to provide low spatial resolution and are sensitive to metabolic responses that lag behind neurophysiological responses. Although each approach provides information about neural activation, each has limitations.
Advanced optical methods based on fast intrinsic optical signals probe neural activation processes that alter tissue light absorption and scattering properties. Some of these signals are tightly coupled to electrophysiological response dynamics. In principle, such changes can be observed in single cells over a wide area of tissue using inexpensive and rather mature optical imaging technologies.
Observations of physical changes associated with activation of neural tissue began over a century ago (Mann, 1894). Subsequent studies have described optical techniques that elucidate several aspects of neural activation. Light of specific wavelengths can be used to record changes in absorbance and fluorescence of cellular proteins or endogenous chromophores during neural activation. Changes have been reported in cytochrome absorption associated with increased metabolic demand following neural activation (Heekeren et al., 1999). Changes in blood flow and hemoglobin oxygenation are the basis of functional MRI and can also be recorded optically using invasive (Grinvald, 1992), and noninvasive (Chance et al., 1997; Hoshi et al., 2000) techniques. However, metabolic and hemodynamic signals are relatively slow and do not provide information on the characteristic timescales of neural dynamics.
Electrical activation of nerves also causes fast intrinsic optical changes in scattering and birefringence (i.e., rotation of the polarization vector of transmitted light) that are largely independent of wavelength and are closely associated with action potentials and postsynaptic potentials (Tasaki et al., 1968, Cohen and Keynes, 1971; Landowne, 1985; Rector et al., 1997). Several biophysical processes have been proposed as possible mechanisms of the fast optical signals. Reorientation of membrane proteins (e.g., ionic channels) and phospholipids with voltage or mechanical changes might result in transient changes in the interaction of neural tissue with polarized light (Cohen et al., 1968; Landowne, 1993; Tasaki et al., 1968). Microtubules exhibit birefringence (Oldenbourg et al., 1998), and thus might contribute to structural and functional cross-polarized light signals. Such mechanisms would be expected to differentially retard the phase of the vector components of incident light. However, a recent investigation using phase-sensitive low coherence optical reflectometry (Akkin et al., 2004) failed to directly measure a change in phase retardance in stimulated crayfish walking leg nerve, although clear light-scattering signals associated with neural activation were recorded. Thus transient changes in phase retardance during neural activation may account for only a small component of the observed cross-polarization signal.
A number of processes in neural tissue might give rise to fast light-scattering signals. Light-scattering changes observed in activated retina have been attributed to the binding and dissociation of G-protein and other processes associated with the visual transduction process (Harary et al., 1978; Kuhn, 1980; Kuhn et al., 1981; Pepperberg et al., 1988; Arshavsky et al., 2002). Fast scattering signals associated with neurotransmitter secretion have been identified in brain structures such as the neurohypophysis (Salzberg et al., 1985). Water influx in response to ionic currents through gated channels during depolarization causes cellular swelling that can produce changes in tissue light scattering (Cohen, 1973; Tasaki and Byrne, 1992; Yao et al., 2003), but a connection of this process to observed functional changes in cross-polarized light transmission has not been established.
Optical imaging of fast intrinsic optical responses is a promising method that may provide a useful alternative or adjunct to multi-channel electrophysiological techniques for dynamic measurements of neural activation. Optical techniques offer a number of technical advantages; measurements are fast, cost-effective, and noninvasive, with high spatial and temporal resolution. Camera-based techniques allow investigations on spatial scales ranging from subcellular structures to square centimeters of tissue. Cameras employ high quality yet inexpensive readout electronics shared by hundreds to millions of discrete sensors. In contrast, electrode arrays typically employ dedicated amplifiers and separate analog acquisition channels for each electrode. Optical methods offer the possibility of three-dimensional mapping based on confocal microscopy or low coherence tomography. Although microelectrodes can be used to record spikes from individual identified cells, tissue measurements such as local field potentials provide limited spatial resolution due to the relatively high conductivity of the extracellular space and the associated spread of potentials, and the summation of responses from cells over a large volume of tissue. We have previously demonstrated the feasibility of dynamic scattered light imaging of brain activation, using contact image probes based on CCD (charge-coupled device) cameras (Rector et al., 1999, 2001). However, the sensitivity of scattering measurements is limited by low signal/noise ratio (SNR) and high background intensity.
Fast intrinsic birefringence signals (or more precisely, cross-polarized transmission signals) associated with neural activation have been recorded from isolated nerves with an order of magnitude improvement in SNR relative to simultaneous measurements of the light-scattering response (Carter et al., 2004), but such polarization measurements employed a transmission geometry unsuitable for many in vivo applications. In this study, we develop and demonstrate a compact optical probe for reflected light measurements, and use it to record cross-polarized responses associated with electrophysiological activation of isolated lobster nerves. Although our eventual goal is to image neural activation over a large area in vivo, investigations with isolated nerves are important for understanding the biophysical mechanism of optical signals associated with neural activation. The isolated nerve preparation also simplifies experimental procedures and controls, and allows development of simpler and more accurate theoretical models for conceptual verification. We and other investigators have developed an extensive body of experience with the lobster nerve. Our experience suggests that the use of the isolated nerve preparation reduces the development time and cost of novel techniques for functional neuroimaging.
In principle, optical polarization changes can result from birefringence, dichroism, scattering, and also reflection (Hecht, 2002). As a possible explanation of our experimental results, we propose a theoretical model of the contribution of tissue microgeometry to the observed cross-polarization measurements. According to our model, the cylindrical structure of lobster axons accounts for the structural cross-polarization signals and their orientation dependence. Our model also suggests that small changes in axon diameter might account for the fast transient functional signals. The data are in reasonable quantitative agreement with model predictions.
MATERIALS AND METHODS
Our recordings used nerves from lobster Homarus americanus legs (Sea View Lobster, Kittery, ME). Lobster leg nerves were extracted using the Furusawa “pulling out” method (Furusawa, 1929). Nerves were tied off with suture at each end to prevent cytosolic leakage and to extend the life of the nerve. The nerve size varied from 40 to 80 mm long and 0.5–3 mm in diameter. The isolated nerves were placed in a species-specific Ringer solution contained in a recording chamber for simultaneous electrical and optical measurements. The details of the chamber and electrophysiological recording system were discussed in previous publications (Yao et al., 2003; Carter et al., 2004; Rector and George, 2001). At one end of the narrow chamber, the nerve rested on a pair of silver wires used to stimulate. At the other end of the nerve, a similar pair of wires was used to record the electrophysiological response. Optical responses were measured at a window between these two sites. The health of the nerve preparation and the effectiveness of the stimulation and recording procedures were assessed by determining the lowest stimulation current needed to recruit the first action potential (typically 0.05–0.15 mA). During the experiment, a healthy nerve produced at least 1000 consistent compound action potential volleys over a 1–2 h period.
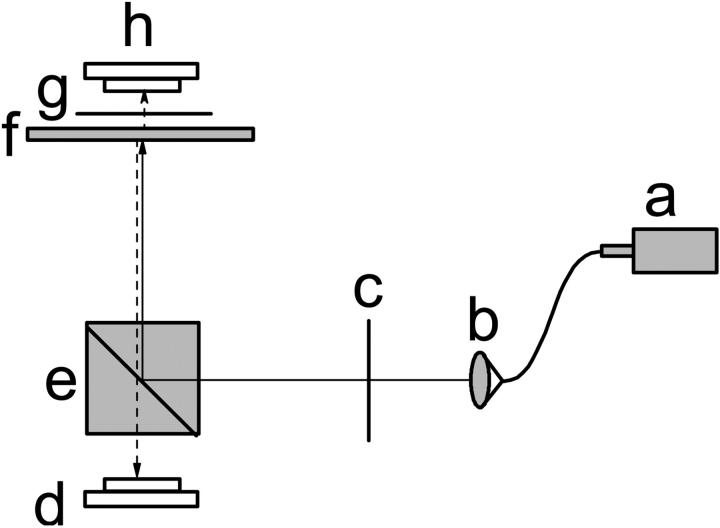
A schematic diagram of the imaging probe for cross-polarized measurements is illustrated in Fig. 1. A superluminescent laser diode (SLD) (SLD38MP, Superlum Diodes, Moscow, Russia) was used as the source of near-infrared light (∼793 nm). Only s-polarized light, with E-field direction perpendicular to the plane of incidence of the beam splitter, was reflected by the polarizing beam splitter cube and illuminated the lobster nerve. For the scattered light that was depolarized by the nerve tissue, only the p-polarized part (with polarization parallel to the plane of incidence of the beam splitter) passed through the polarizing beam splitter and was detected by the photodiode. A linear polarizer placed before the beam splitter rejected the p-polarized light, reducing the light noise and increasing the system dynamic range. The polarization axis of the linearly polarized light was adjusted relative to the axis of the isolated nerve. To investigate the difference and compare the sensitivity of polarization measurements in reflected and transmitted modes, another polarizer and photodiode were placed on top of the nerve, so that reflected and transmitted light signals could be measured simultaneously. In both cross-polarized measurement configurations, we record light with a polarization axis that has been effectively rotated through interaction with the sample.
FIGURE 1.
Diagram of the experimental setup. Near infrared light from a SLD (a) was coupled by a single-mode fiber and was collimated by an optical collimator (b). The p-polarized light was rejected and s-polarized light was transmitted by a polarizer (c). The s-polarized light was reflected by a polarizing beam splitter (e) and focused on the nerve bundle (f). Some incident s-polarized light was depolarized to p-polarized and reflected by the nerve. Only the reflected p-polarized light could pass through the polarizing beam splitter and illuminate a photodiode (d). With another polarizer (g) and photodiode (h), the transmitted polarization changes could be measured simultaneously.
The nerve was stimulated with 0.1–2.5 mA constant current (model A365, WPI, Sarasota, FL) at 1–2 s random interstimulus interval with a pulse width of 0.2 ms. Evoked electrical and polarization signals were digitized at 10 kHz. Time-triggered measurements were collected from the rising edge of a prestimulus pulse, 20 ms before the current stimulus, for a period of at least 100 ms. Online and post-hoc averaging techniques were used to increase SNR of the electrical and polarization measurements.
RESULTS
The reflected cross-polarized optical responses were measured while using different stimulus intensities from 0.1 mA to 2.0 mA (Fig. 2). Both the optical and electrophysiological responses increased in size as the stimulus current was increased. We have previously shown that the lobster nerve is composed of at least three classes of axons that differ in diameter (Carter et al., 2004). Due to the relationship between the resistance-capacitance constant of the membrane and the axon diameter, the largest axons are recruited first, then the middle sized ones, and lastly the smallest axons. In Fig. 2, we see three components in the electrophysiological response corresponding to the activation of axons of different sizes. The first component was a fast oscillating signal or burst of spikes due to the activation of largest and fastest axons. Although we did not observe a fast oscillating optical response, there was a ramp-up and intermediate peak in the optical response corresponding to this phase of the electrophysiological response. The second and third components of neural activation represent the midsize and smallest axons. There were clear peaks in the optical waveform corresponding to these responses.
FIGURE 2.
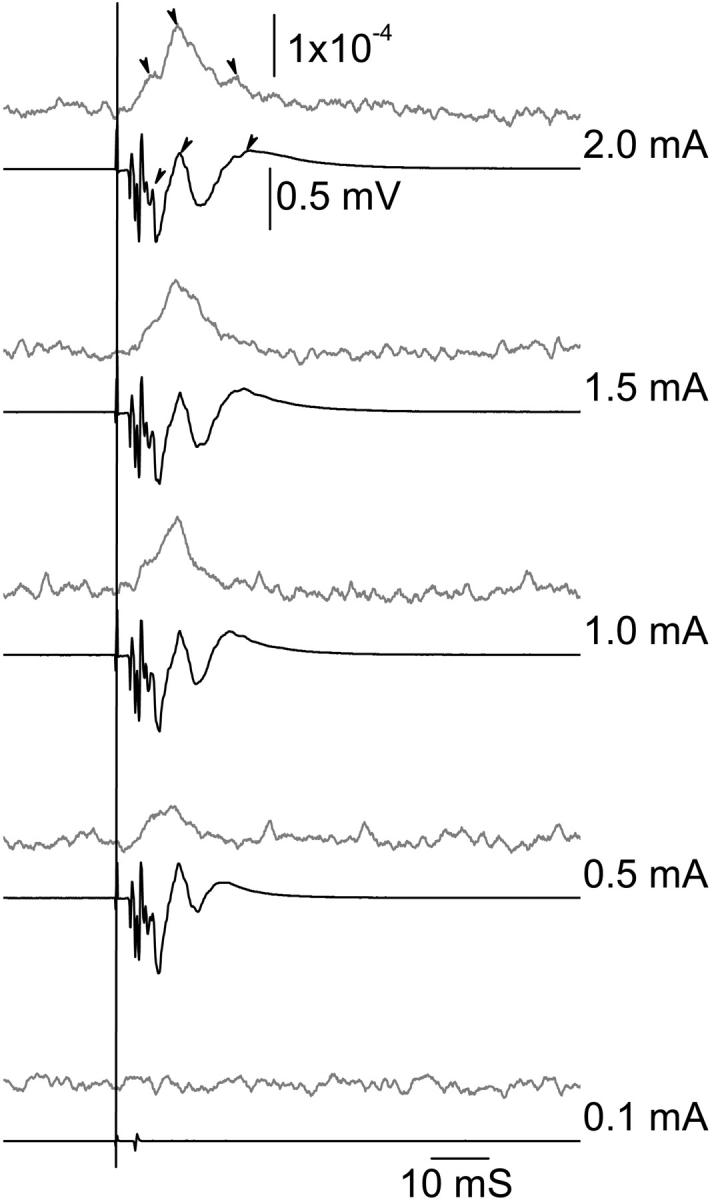
Size of the electrophysiological response (black trace) and corresponding reflected polarization change (shaded trace) increases with stimulus intensity (0.1–2.0 mA) showed coevolution of the response architecture in the two traces. Stimulus started at 0.1mA and increased to 2.0 mA. Traces from bottom to top were produced with increasing stimulus level. The arrowheads point to three major peaks in the electrophysiological response and their corresponding reflected cross-polarized optical response peaks. The vertical solid black line indicates the time of stimulation. Each trace contained 100 averages.
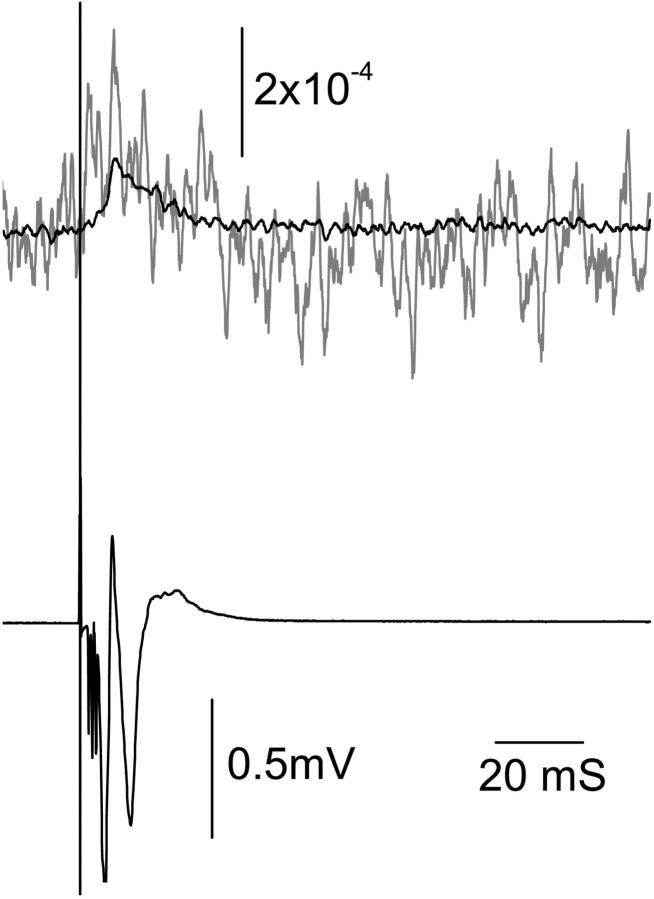
In these and other experiments, onset of the optical response appears to coincide with the start of the corresponding electrophysiological response. The optical waveform is similar in form to the integral of the electrical response: inflections in the optical signal correspond to peaks in the electrical response, and the optical peak often corresponds to a zero crossing in the electrophysiological signal. The recovery of the optical response is comparatively slow and may reflect the operation of mechanisms intended to restore the ionic balance of the cell. In this experiment, the optical measurement occurs closer to the stimulation site than the electrical response measurement, thus the initial “rising slope” of the optical response should occur earlier than the corresponding segment of the electrophysiological signal. This appears to be the case. The second and third optical peaks were slightly earlier than the corresponding major peaks of the electrophysiological response. With a strong stimulus intensity (∼2.5 mA), the reflected polarized light response could be measured in single trials with SNR of ∼1 (Fig. 3).
FIGURE 3.
Reflected polarized responses (top shaded trace) could be detected with a single trail. A measurement (top black trace) from 100 averages was also recorded for reference. The bottom black trace was the electrophysiological response. The vertical line indicates the time of stimulation.
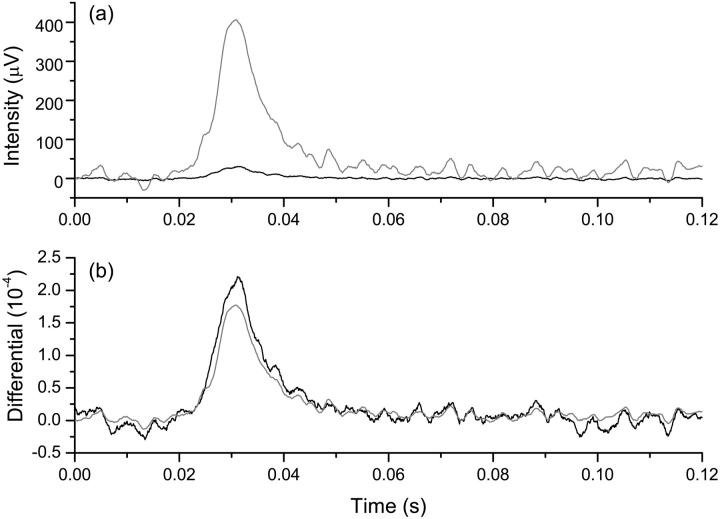
Reflected and transmitted polarization responses were recorded simultaneously to compare sensitivities of the methods (Fig. 4). In cross-polarized measurements, the baseline-reflected light intensity was about an order of magnitude smaller than the transmitted intensity, but the fast transient responses associated with neural activation had a similar SNR of ∼10 in averages of 100 responses in both measurement configurations.
FIGURE 4.
Polarized light intensity changes with reflected mode (black trace) and transmitted mode (shaded trace) were recorded simultaneously (a). Reflected and transmitted polarization changes were quantified as the ratio of the change in signal intensity to the baseline signal intensity, respectively (b). Each trace contained 100 averages, and intensity is expressed in microvolts of photodiode output.
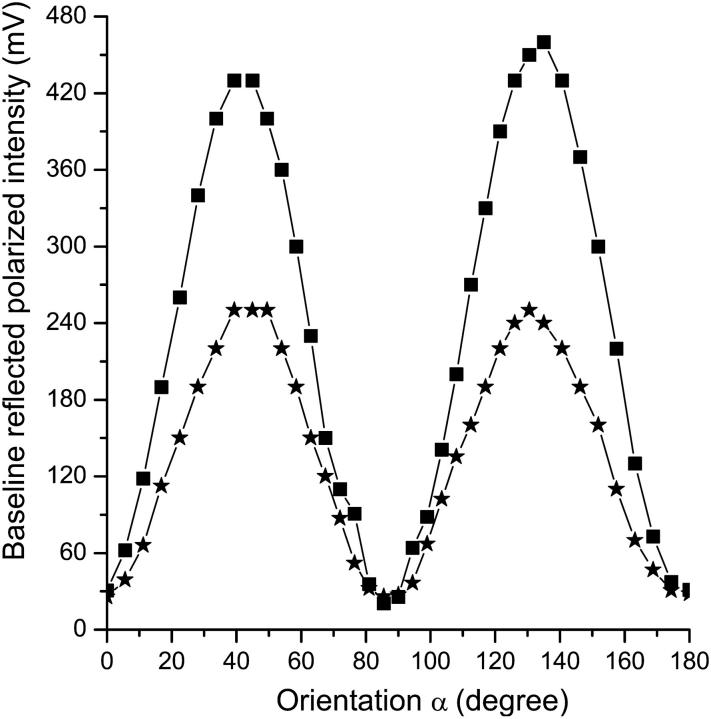
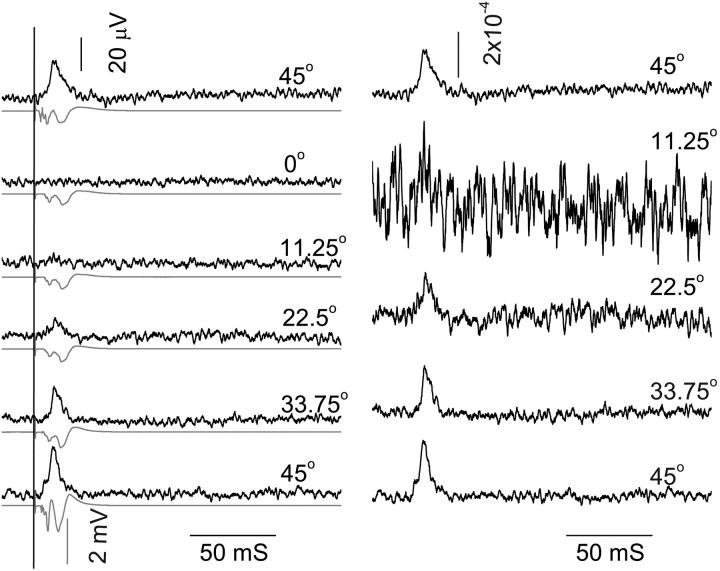
We characterized the dependence of the baseline-reflected cross-polarized light intensity (structural polarization signal) on the nerve orientation relative to light polarization direction (Fig. 5). The maximum structural polarization signal occurred at 45° (and 135°). The same angle also produced the largest transient polarization change (functional polarization signal, Fig. 6). Similar dependence of structural and functional cross-polarized scattering was also observed in transmitted light measurements, and previous authors have noted the maximum at 45° (Cohen et al., 1968).
FIGURE 5.
Baseline reflected polarized intensities (millivolt photodiode output) were measured at different orientations α when the long nerve fiber axis rotated relative to the incident light polarization direction. Square and star spots were from the first and third lobster nerves studied, respectively.
FIGURE 6.
In the left panel, the reflected polarized intensity changes (black traces) were measured corresponding to the electrophysiological responses (shaded traces) at different orientations when the long nerve axis was rotated relative to the light polarization direction. In the right panel, the birefringence changes were quantified as the ratio of the change in signal intensity to the structural polarized intensity. The structural intensity at 0° was taken as a baseline and subtracted from the structural polarized signals at different orientations from 11.25° to 45° to account for nonspecific scattering. The measurements were done chronologically from bottom to top in the figure. The stimulus was 2.5 mA. Each trace contained 100 averages.
Functional cross-polarized light responses measured chronologically are illustrated from bottom to top of Fig. 6. Signals decreased slightly over time from nerve degradation as observed in the electrophysiological signals; however, the first and last 45° optical responses had similar magnitude. Note that the ratio of the structural and functional cross-polarized light signals was approximately constant, although the normalized traces were noisier when the total measured light was smaller.
DISCUSSION
We have developed a polarization-sensitive optical probe to measure reflected polarization changes associated with neural activation. Although the fast optical response is tightly coupled to the electrophysiological response, there are differences in the observed dynamics. The first component of the electrophysiological response was a fast burst response. We did not see corresponding structure in the optical response, although an overall positive optical peak was observed. There are several possible reasons to explain the lack of high-frequency optical response in this experiment. First, the fastest and largest action potentials come from the largest axons, which appear to produce the smallest optical responses (Carter et al., 2004), either because they are less populous or perhaps because of the relationship between their diameter, the expected swelling response (VanHarreveld, 1958), and the corresponding polarization response. Later in this section, we discuss in detail the relationship between neuronal swelling and the optical polarization response. Second, since the recovery of the optical response is slow compared to the electrical signal, the electrical signal appears to have more temporal structure than the optical signal. Finally, the low sensitivity and SNR of the optical response relative to the electrophysiological measurement in our current system may limit the observation of small dynamic optical responses.
Reflected polarized light changes were seen in single trials with activated isolated lobster nerves, but useful measurements required averaging. SNR needs further improvement to approach the utility offered by dye-based imaging methodology. The reflected intensity was about an order of magnitude smaller than the transmitted intensity, but functional response SNR was similar. This presumably reflects a reduction of noise with the reduction of background light. The baseline structural intensities (Fig. 5) and functional polarization signals (Fig. 6) were dependent on the orientation of the radial axis of the lobster nerve. However, the ratio of functional intensity change to structural intensity was almost constant for a given stimulus intensity, ∼2.0 × 10⁻⁴, across different orientations. This suggests that the structural and functional signals might arise from a common mechanism.
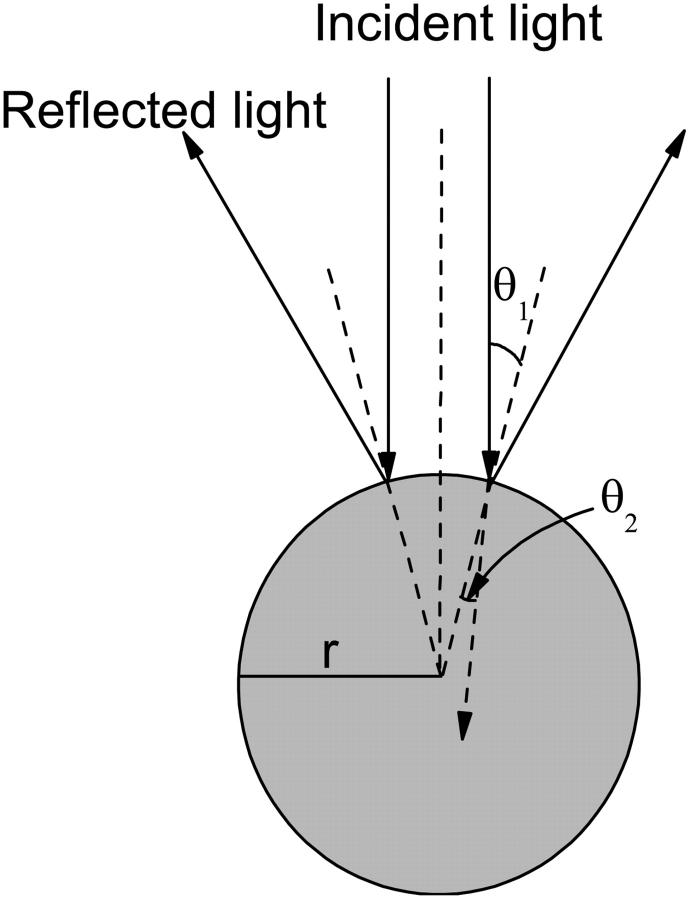
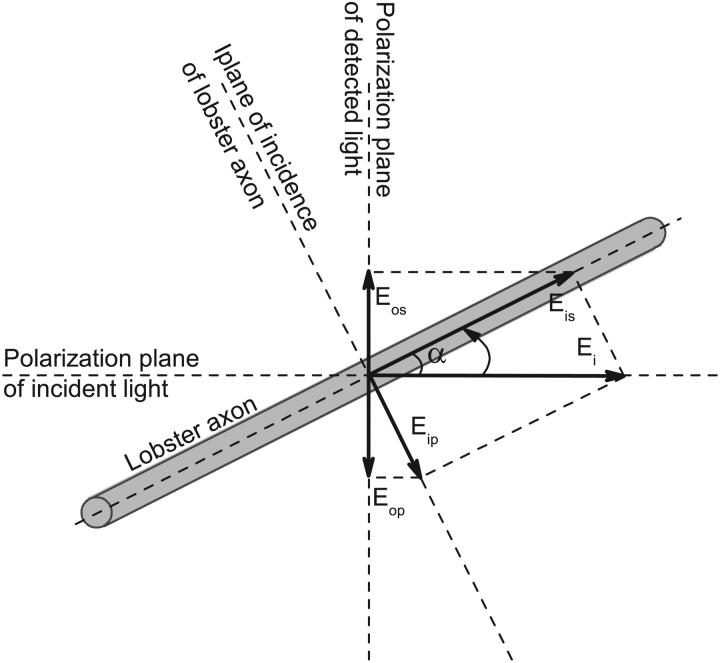
We hypothesize that the reflected polarized light signal of the lobster nerve is due in large part to light reflection from the axonal surfaces. The nerve axon fiber can be modeled as a dielectric cylinder of infinite length. Histological studies of these nerves show that the majority of the axons (several hundred) have diameters of ∼50 μm, with much smaller populations of axons (dozens) with diameters of 10 μm and 150 μm. Since the diameter of the lobster axons is larger than the wavelength of the incident light (∼793 nm), we used a theoretical model based on geometric optics to investigate the cross-polarized signals. A cross section of the cylinder model is illustrated in Fig. 7. The axon fiber is assumed to be illuminated by a linearly polarized uniform plane wave  where ω is the angular frequency of the incident light, t is the time, k is the wavenumber of the incident light, and z is the position of the nerve in the light propagation direction. In Fig. 8, the plane of incidence on the lobster axon is defined by the incident light vector and normal to the axon surface. If we assume the amplitude of the incident light to be
  then the amplitudes of Eis and Eip are
  and
and  respectively, where α is the orientation of the long axis of the nerve relative to the incident light. According to the Fresnel equations (Hecht, 2002), the reflected amplitudes Ers and Erp, due to Eis and Eip, respectively, can be formulated as
 |
(1) |
 |
(2) |
where  and
and  are the angles of incidence and transmission, respectively. In the direction perpendicular to the polarization plane of the incident light, the detected light amplitude Eo can be formulated as
 |
(3) |
The ratio of detected light intensity to incident light intensity can be formulated as
 |
(4) |
and the total reflected polarization signal is
 |
(5) |
where S is the sensitivity of the photodetector, I is the incident light intensity, L is the light-covered length of the lobster axon fiber, r is the radius of the axon fiber, and  is the differential of the angle of incidence.
  the individual reflection ratio with angle of incidence
  can be calculated with Eq. 4. During experiments, the maximum collecting angle
  of the detector was ∼20°, and therefore the maximum angle of incidence
  was 10°. For biological membranes, the refractive index is ∼1.48 (Beuthan et al., 1996), which we take as the refractive index of lobster axon membrane. Based on Eq. 5, the orientation dependence of the reflected signal was calculated numerically as shown in Fig. 9.
FIGURE 7.
Cross section of the theoretical cylinder mode of lobster nerve fiber. θ1 and θ2 are the angles of incidence and transmission, respectively, and r is the radius of the cross section.
FIGURE 8.
Incident light Ei can be decomposed into Eip and Eis, where Eip was parallel to and Eis was perpendicular to the plane of incidence of lobster axon. The detected light will be the sum of the vector projections Eop and Eos on the detected direction of the reflected scattering lights of the Eip and Eis.
FIGURE 9.
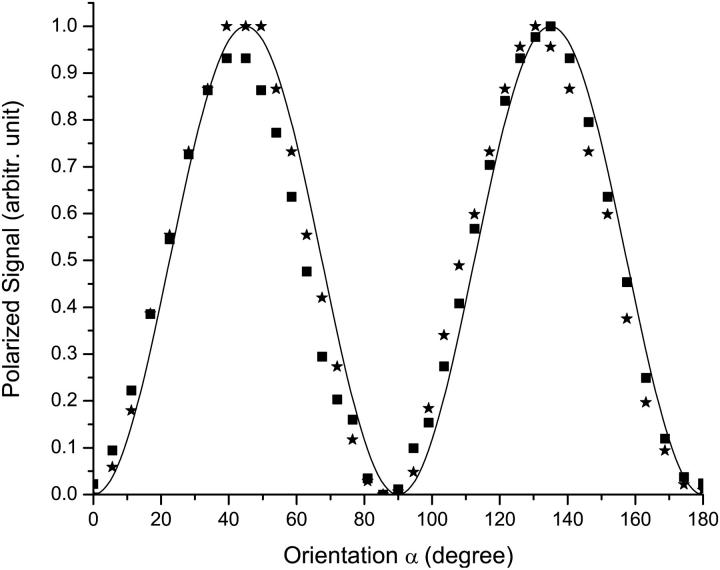
Minimum intensities were subtracted as baselines of the structural polarized signals from two different nerves (square and star spots) shown in Fig. 5, respectively. The maximum intensities were normalized to 1. The black solid trace shows our predictions from the model.
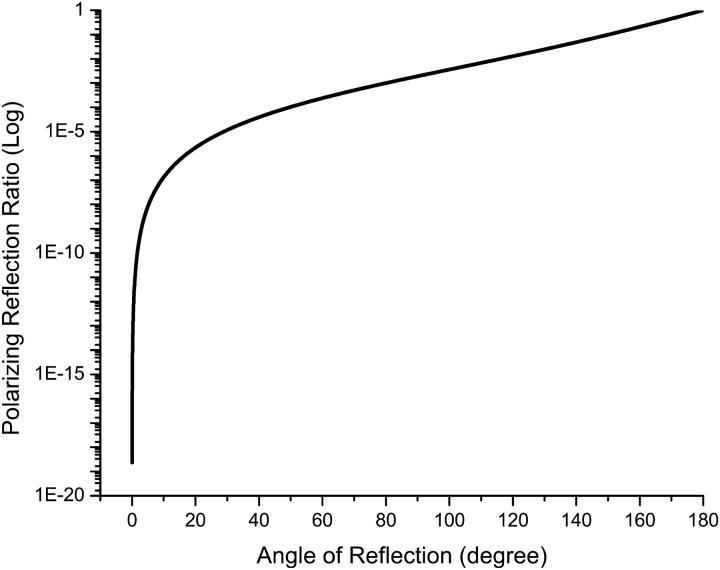
From Eq. 3, we see that the structural cross-polarized signal from an axon fiber depends on the orientation of the nerve relative to the plane of polarized light. To compare the theoretical and experimental results for angular dependence, signals such as those in Fig. 5 were normalized by subtracting the baseline at 0° and scaling the value at 45°. These normalized signals are in good agreement to model predictions that we compare in Fig. 9. Further, the magnitudes of both the structural and functional signals are dependent on the efficiency of light collection (Fig. 10). Maximal acceptance angle and optimal orientation of the detector relative to the incident light is important to obtain the largest output signal and improved SNR. We predict that a stronger signal can be achieved by collecting light at a 90° angle relative to the incident light, although this will require a different probe design. Note that a transmission geometry (angle of reflection = 180°) offers the greatest efficiency of collection, but such measurements are compromised by background transmitted light.
FIGURE 10.
Dependence of the reflected polarized light ratio and angle of reflection. The nerve is immersed in saline solution. The refractive index of axon membrane is assumed as 1.48. The orientation of nerve is 45°.
Previous publications have demonstrated that a fast transient swelling of lobster nerve is associated with neural activation (Yao et al., 2003) as reported for other nerves (Iwasa et al., 1980; Tasaki and Byrne, 1992; Akkin et al., 2004). From Eq. 5, we see that the reflected polarization signal should vary linearly with the dynamic functional change of the axon radius. Our experiments (Figs. 2–4 and 6) indicate that the functional polarization change is at the level of 1 × 10⁻⁴ (dI/I), where dI is the polarization change and I is the baseline structural polarization intensity. For an axon fiber with 10  radius, a 1 nm radius swelling change will produce 1 × 10⁻⁴ (dI/I) functional change. Our direct physical measurements on the isolated lobster nerve disclosed a fast transient swelling response on the order of 1 nm (Yao et al., 2003). However, given the complex geometry of the nerve fiber, and the probable shift of volume between the intracellular and extracellular spaces, we could not reliably estimate the swelling of individual axons.
This theoretical model accounts for the observation that the reflected structural polarization signals are dependent on the nerve orientation. Our analysis of the effect of axon radius on the structural polarization signal further suggests that the functional polarization responses may be related to the swelling response associated with neural activation. These predictions of the model agree well with the experimental results. Preliminary analysis suggests that simple extensions to our model should account for the cross-polarized structural and functional signals observed in transmitted light.
Based on our hypothesis that the structural and functional signals are due to the same underlying mechanism, we predicted their shared dependence on nerve orientation, which we subsequently observed. If the cross-polarized transient response was due to conformational changes in a macromolecule (such as an ion channel) or dissociation of a macromolecular complex, this orientation dependence would be surprising. With the notable exception of cytoskeletal components, most membrane proteins appear free to rotate in the plane of the membrane, and soluble proteins should be even less constrained.
Birefringence is often considered to be an atomic-level interaction between light and an anisotropic medium. Previous investigators (Cohen et al., 1968; Landowne, 1993; Tasaki et al., 1968) suggested that the cross-polarized optical responses associated with neural activation were birefringence changes, resulting from dynamic changes at the molecular level, e.g., reconfiguration of molecules. However, our analysis suggests that the cross-polarized responses might also result from transient microanatomical changes of nerve tissue during neural activation.
Previous investigators noted that the transmitted birefringence changes of activated crab nerves were much larger than those of squid giant axons (Tasaki et al., 1968; Cohen et al., 1968). Although transient molecular changes might produce birefringence changes (Landowne, 1985, 1993), the structural changes that occur during neural activation may dominate the total polarized light response. Crayfish, crab, and lobster nerves have similar structures, consisting of a bundle of axons with cylindrical shape. They also have similar transient transmitted polarized light responses during neural activation (Tasaki et al., 1968; Cohen et al., 1968; Carter et al., 2004). Because axonal tissue is soft, and gravity tends to pull the material down, the squid giant axon and cross sections of nerve bundles are elliptical in shape. However, individual small axons should keep their original shape within the bundle. Multiple reflection and scattering events inside axon bundles may increase the light polarization change and produce larger polarization signals.
Past investigation has suggested that smaller processes such as apical dendrites may have a relatively larger swelling change during neural activation than larger structures (VanHarreveld, 1958). Similarly, smaller diameter axons would be expected to have a proportionately larger swelling change than larger axons and thus might exhibit an enhanced transient polarization response. For the giant axon, the forward reflected light from the edge of the nerve was greater than from the middle of the nerve, which may explain why the edge of the axon had a larger polarization response (Cohen et al., 1968).
We are pursuing a more compact and sensitive optical fiber-based imaging probe to detect transient polarization changes from in vivo preparations. The neurites (axons and dendrites) in an in vivo preparation have more varied orientations than those in the lobster axon. Nevertheless, there is a predominance of rostral/caudal-oriented fibers in the cortex that might be exploited to optimize the signal. During neural activation, transient size changes in fibers could contribute to the reflected polarization functional change. In addition, phospholipids, vesicles, cytoskeletal structures, and other proteins are birefringent, and also contribute to cross-polarized responses associated with neural activation.
Although cross-polarized imaging techniques should produce a considerable improvement over results achieved with our previous scattering light imaging techniques, recent results suggest the possibility of additional improvement by optical configurations that reduce background light, including dark field techniques and confocal imaging. Continuing improvements in dynamic optical imaging of neural function may lead to revolutionary new techniques for clinical and basic research applications.
Acknowledgments
This work was funded by the National Institute of Mental Health (60263 to D.M.R.), a Beckman Foundation Young Investigator Award (D.M.R.), and the U.S. Department of Energy under the auspices of the Artificial Retina Program.
References
- Arshavsky, V. Y., T. D. Lamb, and E. N. Pugh. 2002. G proteins and phototransduction. Annu. Rev. Physiol. 64:153–187. [DOI] [PubMed] [Google Scholar]
- Akkin, T., D. P. Dave, T. J. Milner, and H. G. Rylanser. 2004. Detection of neural activation using phase-sensitive optical low-coherence reflectometry. Opt. Express. 12:2377–2386. [DOI] [PubMed] [Google Scholar]
- Beuthan, J., O. Minet, J. Helfmann, M. Herrig, and G. Muller. 1996. The spatial variation of the refractive index in biological cells. Phys. Med. Biol. 41:369–382. [DOI] [PubMed] [Google Scholar]
- Carter, K. M., J. S. George, and D. M. Rector. 2004. Simultaneous birefringence and scattered light measurements reveal anatomical features in isolated crustacean nerve. J. Neurosci. Methods. 35:9–16. [DOI] [PubMed] [Google Scholar]
- Chance, B., Q. Luo, S. Nioka, D. Alsop, and J. Detre. 1997. Optical investigations of physiology: a study of intrinsic and extrinsic biomedical contrast. Philos. Trans. R. Soc. Lond B. 352:707–716. [DOI] [PMC free article] [PubMed] [Google Scholar]
- Cohen, L. B., R. D. Keynes, and B. Hille. 1968. Light scattering and birefringence changes during nerve activation. Nature. 218:438–441. [DOI] [PubMed] [Google Scholar]
- Cohen, L. B., and R. D. Keynes. 1971. Changes in light scattering associated with the action potential in crab nerves. J. Physiol. 212:259–275. [DOI] [PMC free article] [PubMed] [Google Scholar]
- Cohen, L. B. 1973. Changes in neuron structure during action potential propagation and synaptic transmission. Physiol. Rev. 53:373–418. [DOI] [PubMed] [Google Scholar]
- Furusawa, K. 1929. The depolarization of crustacean nerve by stimulation or oxygen want. J. Physiol. 67:325–342. [DOI] [PMC free article] [PubMed] [Google Scholar]
- Grinvald, A. 1992. Optical imaging of architecture and function in the living brain sheds new light on cortical mechanisms underlying visual perception. Brain Topogr. 5:71–75. [DOI] [PubMed] [Google Scholar]
- Harary, H. H., J. E. Brown, and L. H. Pinto. 1978. Rapid light-induced changes in near infrared transmission of rods in Bufo marinus. Science. 202:1083–1085. [DOI] [PubMed] [Google Scholar]
- Hecht, E. 2002. Optics, 4th ed. Personal Education, Glenview, IL.
- Heekeren, H. R., M. Kohl, H. Obrig, R. Wenzel, W. Von Pannwitz, S. J. Matcher, U. Dirnagl, C. E. Cooper, and A. Villringer. 1999. Noninvasive assessment of changes in cytochrome-c oxidase oxidation in human subjects during visual stimulation. J. Cereb. Blood Flow Metab. 19:592–603. [DOI] [PubMed] [Google Scholar]
- Hoshi, Y., I. Oda, Y. Wada, Y. Ito, Y. Yutaka, M. Oda, K. Ohta, Y. Yamada, and T. Mamoru. 2000. Visuospatial imagery is a fruitful strategy for the digit span reflected task: a study with near-infrared optical tomography. Brain Res. Cogn. Brain Res. 3:339–342. [DOI] [PubMed] [Google Scholar]
- Iwasa, K., I. Tasaki, and R. C. Gibbons. 1980. Swelling of nerve fibers associated with action potentials. Science. 210:338–339. [DOI] [PubMed] [Google Scholar]
- Kuhn, H. 1980. Light- and GTP-regulated interaction of GTPase and other proteins with bovine photoreceptor membranes. Nature. 283:587–589. [DOI] [PubMed] [Google Scholar]
- Kuhn, H., N. Bennett, M. Michel-Villaz, and M. Chabre. 1981. Interactions between photoexcited rhodopsin and GTP-binding protein: kinetic and stoichiometric analyses from light-scattering changes. Proc. Natl. Acad. Sci. USA. 78:6873–6877. [DOI] [PMC free article] [PubMed] [Google Scholar]
- Landowne, D. 1985. Molecular motion underlying activation and inactivation of sodium channels in squid giant axons. J. Membr. Biol. 88:173–185. [DOI] [PubMed] [Google Scholar]
- Landowne, D. 1993. Measuring nerve excitation with polarized light. Jpn. J. Physiol. 43:S7–S11. [PubMed] [Google Scholar]
- Mann, G. 1894. Histological changes induced in sympathetic, motor, and sensory nerve cells by functional activation. J. Anat. Physiol. 29:100–108. [PMC free article] [PubMed] [Google Scholar]
- Oldenbourg, R., E. D. Salmon, and P. T. Tran. 1998. Birefringence of single and bundled microtubules. Biophys. J. 7:645–654. [DOI] [PMC free article] [PubMed] [Google Scholar]
- Pepperberg, D. R., M. Kahlert, A. Krause, and K. P. Hofmann. 1988. Photonic modulation of a highly sensitive, near-infrared light-scattering signal recorded from intact retinal photoreceptors. Proc. Natl. Acad. Sci. USA. 85:5531–5535. [DOI] [PMC free article] [PubMed] [Google Scholar]
- Rector, D. M., and J. S. George. 2001. Continuous image and electrophysiological recording with real-time processing and control. Methods. 25:151–163. [DOI] [PubMed] [Google Scholar]
- Rector, D. M., G. R. Poe, M. P. Kristensen, and R. M. Harper. 1997. Light scattering changes follow evoked potentials from hippocampal Schaeffer collateral stimulation. J. Neurophysiol. 78:1707–1713. [DOI] [PubMed] [Google Scholar]
- Rector, D. M., R. F. Rogers, and J. S. George. 1999. A focusing image probe for assessing neural activation in vivo. J. Neurosci. Methods. 91:135–145. [DOI] [PubMed] [Google Scholar]
- Rector, D. M., R. F. Rogers, J. S. Schwaber, R. M. Harper, and J. S. George. 2001. Scattered-light imaging in vivo tracks fast and slow processes of neurophysiological activation. Neuroimage. 14:977–994. [DOI] [PubMed] [Google Scholar]
- Tasaki, I., A. Watanabe, R. Sandlin, and L. Carnay. 1968. Changes in fluorescence, turbidity, and birefringence associated with nerve excitation. Proc. Natl. Acad. Sci. USA. 61:883–888. [DOI] [PMC free article] [PubMed] [Google Scholar]
- Salzberg, B. M., A. L. Obaid, and H. Gainer. 1985. Large and rapid changes in light scattering accompany secretion by nerve terminals in the mammalian neurohypophysis. J. Gen. Physiol. 86:395–411. [DOI] [PMC free article] [PubMed] [Google Scholar]
- Tasaki, I., and P. M. Byrne. 1992. Rapid structural changes in nerve fibers evoked by electrical current pulses. Biochem. Biophys. Res. Commun. 188:559–564. [DOI] [PubMed] [Google Scholar]
- VanHarreveld, A. 1958. Changes in the diameter of apical dendrites during spreading depression. Am. J. Physiol. 192:457–463. [DOI] [PubMed] [Google Scholar]
- Yao, X. C., D. M. Rector, and J. S. George. 2003. Optical lever recording of displacements from activated lobster nerve bundles and Nitella internodes. Appl. Opt. 42:2972–2978. [DOI] [PubMed] [Google Scholar]


