

Abstract
Transthyretin (TTR) is a protein linked to a number of different amyloid diseases including senile systemic amyloidosis and familial amyloidotic polyneuropathy. The transient nature of oligomeric intermediates of misfolded TTR that later mature into fibrillar aggregates makes them hard to study, and methods to study these species are sparse. In this work we explore a novel pathway for generation of prefibrillar aggregates of TTR, which provides important insight into TTR misfolding. Prefibrillar amyloidogenic oligomers and protofibrils of misfolded TTR were generated in vitro through induction of the molten globule type A-state from acid unfolded TTR through the addition of NaCl. The aggregation process produced fairly monodisperse oligomers (300–500 kD) within 2 h that matured after 20 h into larger spherical clusters (30–50 nm in diameter) and protofibrils as shown by transmission electron microscopy. Further maturation of the aggregates showed shrinkage of the spheres as the fibrils grew in length, suggesting a conformational change of the spheres into more rigid structures. The structural and physicochemical characteristics of the aggregates were investigated using fluorescence, circular dichroism, chemical cross-linking, and transmission electron microscopy. The fluorescent dyes 1-anilinonaphthalene-8-sulfonate (ANS), 4-4-bis-1-phenylamino-8-naphthalene sulfonate (Bis-ANS), 4-(dicyanovinyl)-julolidine (DCVJ), and thioflavin T (ThT) were employed in both static and kinetic assays to characterize these oligomeric and protofibrillar states using both steady-state and time-resolved fluorescence techniques. DCVJ, a molecular rotor, was employed for the first time for studies of an amyloidogenic process and is shown useful for detection of the early steps of the oligomerization process. DCVJ bound to the early prefibrillar oligomers (300–500 kD) with an apparent dissociation constant of 1.6 μM, which was slightly better than for ThT (6.8 μM). Time-resolved fluorescence anisotropy decay of ANS was shown to be a useful tool for giving further structural and kinetic information of the oligomeric aggregates. ThT dramatically increases its fluorescence quantum yield when bound to amyloid fibrils; however, the mechanism behind this property is unknown. Data from this work suggest that unbound ThT is also intrinsically quenched and functions similarly to a molecular rotor, which in combination with its environmental dependence provides a blue shift to the characteristic 482 nm wavelength when bound to amyloid fibrils.
INTRODUCTION
Many diseases are caused by protein misfolding. These include loss-of-function diseases such as cystic fibrosis, hemophilia, and cancer. Other diseases are caused by a gain-of-toxic-function mechanism often including aggregation of misfolded proteins. These diseases include the amyloidoses such as Alzheimer's disease and familial amyloidotic polyneuropathy (FAP). In the case of the prion diseases, there is a debate whether these are gain-of-toxic-function or loss-of-function diseases. It is however known that the infective species include assembled prion protein (PrP) oligomers in an aberrant folded state called PrPSC. In the classic amyloidoses, accumulation of extracellular fibrillar aggregates called amyloid has been detected in various tissues depending on disease (Buxbaum, 2003). In the past few years it has become evident that the mature fibrils are fairly inert and that prefibrillar assemblies are the most cytotoxic species both for Aβ (Lambert et al., 1998) and for transthyretin (TTR) (Sousa et al., 2001). Therefore oligomers of misfolded proteins appear to be yet another common denominator in the amyloidoses in addition to the generic fibrillar structure. Such prefibrillar oligomers could also serve as a common intermediate between the amyloidoses and other misfolding diseases, including prion diseases, Parkinson's disease, and amytrophic lateral sclerosis. Interestingly, amyloid deposits can also be found in prion diseases, suggesting a common link between these diseases. Furthermore, PrPSC particles share many of the features of the toxic small prefibrillar species found in amyloid diseases.
TTR is a homotetrameric transport protein circulating in the plasma and cerebrospinal fluid. TTR has been linked to a number of different amyloid diseases, including familial and sporadic ailments (Kelly, 1996). In FAP, mutants of TTR misfold and form amyloid deposits in peripheral nerves, causing peripheral neuropathy. TTR is also associated with the sporadic disease senile systemic amyloidosis (Westermark et al., 1990). SSA manifests itself through initial deposition of wild-type TTR amyloid fibrils in the heart. There are no effective treatments for TTR amyloid diseases except for liver transplantation, which is only effective for heritable amyloidoses such as FAP. For liver transplantation to be effective, early diagnosis is critical for FAP because nerve regeneration is limited. Early diagnosis of amyloid disease is extremely difficult. It is of critical importance to possess markers for patients predisposed to FAP to enable early diagnosis. Future treatments, such as small molecule chemotherapy, are viable strategies, and early diagnosis to enable initiation of this therapy at an early stage is vital.
The complex properties of protein aggregation and amyloid formation require development of sophisticated although simple techniques which can provide detection as well as direct output of structural changes of protein assemblies, e.g., upon various therapeutic treatments. Fluorescence spectroscopy provides a very attractive alternative for such studies, due to sensitivity, ease of use, and flexibility. In this work we describe the characteristics of prefibrillar and protofibrillar assemblies of TTR and present a platform for spectroscopic characterization of these species. This was possible due to the exploration of a novel pathway of TTR aggregation from the molten globule A-state, affording soluble assemblies of misfolded protein molecules. Previous work by us and others have employed protein engineering and cysteine labeling to attach specific probes to proteins to record conformational changes (Hammarström et al., 1997, 1999, 2001a,b; Svensson et al., 1995). To enable conformational characterization of protein isolated from biological specimens such as samples from patients, noncovalent recognition using extrinsic dyes is necessary. Some extrinsic dyes that by molecular recognition bind to conformational substrates such as native, misfolded monomers and/or aggregates of TTR have been investigated in this work. We envision the use of these probes and other probes with similar properties and the application of some of the techniques described within to serve as useful tools for future scientific studies, diagnosis, and high throughput screening of misfolding inhibitors.
EXPERIMENTAL PROCEDURES
Protein purification
TTR was expressed in BL21/DE3 cells transformed with the pmmHa plasmid. Purification was performed as described previously (Lashuel et al., 1999).
Generation of soluble prefibrillar aggregates of TTR
TTR was dialyzed versus 10 mM HCl in dH2O (pH 2.0) at 4°C for 96 h. This produces unfolded monomeric TTR. Aggregation of acid unfolded TTR (23°C, 14 μM monomer concentration) was induced by addition of 25 μl 4 M NaCl to a 1000 μl sample, giving a final NaCl concentration of 100 mM.
Circular dichroism
Far ultraviolet circular dichroism (UV CD) spectra were recorded using a Jobin Yvon (Longjumeau, France) circular dichroism spectropolarimeter in the range 190–260 nm. Samples were made containing 0.20 mg/ml (14 μM monomer) TTR in native (10 mM phosphate, pH 7.5), monomeric unfolded (pH 2.0 no salt), and soluble misfolded oligomeric state (pH 2.0, 100 mM NaCl). Initiation of oligomerization was performed through addition of 100 mM NaCl from a 4 M stock solution to 0.20 mg/ml unfolded TTR at pH 2.0 (no salt).
Chemical cross-linking
A total of 100 μl of aliquots from a TTR misfolding reaction was withdrawn at different time points, and 100 mM phosphate buffer was added in addition to 10 μl of glutaraldehyde (25%, electron microscopy grade (Sigma, St. Louis, MO)). Cross-linking was allowed to proceed for 120 s before quenching by addition of 10 μl of 7% NaBH4 in 0.1 M NaOH. A total of 25 μl 6 × SDS sample buffer (final SDS concentration of 2.5%) was added, and the samples were boiled for 5 min before loading the SDS-PAGE gel. The protein bands were visualized through Coomassie R-250 staining. The densiometry of the bands were analyzed using the program Image J, version 1.32j, available at http://rsb.info.nih.gov/ij/.
Transmission electron microscopy
Five microliter aliquots from a TTR misfolding reaction were withdrawn at different time points and were placed on a carbon coated copper grid for 2 min. The remaining drop was blotted dry using a filter paper. One round of water rinsing was performed applying 5 μl water. The sample was thereafter stained using 2% uranyl acetate for 20 s, and the grids were dried overnight. A Philips CM200 transmission electron microscope operating at 120 kV was used for obtaining micrographs at 100,000-fold × magnification.
Steady-state fluorescence
Continuous wave steady-state fluorescence spectra were recorded using a Hitachi F-4500 spectroflurometer equipped with a Xe-lamp and a thermostatic cell holder.
Fluorescence spectra were obtained from samples in quartz cuvettes with 10 mm or 4 mm pathlengths. Samples containing 1-anilinonaphthalene-8-sulfonate (ANS) and Bis-ANS were excited at 290 nm, 370 nm, and 403 nm. DCVJ was excited at 470 nm and ThT at 440 nm.
Samples with fluorophore concentrations of 5 μM were made in different concentrations of glycerol (0%–82.5%) to establish viscosity effects on ThT and DCVJ fluorescence properties. The samples were buffered with 50 mM Tris HCl (pH 7.5) or 40 mM Na-acetate (pH 3.0) or 25 mM HCl (pH 1.6).
Aggregation kinetics
Time course changes accompanying TTR misfolding and aggregation were performed by sampling aliquots of a TTR misfolding reaction at different time points. The aggregation reaction of monomeric acid unfolded TTR (14 μM) was initiated by addition of 25 μl 4 M NaCl to a 1000 μl sample, giving a final NaCl concentration of 100 mM (23°C). Aliquots of the aggregation reaction were withdrawn and mixed with an assay buffer (10 mM HCl, containing a final concentration of ANS, Bis-ANS, or DCVJ at 2.0 μM), giving 2.0 μM final TTR concentration (on a monomer basis). The fluorescence intensity was registered by integration of the spectra to avoid adverse effects by spectral shifts. The integrated spectra were corrected by the fluorescence of each probe in the absence of protein and normalized to the recorded maximum intensity of each probe during the misfolding reaction.
Time-resolved fluorescence
Time-resolved measurements of tryptophan (Trp) fluorescence were recorded using an IBH (Glasgow, UK) 5000 U fluorescence lifetime spectrometer system with 1 nm resolved excitation and emission monochromators (5000 M). The system was equipped with a TBX-04D picosecond photon detection module with IBH laser diodes operating at 403 and 443 nm giving 150 ps pulses, as well as an IBH NanoLED operating at 373 nm giving 1.5 ns pulses, for time-resolved measurements of fluorescence decay and anisotropy. The lifetime decays were measured using time-correlated single photon counting along with the Data Station, v 2.1, software for running the spectrometer and deconvolution and analysis of decays. The date acquisition card settings were chosen to give a time resolution 10–100 ps depending on the decay time of the fluorescent probe in question. The measured decays were fit to exponential decays of two or three components depending on the complexity of the decay trace. No model based on protein conformation distribution was used to analyze or interpret these results in more detail; however, such decay times and relative amplitude to the overall fluorescence decay are useful parameters when comparing samples of different chemical history or taken as well as in interpreting relative contributions to steady-state fluorescence data.
The time-resolved anisotropy decays were determined from the difference of the parallel (VV) and crossed (VH) polarization (V = vertical; H = horizontal) decays normalized over the overall polarized intensity distribution according to the well-known expression
 |
(1) |
where G is an apparatus constant taking into account polarization sensitivity of the detection system which can be measured from the decays of HH and HV (see, e.g., Lakowicz, 1999).
In the experiments with samples with aggregated proteins, the monomeric form was mixed with a small contribution from considerably larger particles (giving essentially a baseline), making a detailed analysis difficult. Aggregates are expected to have rotational correlation times considerably longer than the decay time of the used dyes (e.g., ANS, 16 ns). In practice, the large difference in anisotropy decay between monomeric forms lead to a broad baseline with the contribution of the smaller monomeric forms contributing as a decay curve superimposed onto a baseline.
RESULTS AND DISCUSSION
Characterization of soluble prefibrillar aggregates and protofibrils
Generation of prefibrillar oligomers of TTR from the A-state
Prolonged dialysis of TTR (96 h, 4°C) versus 10 mM HCl in dH2O in the absence of salt (pH 2.0) will dissociate TTR into unfolded monomers (Lai et al., 1996). Far-UV CD spectra show that TTR under these conditions has close to a random coil conformation with a featureless spectrum and a minimum at 200 nm (Fig. 1). The Trp fluorescence of acid unfolded TTR peaks at 352 nm (data not shown) compared to 340 nm in the native protein, indicating unfolding. Addition of 100 mM NaCl to the acid unfolded TTR monomers will immediately shield the positive charges and initiate a conformational change into a so-called A-state (Lai et al., 1996). The A-state is of molten globule type and shows a dramatic increase in β-sheet content evident from a spectral peak at 213 nm (Fig. 1). Interestingly, the β-sheet content is higher in the A-state than in native TTR, although some loss of contribution from aromatic residues such as Trp also could influence the intensity of the far-UV CD signal (Freskgård et al., 1994). The A-state also shows an increase in β-sheet structure over time in a slow process suggestive of structure formation during self-assembly. Notably, this solution is completely transparent compared to when native TTR is incubated under more mild conditions such as pH 4.4 or in water-methanol mixtures at pH 7.0, which over time will result in massive precipitation of large aggregates including amyloid fibrils (Hammarström et al., 2002; Hurshman et al., 2004; Lai et al., 1996). To probe the presence of aggregates, we employed chemical cross-linking using glutaraldehyde. This approach requires that the pH be raised to 7.5 in the chemical cross-linking solution. The data presented in Fig. 2 show an increase of soluble aggregates over time, and after 1–2 h of incubation only soluble aggregates of molecular weights in the range 300–500 kD are visible. The tetrameric band at 55 kD originates from the amount of unfolded monomers that have not yet been misfolded/misassembled and can refold instead of forming aggregates during the pH jump (from pH 2 to pH 7.5), which is necessary for the glutaraldehyde reaction. Cross-linking of samples after incubation times >2 h showed a protein band that was unable to enter the gel, indicating formation of very large aggregates >1000 kD (data not shown).
FIGURE 1.

Far-UV CD spectra of native, unfolded, and aggregated misfolded A-state TTR into soluble aggregates over time. All spectra are recorded from 14 μM (monomer concentration) TTR samples. Color code: Native tetrameric TTR 10 mM phosphate buffer (pH 7.5; blue). Acid unfolded monomeric TTR, 10 mM HCl (pH 2.0; red). Oligomeric aggregated and protofibrillar TTR generated from acid unfolded TTR incubated for various times in A-state conditions 10 mM HCl, 100 mM NaCl (pH 2.0) after 30 min (black), 70 min (green), and 48 h (magenta).
FIGURE 2.

Formation of soluble oligomeric aggregates over time from incubation of acid unfolded TTR under A-state conditions. Chemical cross-linking using glutaraldehyde of soluble aggregates (14 μM monomer concentration) was analyzed by SDS-PAGE, and the gel is shown in the upper part of the figure. The arrow indicates the ∼300–500 kD oligomeric band that increases in abundance over time. A relative quantitative densiometric analysis is shown in the lower part of the figure, where the most dense oligomer band was set to 100%.
Size and morphology of special aggregates and protofibrils
Aliquots from a TTR aggregation reaction solution taken after 30 min, 2 h, 24 h, and 430 h were investigated using transmission electron microscopy (Fig. 3). After 2 h, only very small aggregates (<10 nm length and <5 nm wide) were visible, whereas after 24 h, 20–80 nm long and 3–8 nm wide protofibrils were visible. Furthermore, spherical clusters of protein with a fairly monodisperse diameter of 30–50 nm are also clearly visible at this time point. After prolonged incubation (>400 h), the protofibrils have increased in length to 100–200 nm, and the spherical clusters have decreased in size to 20–30 nm in diameter (Fig. 3).
FIGURE 3.

Transmission electron microscopy micrographs of TTR aggregates. The aggregates were generated after incubation of acid unfolded TTR under A-state conditions for 2 h, 24 h, and 430 h (14 μM monomer concentration). The scale bar indicates 100 nm. All micrographs are taken at 100,000 × magnification.
A schematic representation of the TTR misfolding reaction from the unfolded state through the A-state is presented in Fig. 4 A.
FIGURE 4.
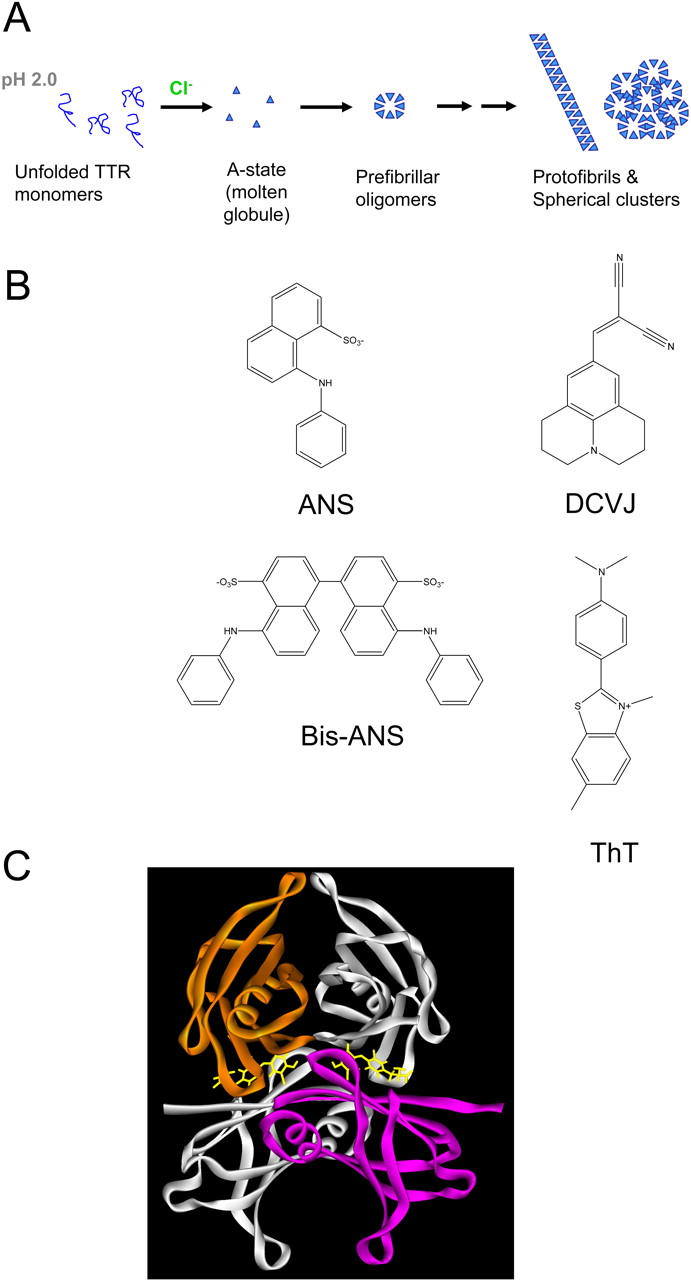
Molecules and processes in the study. (A) Schematic representation of the misfolding and aggregation reaction in the study. From left to right, acid unfolded TTR monomers from which the A-state was induced by addition of NaCl. The A-state forms oligomers which mature into large spherical clusters and protofibrils. (B) Structure of the different fluorescence probes used in the study. ANS and Bis-ANS binds to both native and misfolded TTR, ThT and DCVJ binds specifically to misfolded and aggregated TTR. (C) The native TTR tetramer structure with small molecule binding site indicated in yellow at the dimer-dimer interface. The Protein Data Bank file 1THA was used to generate the structure showing the bound small molecule metabolite 3, 3, diiodo-l-thyronine (Wojtczak et al., 1992).
Fluorescence characterization of different protein conformers
The A-state of TTR binds the classic hydrophobic dye ANS (Lai et al., 1996; Figs. 5 B and 6). It was shown in a seminal article by Semisotnov and co-workers that a blue shifted ANS fluorescence spectrum and a strongly increased quantum yield is diagnostic of binding to a molten-globulelike state with exposed hydrophobic patches (Semisotnov et al., 1991). It is, however, not well reported that ANS also binds to aggregated protein molecules. To enable characterization of different conformational states of TTR, we employed four different molecular probes: ANS, 4-4-bis-1-phenylamino-8-naphthalene sulfonate (Bis-ANS), 4-(dicyanovinyl)-julolidine (DCVJ), and thioflavin T (ThT) (Fig. 4 B). The fluorescence from ANS and Bis-ANS fluorophores show strict environmental dependence and are essentially nonfluorescent in water but are highly fluorescent in hydrophobic environments. The probe DCVJ is a molecular rotor containing a fluorescent julolidine moiety and an intrinsic di-cyano quencher. These properties make the intramolecular rotational relaxation solvent dependent for DCVJ. Decreased free rotation of the quenching cyanide groups will result in increased quantum yield. We employed the DCVJ probe to investigate its potential use for recognition of misfolded aggregates formed from TTR. DCVJ is intrinsically quenched and belongs to a class of fluorescent probes known as molecular rotors. Such molecular systems were first developed for the characterization of free-volume concepts in polymers because of their unique sensitivity to torsional rigidity of the surrounding medium (Loutfy, 1986). DCVJ has not to our knowledge been used before on an amyloid system but has been employed on microtubule polymerization (Haidekker et al., 2000, 2001; Kung and Reed, 1989) and in studies of the G-F transformation of actin (Sawada et al., 1992). Mouse monoclonal antibodies for DCVJ have been generated showing strong sensitivity (Iwaki et al., 1993). We also employed the classic and widely used, although poorly understood, amyloid fluorescence dye ThT, which is known to interact with amyloid fibrils (Naiki et al., 1989) including TTR (Hammarström et al., 2001c; Lashuel et al., 1999) and Alzheimer's β-amyloid peptides (LeVine, 1993). This was used as a reference as well as to extract novel information about the properties of DCVJ and ThT through this comparison (more below).
FIGURE 5.
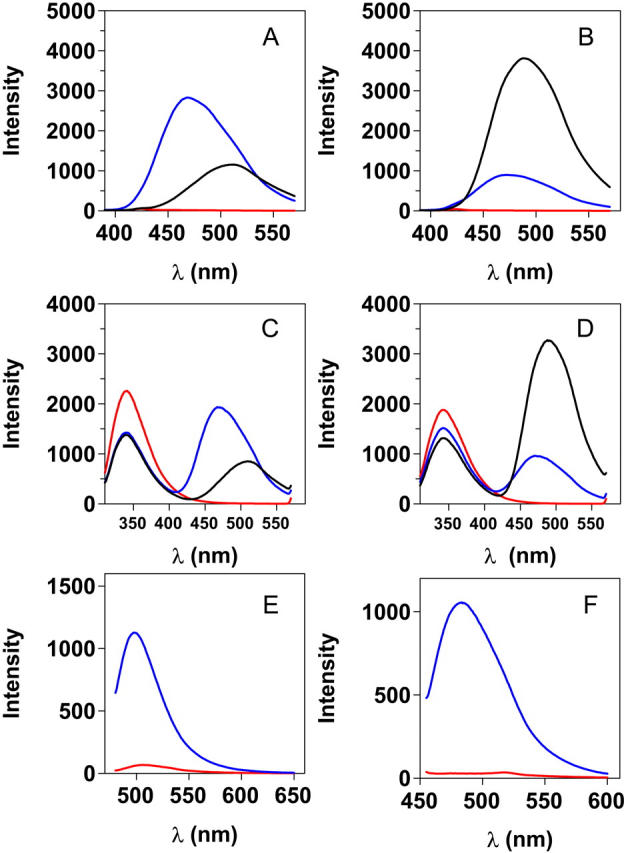
Fluorescence spectra of the different probes binding to native and misfolded aggregated TTR. Aggregates were generated from A-state incubation at 14 μM monomer concentration. (A) Native TTR binding, direct excitation (370 nm) of ANS (blue) and Bis-ANS (black; 2 μM probe + 2 μM TTR tetramer). The red curve shows TTR in the absence of probe. (B) ANS and Bis-ANS fluorescence, after direct excitation (370 nm), bound to protofibrillar and spherical aggregates of TTR (2 μM probe + 2 μM TTR monomer concentration; A-state incubation for 24 h). Same color code as in A. (C) Emission spectra after Trp excitation at 290 nm of native TTR. Same color code as in A. (D) Emission spectra after Trp excitation at 290 nm of protofibrillar and spherical aggregates of TTR. Same color code as in A. (E) DCVJ spectra in the presence of native TTR (red) and misfolded oligomers of TTR (A-state incubation for 2 h; blue; 5 μM DCVJ + 5 μM TTR monomer concentration). (F) ThT spectra in the presence of native TTR (red) and misfolded oligomers of TTR (A-state incubation for 2 h; blue; 5 μM ThT + 5 μM TTR monomer concentration).
FIGURE 6.

Kinetics of TTR misfolding and aggregation followed by different fluorescent probes. Aliquots of the aggregation reaction (A-state incubation at 14 μM monomer concentration) was withdrawn and assayed at 2 μM probe + 2 μM TTR. The corrected and integrated fluorescence spectra from the different probes were normalized by the maximum intensity for each probe. Symbols: ANS (red circles), Bis-ANS (green triangles), DCVJ (blue triangles), and ThT (black squares). The fluorescence intensity of the different probes in the presence of the unfolded monomer state and the burst amplitude from the fit is indicated with horizontal lines labeled with the letter U and “burst” in colors corresponding to the probe. The kinetic trace over the initial 6 h is shown in the main figure, the complete kinetic trace (>300 h) is shown in the inset, and the rate parameters are summarized in Table 1.
ANS, Bis-ANS, DCVJ, and ThT fluorescence as probes of different TTR conformers
Fluorescence spectra of the different molecular dyes in the presence of native and misfolded aggregated states of TTR are displayed in Fig. 5. Native tetrameric TTR can serve as a reference state to which some, but not all, fluorescence probes used in this study can bind. Native tetrameric TTR possesses two symmetric thyroxine binding cavities at the subunit interface (Fig. 4 C). These cavities can bind other small molecules including ANS (Lai et al., 1996; Nilsson et al., 1975). The spectra obtained upon direct excitation of ANS and Bis-ANS are shown in Fig. 5, A and B, respectively. A dramatic increase in the fluorescence quantum yield and a concomitant blue shift of the ANS and Bis-ANS fluorescence is evident upon binding to native TTR (Fig. 5 A). The quantum yield of bound ANS is much higher than that for Bis-ANS, and the blue shift is more evident. This indicates that the Bis-ANS molecule is too big to completely fit in the thyroxine binding cavity and likely there is only room for one-half of the symmetric molecule. In comparison, the misfolded aggregated states from A-state TTR show a much stronger quantum yield for Bis-ANS than for ANS (Fig. 5 B). The spectra obtained upon Trp excitation (290 nm) are shown in Fig. 5, C and D. The quenched Trp fluorescence in the presence of ANS and Bis-ANS (Fig. 5, C and D) and shorter fluorescence lifetimes (data not shown) reveal Trp to ANS and Bis-ANS fluorescence resonance energy transfer both in the native and misfolded states, indicating that the Trps and the probes are in close proximity (Conrad and Brand, 1968).
Despite the fact that native TTR is known to bind to hydrophobic molecules, DCVJ and ThT bind poorly to the native state (Fig. 5, E and F). In contrast, addition of DCVJ and ThT to misfolded aggregates generated from A-state TTR results in a dramatic increase in the quantum yield of the different probes (Fig. 5, E and F). The evident binding of these four different dyes to misfolded conformations of TTR indicates their potential use as tools for following the misfolding and aggregation process.
Misfolding and aggregation kinetics monitored by ANS, Bis-ANS, DCVJ, and ThT
Time course changes accompanying TTR misfolding and aggregation were recorded to elucidate preferential fluorescence signals of the probes depending on the conformational state of the protein. This analysis can potentially allow us to discriminate between A-state monomers, protein oligomers, and larger aggregates. Before initiation of the aggregation reaction, TTR is in the form of unfolded monomers. The fluorescence intensity of the different probes in the presence of the unfolded monomer state is shown in Fig. 6 as a horizontal line indicated with the letter “U” in different colors corresponding to the probe. The fluorescence of ANS in the presence of unfolded TTR is minor and is completely silent for ThT. Although the blank fluorescence for DCVJ is low, DCVJ in the presence of unfolded TTR shows even lower fluorescence than the blank, which could indicate a small quenching effect through binding. For Bis-ANS, the fluorescence in the presence of unfolded TTR is significant.
The aggregation reaction was initiated through a pulse of NaCl which induces the molten-globulelike A-state which subsequently assembles into aggregates. Aliquots of the aggregation reaction was withdrawn and assayed to avoid adverse effects of probe binding during the reaction. The reaction was followed for >300 h. The complete kinetic trace is shown in the inset in Fig. 6. The misfolding and aggregation reaction as monitored by chemical cross-linking (Fig. 2) and transmission electron microscopy (Fig. 3) identifies the various species populated at different time points. Although the misfolding and aggregation reaction is very complex and of multiple order, all kinetic traces could be fitted to a double exponential function which enabled comparison of kinetic parameters. From the fit it was obvious for all probes that there were burst phase responses going from the signal from the monomeric unfolded state (U) to the A-state. The complete reaction can, for simplicity, be divided into four phases, which are schematically depicted in Fig. 4 A: 1), burst phase (0–0.5 min): generation of the A-state monomer; 2), first aggregation phase (0.5–30 min): formation of soluble oligomers; 3), second aggregation phase (30 min–20 h): generation of larger aggregates including spherical aggregates and short protofibrils; and 4), maturation phase (>20 h): generation of more extended fibrils. This late phase is concomitant with the spheres shrinking in size, suggesting a conformational change of the spheres into more fibrillar structures.
Importantly, all probes show different kinetics, with varying amplitudes and rates during the reaction (Table 1). Three probes—ANS, DCVJ, and ThT—show increased fluorescence throughout the aggregation reaction, whereas Bis-ANS shows fluorescence decay (Fig. 6). Bis-ANS shows very strong fluorescence in response to all conformational states of TTR, with the strongest signal emanating from the rapidly formed monomeric A-state upon NaCl addition. Fluorescence anisotropy data from Bis-ANS bound to the different unfolded and aggregated states showed modest anisotropy values (compared to when bound to the thyroxine binding site in the native TTR tetramer), revealing that Bis-ANS does not penetrate the protein but is more loosely associated to the protein surface (data not shown).
TABLE 1.
Kinetic parameters of different fluorescent probes during TTR misfolding and aggregation
| Kinetic half times and amplitudes* | ANS | Bis-ANS | DCVJ | ThT |
|---|---|---|---|---|
| OffsetU† | 0.23 | 0.69 | −0.07 | 0.02 |
| AmpBurst | 0.18 | 0.40 | 0.31 | 0.06 |
| 1/2TI (min) | 37 | 0.9 | 8.4 | 19.4 |
| AmpI | 0.43 | −0.31 | 0.47 | 0.49 |
| 1/2TII (min) | 1042 | 264 | 171 | 529 |
| AmpII | 0.07 | −0.06 | 0.22 | 0.35 |
Traces were fitted to a double exponential function defining two phases (I and II) and a burst phase from the inadequate extrapolation to time = 0. The kinetic half times are defined by 1/2T for the two phases. The amplitudes (Amp) were normalized to 1.0 for the maximum intensity samples recorded for the U, A-state, and aggregates. ANS, DCVJ, and ThT ended at relative amplitude levels of 0.92 ± 0.01 and Bis-ANS at 0.71.
The initial amplitude of the U-state is defined as offsetU.
The three probes which show increased fluorescence in correlation to the TTR misfolding reaction reveal a fluorescence signal during binding to different species. ANS and DCVJ show significant fluorescence after 1 min. The ANS and DCVJ fluorescence thereafter increase over time as oligomers and protofibrils form and reach a plateau after a few hours. Comparing the amplitudes and rates of the different probes (Fig. 6 and Table 1) shows:
DCVJ responds to early species, i.e., the formation of the A-state and the formation of misfolded oligomeric aggregates. It should be noted that DCVJ reaches the plateau level faster than ThT and ANS, indicating a strong preference for oligomeric aggregates. The plateau level is preserved for DCVJ over 300 h, showing that this probe also binds to larger assemblies (spherical aggregates and protofibrils).
ANS shows a significant burst amplitude (A-state formation) followed by a slow phase in response to oligomeric aggregates. In addition ANS shows a minor slow second phase in response to formation of larger assemblies (spherical aggregates and protofibrils).
ThT does not show binding to the U-state and only shows a minor burst phase, indicating that this is a clear-cut aggregation probe. ThT binds to oligomers and shows large amplitude in the slow second phase in response to formation of spherical aggregates and protofibrils, well in accordance with its reported amyloid specificity (Naiki et al., 1989).
Binding affinity of ANS, DCVJ, and ThT to early misfolded TTR oligomers
Samples containing 1 μM total concentration of misfolded A-state TTR monomers packed into soluble oligomers harvested 2 h after misfolding initiation were used as bait for probe binding. These aggregates have a size of ∼500 kD, which results in an average concentration of oligomers of ∼30 nM. The binding curve for DCVJ, ANS, and ThT are shown in Fig. 7, with background corrected from unbound probe. The binding affinity was compared between the different probes defining an intensity 50 value, I50, being the half height of the maximum emission intensity, corresponding to an apparent dissociation constant. All three probes bind with similar affinity to these oligomers with DCVJ, indicating the strongest affinity showing I50 values of 1.6 μM for DCVJ, 2.4 μM for ANS, and 6.8 μM for ThT (Fig. 7). Bis-ANS was omitted from this binding study due to the promiscuous behavior in terms of fluorescence response; it essentially binds to any conformational state of TTR.
FIGURE 7.

Binding curve of different probes to TTR A-state oligomers incubated at 14 μM (monomer concentration) for 2 h. Probe binding to 1 μM TTR A-state monomers that has formed misfolded oligomers corresponding to ∼30 nM oligomers. Symbols: ANS (red circles), DCVJ (blue triangles), and ThT (black squares).
Summary of the use of ANS, Bis-ANS, DCVJ, and ThT as fluorescence conformational probes
The results of the analysis of the fluorescence response in binding to unfolded monomers, native TTR, and various stages of the aggregation reaction is summarized in Table 2. ANS increases its quantum yield in response to aggregate size, which is rather surprising given that more accessible surface area is provided in monomeric molten-globule states. Bis-ANS shows a wide variety of fluorescence responses and fluoresces most strongly when bound to monomeric A-state TTR and surprisingly also fluoresces strongly when bound to unfolded monomeric TTR. The fluorescence intensity of Bis-ANS decreases as the A-state aggregates, well in accordance with hiding of accessible surface area in contrast to the behavior of ANS, likely due to the fact that Bis-ANS is more bulky. It should however be noted that Bis-ANS still fluoresces very strongly in the presence of large aggregates (Figs. 5 and 6). The data reveal that DCVJ is a preferable probe for detection of early oligomers given its early response in the kinetic assay although it also binds to more mature fibrils and spherical aggregates. When both the amplitudes and the rates are taken into context, it is evident that ThT responds slowest of all probes in the study, which suggests that its strongest signal emanates from the most mature fibrils. It is however notable that the ThT molecule also responds to early oligomers (Fig. 6 and Table 2), which was also recently reported from TTR aggregation measurements by the Kelly group (Hurshman et al., 2004).
TABLE 2.
Relative fluorescence intensity* of probes bound to different conformational states of TTR
| TTR conformational state | ANS | Bis-ANS | DCVJ | ThT |
|---|---|---|---|---|
| Native tetramer | 5+ | 2+ | 0 | 0 |
| Unfolded monomer | 1+ | 3+ | 1− | 0 |
| A-state (monomer) | 2+ | 5+ | 2+ | 0 |
| Early misfolded oligomers (300–500 kD) | 3+ | 4+ | 5+ | 2+ |
| Misfolded spherical aggregates and protofibrils | 4+ | 3+ | 5+ | 3+ |
| Late protofibrils | 4+ | 3+ | 5+ | 5+ |
Scale: very strong fluorescence, 5+; strong fluorescence, 4+; medium fluorescence, 3+; modest fluorescence, 2+; minor fluorescence, 1+; nonfluorescent, 0; quenching, 1−.
The fluorescence intensity is normalized in relation to the strongest signal for that particular probe.
Time resolved fluorescence anisotropy of extrinsic probes as a measure of protein aggregation
Fluorescence lifetime data from ANS, Bis-ANS, DCVJ, and ThT were recorded from the probes bound to both native and aggregated TTR (Fig. 8). ANS bound to native TTR showed a major component with a lifetime of 16.1 ns and a minor component with a lifetime of 3.87 ns (Table 3). ANS bound to aggregated TTR showed that the minor component increased its lifetime to 4.88 ns and increased its relative amplitude. Bis-ANS has a shorter lifetime than ANS but also displays two different components with a more even distribution. These components bound to native TTR have lifetimes of 2.65 and 7.62 ns. Bound to aggregated TTR, the fluorescence lifetime of both components have increased and the relative amplitude of the slower component has increased (Table 3), well in accordance with the massive increase in quantum yield compared to when bound to native TTR (Fig. 5, A and B). DCVJ and ThT bound to aggregated TTR shows markedly similar fluorescence lifetimes which were overall short with at least three components (Fig. 8). The most rapid components had lifetimes <0.1 ns, and the slowest components showed lifetimes of 3.6 ns for DCVJ and 3.9 ns for ThT. For both probes, the relative amplitude of the slow component increased with time as more TTR aggregates formed (data not shown).
FIGURE 8.

Time-resolved fluorescence of the different probes. ANS and Bis-ANS were bound to native TTR, excitation at 403 nm, and emission at 490 nm. Native tetrameric TTR (1 μM) in 50 mM Tris-HCl (pH 7.5) binding 2 μM ANS (red circles) or 2 μM Bis-ANS (green triangles). DCVJ and ThT were bound to misfolded aggregated TTR after 1 h incubation under A-state conditions. 2 μM DCVJ (blue triangles) or 2 μM ThT (black squares) were bound to 2 μM TTR (monomer concentration), excitation at 443 nm, emission at 500 nm. The ThT curve is hidden behind the DCVJ curve in the figure due to very similar decay profiles. The lamp response is indicated with open black circles. Fluorescence lifetimes are listed in Table 3.
TABLE 3.
Lifetime data of probes bound to different TTR species
| Sample | Very rapid component (ns)/relative amplitude | Rapid component (ns)/relative amplitude | Slow component (ns)/relative amplitude |
|---|---|---|---|
| Native tetrameric TTR + ANS* | – | 3.87/0.14 | 16.1/0.86 |
| Native tetrameric TTR + Bis-ANS* | – | 2.65/0.40 | 7.62/0.60 |
| Aggregated TTR + ANS* | – | 4.88/0.33 | 15.9/0.67 |
| Aggregated TTR + Bis-ANS* | – | 2.73/0.28 | 8.40/0.72 |
| Aggregated TTR + DCVJ† | <0.1 ns/0.58 | 0.5/0.14 | 3.6/0.28 |
| Aggregated TTR + ThT† | <0.1 ns/0.53 | 0.8/0.27 | 3.9/0.20 |
Standard deviation errors of fitted components were typically 50 ps.
Excitation at 403 nm. Detected emission at 490 nm using a slit width of 16 nm.
Excitation at 443 nm. Detected emission at 500 nm using a slit width of 16 nm.
Time-resolved fluorescence anisotropy was employed to probe the dynamics of different conformational states of TTR. The fitted rotational correlation time for native TTR using bound ANS was found to be 27 ns, and for native TTR with bound Bis-ANS 22 ns. The lower value for the Bis-ANS case is (at least) partially due to the shorter lifetime that will truncate the measurement since the rotational correlation time is considerably longer than the decay lifetime. The fluorescence lifetime of ANS was found to be the longest and therefore the most reliable in trying to resolve rotational correlation times of TTR oligomers and larger assemblies. ANS binds to a small extent to the unfolded monomeric form of TTR (Table 2), providing an excellent reference point for molecular dynamics studies of the quaternary structure of TTR. From Fig. 9 A it is clear that it is more rapidly tumbling than the native form as indicated by the initial slope near t = 0. The rotational correlation time was estimated in the range 13–16 ns. TTR aggregates were generated from acid unfolded TTR by addition of 100 mM NaCl inducing the A-state. A trace from a fluorescence anisotropy decay measurement of aggregates (incubated under A-state conditions for 24 h) is shown in Fig. 9 A, which clearly shows that the anisotropy decay does not reach zero, but reach a limiting level around 0.2, due to longer rotational correlation time of the aggregates than the fluorescence lifetime of ANS. This makes a direct determination of the rotational correlation time impossible. Being aware that the rotational correlation time of the aggregates were larger than the fluorescence lifetime of bound ANS, we generated a distribution of aggregate sizes using a variety of TTR concentrations from 2 to 8 μM (monomer concentration) that were incubated for 20 h (Fig. 9 B). Still the formed aggregates were too large to enable direct determination of their rotational correlation time due to the modest lifetime of ANS although being 16 ns. Importantly, a very interesting correlation was evident from these measurements showing that the limiting anisotropy values correlates to the protein concentration, indicating that this is a possible method for detecting aggregation formation and aggregate size distribution. Further work seems here necessary, and fluorescence probes exhibiting longer decay time is highly desirable for direct determination of the size distribution of the oligomer assemblies and protofibrils. Such work is ongoing in our laboratories, and data from misfolded TTR oligomers recorded from site-specific fluorescence labeling of cysteine mutants have provided size distributions with average rotation correlation times of ∼150 ns (K. Sörgjerd, J. R. Johnsen, M. Lindgren, and P. Hammarström, unpublished).
FIGURE 9.
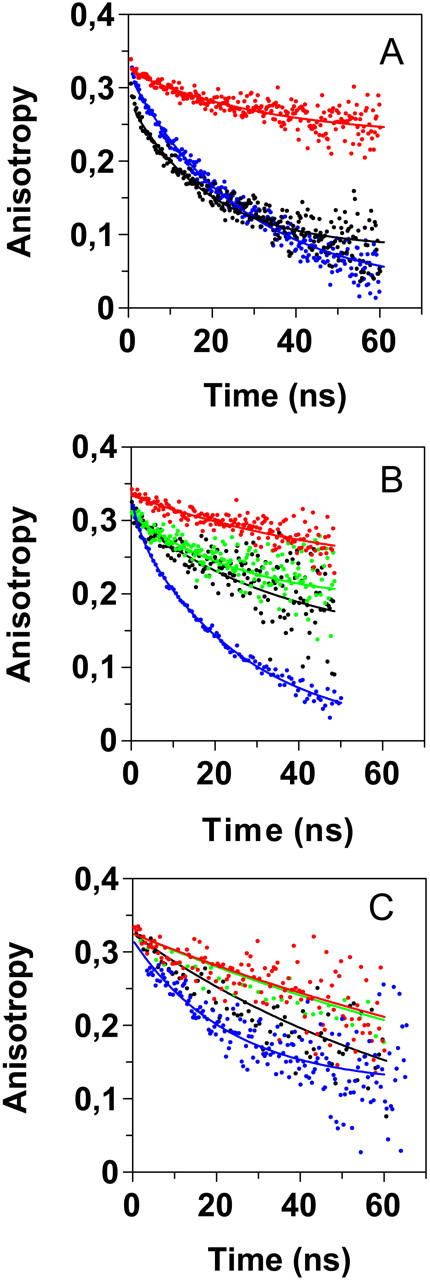
Anisotropy decay of ANS bound to TTR in different states. Excitation at 403 nm, emission detected at 475 nm. (A) Native tetrameric TTR (6 μM) in 50 mM Tris-HCl (pH 7.5) with added 2 μM ANS (blue). Unfolded monomeric TTR (2 μM) in 10 mM HCl no salt (pH 2.0) with added 2 μM ANS (black). Aggregated TTR generated from acid unfolded monomeric TTR during A-state incubation for 24 h (8 μM monomer) in 10 mM HCl, 100 mM NaCl (pH 2.0) with added 2 μM ANS (red). (B) ANS anisotropy of aggregates of A-state TTR incubated for 24 h at different monomer concentrations: 2 μM (black), 4 μM (green), and 8 μM (red). As a comparison, the trace for native tetrameric TTR is shown in blue. (C) Kinetics of TTR aggregation. Average times for anisotropy decay traces: 1 min (blue), 11 min (black), 33 min (green), and 125 min (red). Aggregation was induced through addition of a final concentration of 50 mM Na-acetate (final pH 2.5) and 100 mM NaCl to acid unfolded monomeric TTR (pH 2.0), inducing A-state formation that aggregate at a final TTR monomer concentration of 8 μM. The solid lines are fits to single exponential decays and are included merely to guide the eye.
To further demonstrate the use of fluorescence anisotropy decay, we probed TTR aggregation kinetics using time-resolved anisotropy. Fig. 9 C shows anisotropy decay from TTR aggregation reactions collected after 1, 11, 33, and 125 min of A-state initiation. Although the data from such measurements are noisy due to the short data collection time (2 min), we found good correlations with the aggregation kinetics of ANS binding using steady-state fluorescence (Fig. 6). Furthermore, these data correlate nicely to the cross-linking data of Fig. 2 and show that the limiting anisotropy level is almost reached after 2 h, which is before the appearance of very large aggregates such as protofibrils and spheres, but is at the peak of the 300–500 kD oligomers.
Physicochemical background for the fluorescence properties of DCVJ and ThT
To understand the physicochemical background for the fluorescence of DCVJ and ThT when bound to misfolded TTR aggregates, we used glycerol-water mixtures to decrease the intrinsic rotational relaxation time of the fluorescent dyes. The fluorescence of DCVJ is known to be correlated to rotational relaxation. Evidently increasing viscosity increases the quantum yield of DCVJ (Fig. 10 A). The physicochemical reason for ThT fluorescence in the presence of amyloid fibrils is not known (LeVine, 1993). We compared the properties of ThT with that of DCVJ and found a very similar dependence on viscosity after the increasing relative concentration of glycerol (Fig. 10, B and C). Similar increase in fluorescence quantum yield was evident in 50% w/w PEG (MW 3350; data not shown) as in 50% glycerol showing that increased viscosity is the main reason for the increased quantum yield. This indicates that one reason for the very strong quantum yield of ThT bound to amyloid fibrils is due to rotational relaxation. The charged thiazol moiety of ThT likely serves as an intrinsic intramolecular quencher of the ThT molecule. However, viscosity alone does not give the complete picture, since we also note a significant blue shift in the fluorescence maximum when bound to amyloid fibrils and to prefibrillar misfolded oligomers. The fluorescence emission peak has here shifted to 482 nm, which was not noted in the case of increased viscosity. In comparison, the ThT fluorescence peak in a water–glycerol mixture remains constant at 492 nm. The specific signal obtained from ThT binding to amyloid fibrils should therefore be a combined effect of decreased rotational relaxation and decreased polarity of the surrounding environment.
FIGURE 10.

DCVJ and ThT fluorescence in water-glycerol mixtures. (A) DCVJ fluorescence. (B) ThT fluorescence. The concentration of glycerol (v/v) was varied between 0% (lower spectrum) and 82.5% (upper spectrum). Increased viscosity will decrease tumbling and self-quenching. (C) Fluorescence intensity of DCVJ (○) and ThT (•) as a function of viscosity.
pH-independent binding and fluorescence of DCVJ
One problem frequently encountered with ThT is the pH-dependent fluorescence in amyloid fibril formation measurements. Several amyloidogenic in vitro assays employ acidic pH for generation of amyloid fibrils; however, ThT shows very modest fluorescence at acidic pH when bound to protofibrillar amyloid of TTR (Fig. 11 B), amyloid fibrils of insulin, and lysozyme (P. Nilson, A. Herland, O. Inganäs, M. Lindgren, and P. Hammarström, unpublished) compared to binding at pH 7.5 (Fig. 11 B). Hence, the ThT assay requires a change in environment to neutral pH before fluorescence measurements. When comparing ThT and DCVJ fluorescence data from a protofibrillar sample of TTR (24 h incubation), it is evident that DCVJ shows pH-independent fluorescence (Fig. 11 A). ThT, on the other hand, requires a pH adjustment for its characteristic amyloid fluorescence signal (Fig. 11 B). It should be emphasized that this is not due to loss-of-fluorescence due to titration of ThT, which is the case for, e.g., fluorescein. ThT fluorescence at pH 1.6, pH 3.0, and pH 7.5 in the presence of 80% glycerol clearly shows pH-independent fluorescence (Fig. 11 D). The same is true for DCVJ (Fig. 11 C). Therefore, the difference between DCVJ and ThT is that ThT does not fluoresce in the presence of protofibrillar amyloid of TTR at pH 3.0 but only when the pH is increased to pH 7.5. This could be due to charge repulsion of positively charged ThT and protein at pH 3.0.
FIGURE 11.

pH sensitivity on fluorescence of DCVJ and ThT. TTR aggregates were generated from acid unfolded TTR, which was incubated at A-state conditions for 24 h (14 μM monomer concentration). Spectra were recorded from mixing 5 μM TTR (monomer concentration) and 5 μM dye in different buffers. (A) TTR aggregates + DCVJ in 50 mM Tris-HCl (pH 7.5; solid line) and in 40 mM Na-acetate (pH 3.0; dashed line) (B) TTR aggregates + ThT in 50 mM Tris-HCl (pH 7.5; solid line) and in 40 mM Na-acetate (pH 3.0; dashed line). (C) DCVJ (5 μM) without protein in 80% glycerol buffered with 50 mM Tris-HCl (pH 7.5; solid line); 40 mM Na-acetate (pH 3.0; dashed line); 25 mM HCl (pH 1.6; dotted line). (D) ThT (5 μM) without protein, same buffers as in C.
CONCLUDING REMARKS
Given the severity of many diseases associated with protein misfolding and aggregation, including the amyloidoses and the transmissible spongiform encephalopathies, research in this area is intense. Protein aggregation and amyloid formation in vivo and in vitro are very complex processes which require sophisticated techniques for appropriate understanding and for future development of diagnostic tools and assays for high throughput drug screening.
The results presented in this report describe the misfolding, oligomerization, and aggregation process of TTR that was induced from unfolded TTR through induction of the molten globule A-state. The approach to generate these species in solution opens up the possibility to probe the process by a wide number of biochemical and biophysical techniques to provide insight into the mechanism of protein misfolding and misassembly. The oligomers of misfolded A-state TTR display many interesting features that are useful for molecular characterization such as high β-sheet content and exposed hydrophobic patches, which can bind several different fluorescent dyes. Upon maturation the oligomers clustered into either protofibrils or spherical aggregates, and upon further maturation the spheres shrink in size as fibrils extend in length.
Our main goal with this study was to employ a variety of fluorescence probes (ANS, Bis-ANS, DCVJ, and ThT) and techniques (steady state and time resolved) to recognize and characterize different states of a protein in the process of misfolding and self-assembly. The environmentally sensitive probe ANS has previously proven useful in detecting molten globule states, starting with the work by Semisotnov and co-workers (Semisotnov et al., 1991). Molten globules are notorious for their aggregation-prone behavior. Interestingly, we found that ANS fluorescence intensity increases as the A-state molten globule of TTR aggregates. Results in this study show that the use of ANS fluorescence intensity as a probe of molten globule formation can be complemented with fluorescence anisotropy decay to indicate the quaternary state of the molten-globule protein. Although the fluorescence lifetime of ANS is not in the range to enable accurate determination of the rotational correlation time of a large oligomer, ANS anisotropy decay can be used as a measure of aggregation both through point measurements and in a kinetic assay showing limiting anisotropy baselines.
It was also shown how molecular rotors such as DCVJ can be used as “aggregation probes” for amyloidogenic systems. We compared the properties of DCVJ with the known amyloid specific dye ThT and found striking similarities, including fluorescence lifetimes and viscosity dependence on fluorescence intensity. DCVJ was found to be very sensitive to formation of early oligomers and showed the strongest apparent binding affinity of the probes in the study. The intrinsic quenching of molecular rotors makes them sensitive to intrinsic rotational relaxation, which is slowed down during binding to aggregated protein.
The widely used amyloid probe ThT appears to function with a similar mechanism, but in addition the local hydrophobicity has to be changed for the characteristic fluorescence of ThT to appear. In addition, there may be other factors such as specific planar excitation of ThT in a symmetric binding cavity that is required for the amyloid signal. Some useful characteristics of DCVJ make this a very attractive complement and alternative to ThT for amyloid and aggregation studies. DCVJ should be especially useful for dynamic studies such as aggregation kinetics and detection of prefibrillar oligomers and can be used at acidic pH, which make this an attractive tool for in vitro studies. The use of DCVJ for staining tissue samples or for use in kinetic assays probing for amyloid oligomers and fibrillar seeds in serum or cerebrospinal fluid is a tantalizing possibility but remains to be demonstrated.
Acknowledgments
We are grateful to Per Persson for initial assistance with electron microscopy work and to Jeffery Kelly and David Wemmer for providing the pmmHα plasmid.
This work was supported by grants from The Nanotech Programme of the Swedish Defence Research Agency (M.L. and P.H.), The Foundation for Strategic Research (P.H.), the Wenner-Gren Foundations (P.H.), the Swedish Research Council (P.H.), The Research Council of Norway (M.L.), Magnus Bergwall's Foundation (P.H.), and CeNano (P.H., K.S.).
References
- Buxbaum, J. N. 2003. Diseases of protein conformation: what do in vitro experiments tell us about in vivo diseases? Trends Biochem. Sci. 11:585–592. [DOI] [PubMed] [Google Scholar]
- Conrad, R. H., and L. Brand. 1968. Intramolecular transfer of excitation from tryptophan to 1-dimethylaminonaphthalene-5-sulfonamide in a series of model compounds. Biochemistry. 7:777–787. [DOI] [PubMed] [Google Scholar]
- Freskgård, P. O., L. G. Mårtensson, P. Jonasson, B.-H. Jonsson, and U. Carlsson. 1994. Assignment of the contribution of the tryptophan residues to the circular dichroism spectrum of human carbonic anhydrase II. Biochemistry. 33:14281–14288. [DOI] [PubMed] [Google Scholar]
- Haidekker, M. A., T. Brady, K. Wen, C. Okada, H. Y. Stevens, J. M. Snell, J. A. Frangos, and E. A. Theodorakis. 2000. Phospholipid-bound molecular rotors: synthesis and characterization. Bioorg. Med. Chem. 10:3627–3636. [DOI] [PubMed] [Google Scholar]
- Haidekker, M. A., T. Ling, M. Anglo, H. Y. Stevens, J. A. Frangos, and E. A. Theodorakis. 2001. New fluorescent probes for the measurement of cell membrane viscosity. Chem. Biol. 8:123–131. [DOI] [PubMed] [Google Scholar]
- Hammarström, P., X. Jiang, A. R. Hurshman, E. T. Powers, and J. W. Kelly. 2002. Sequence-dependent denaturation energetics: a major determinant in amyloid disease diversity. Proc. Natl. Acad. Sci. USA. 99:16427–16432. [DOI] [PMC free article] [PubMed] [Google Scholar]
- Hammarström, P., B. Kalman, B.-H. Jonsson, and U. Carlsson. 1997. Pyrene excimer fluorescence as a proximity probe for investigation of residual structure in the unfolded state of human carbonic anhydrase II. FEBS Lett. 420:63–68. [DOI] [PubMed] [Google Scholar]
- Hammarström, P., P. Owenius, L. G. Mårtensson, U. Carlsson, and M. Lindgren. 2001b. High-resolution probing of local conformational changes in proteins by the use of multiple labeling: unfolding and self-assembly of human carbonic anhydrase II monitored by spin, fluorescent, and chemical reactivity probes. Biophys. J. 80:2867–2885. [DOI] [PMC free article] [PubMed] [Google Scholar]
- Hammarström, P., M. Persson, and U. Carlsson. 2001a. Protein compactness measured by fluorescence resonance energy transfer. Human carbonic anhydrase II is considerably expanded by the interaction of GroEL. J. Biol. Chem. 276:21765–21775. [DOI] [PubMed] [Google Scholar]
- Hammarström, P., M. Persson, P.-O. Freskgård, L.-G. Mårtensson, D. Andersson, B.-H. Jonsson, and U. Carlsson. 1999. Structural mapping of an aggregation nucleation site in a molten globule intermediate. J. Biol. Chem. 274:32897–32903. [DOI] [PubMed] [Google Scholar]
- Hammarström, P., F. Schneider, and J. W. Kelly. 2001c. Trans-suppression of misfolding in an amyloid disease. Science. 293:2459–2462. [DOI] [PubMed] [Google Scholar]
- Hurshman, A. R., J. T. White, E. T. Powers, and J. W. Kelly. 2004. Transthyretin aggregation under partially denaturing conditions is a downhill polymerization. Biochemistry. 43:7365–7381. [DOI] [PubMed] [Google Scholar]
- Iwaki, T., C. Torigoe, M. Noji, and M. Nakanishi. 1993. Antibodies for fluorescent molecular rotors. Biochemistry. 32:7589–7592. [DOI] [PubMed] [Google Scholar]
- Kelly, J. W. 1996. Alternative conformations of amyloidogenic proteins govern their behavior. Curr. Opin. Struct. Biol. 6:11–17. [DOI] [PubMed] [Google Scholar]
- Kung, C. E., and J. K. Reed. 1989. Fluorescent molecular rotors: a new class of probes for tubulin structure and assembly. Biochemistry. 28:6678–6686. [DOI] [PubMed] [Google Scholar]
- Lai, Z., W. Colon, and J. W. Kelly. 1996. The acid-mediated denaturation pathway of transthyretin yields a conformational intermediate that can self-assemble into amyloid. Biochemistry. 35:6470–6482. [DOI] [PubMed] [Google Scholar]
- Lakowicz, J. R. 1999. Principles of Fluorescence Spectroscopy, 2nd ed. Kluwer Academic/Plenum Publishers, New York.
- Lambert, M. P., A. K. Barlow, B. A. Chromy, C. Edwards, R. Freed, M. Liosatos, T. E. Morgan, I. Rozovsky, B. Trommer, K. L. Viola, P. Wals, C. Zhang, and others. 1998. Diffusible, nonfibrillar ligands derived from Abeta1–42 are potent central nervous system neurotoxins. Proc. Natl. Acad. Sci. USA. 95:6448–6453. [DOI] [PMC free article] [PubMed] [Google Scholar]
- Lashuel, H. A., C. Wurth, L. Woo, and J. W. Kelly. 1999. The most pathogenic transthyretin variant, L55P, forms amyloid fibrils under acidic conditions and protofilaments under physiological conditions. Biochemistry. 38:13560–13573. [DOI] [PubMed] [Google Scholar]
- LeVine, H. 1993. Thioflavine T interaction with synthetic Alzheimer's disease b-amyloid peptides: detection of amyloid aggregation in solution. Protein Sci. 2:404–410. [DOI] [PMC free article] [PubMed] [Google Scholar]
- Loutfy, R. O. 1986. Fluorescent probes for polymer free-volume. Pure Appl. Chem. 58:1239–1248. [Google Scholar]
- Naiki, H., K. Higuchi, M. Hosokawa, and T. Takeda. 1989. Fluorometric determination of amyloid fibrils in vitro using the fluorescent dye, Thioflavine T. Anal. Biochem. 177:244–249. [DOI] [PubMed] [Google Scholar]
- Nilsson, S. F., L. Rask, and P. A. Peterson. 1975. Studies on thyroid hormone-binding proteins. II. Binding of thyroid hormones, retinol-binding protein, and fluorescent probes to prealbumin and effects of thyroxine on prealbumin subunit self association. J. Biol. Chem. 250:8554–8563. [PubMed] [Google Scholar]
- Sawada, S., T. Iio, Y. Hayashi, and S. Takahashi. 1992. Fluorescent rotors and their applications to the study of G-F transformation of Actin. Anal. Biochem. 204:110–117. [DOI] [PubMed] [Google Scholar]
- Semisotnov, G. V., N. A. Rodionova, O. I. Razgulyaev, V. N. Uversky, A. F. Gripas', and R. I. Gilmanshin. 1991. Study of the “molten globule” intermediate state in protein folding by a hydrophobic fluorescent probe. Biopolymers. 31:119–128. [DOI] [PubMed] [Google Scholar]
- Sousa, M. M., I. Cardoso, R. Fernandes, A. Guimaraes, and M. J. Saraiva. 2001. Deposition of transthyretin in early stages of familial amyloidotic polyneuropathy: evidence for toxicity of nonfibrillar aggregates. Am. J. Pathol. 159:1993–2000. [DOI] [PMC free article] [PubMed] [Google Scholar]
- Svensson, M., P. Jonasson, P.-O. Freskgård, B.-H. Jonsson, M. Lindgren, L.-G. Mårtensson, M. Gentile, K. Borén, and U. Carlsson. 1995. Mapping the folding intermediate of human carbonic anhydrase II. Probing substructure by chemical reactivity and spin and fluorescence labeling of engineered cysteine residues. Biochemistry. 34:8606–8620. [DOI] [PubMed] [Google Scholar]
- Westermark, P., K. Sletten, B. Johansson, and G. G. Cornwell. 1990. Fibril in senile systemic amyloidosis is derived from normal transthyretin. Proc. Natl. Acad. Sci. USA. 87:2843–2845. [DOI] [PMC free article] [PubMed] [Google Scholar]
- Wojtczak, A., J. Luft, and V. Cody. 1992. Mechanism of molecular recognition. Structural aspects of 3,3′-diiodo-L-thyronine binding to human serum transthyretin. J. Biol. Chem. 267:353–357. [PubMed] [Google Scholar]