

Abstract
Soybean agglutinin is a tetrameric legume lectin, each of whose subunits are glycosylated. This protein shows a very high degree of stability when compared to the other proteins of the same family. In a previous work, it was shown that the unusual stability of the protein is due to a high degree of subunit interactions. In this study we present the thermodynamic parameters for the stability of soybean agglutinin monomer. The monomeric species is found at pH 2 and below which it is most populated at pH 1.9, as evident from size-exclusion chromatographic and dynamic light scattering studies. The analyses of circular dichroism and fluorescence spectroscopy suggest that the monomer is well folded, and that it has certain characteristic features when compared to its tetrameric counterpart. The conformational stabilities of the tetramer and the monomer at the temperature of their maximum stabilities (310 K) are 59.2 kcal/mol and 9.8 kcal/mol, respectively, indicating that oligomerization contributes significantly to the stability of the native molecule. Also, the Tg difference for the two forms of the protein is ∼40 K, whereas the difference in ΔCp is only 1.6 kcal/mol/K. This suggests that the major hydrophobic core is present in the monomer itself, and that oligomerization involves mainly ionic interactions.
INTRODUCTION
The stability of a protein lies in its ability to resist perturbation in its conformation and function. It is important to determine the conformational stability of a protein to elucidate the nature of physical and chemical forces that contribute to its fold. A folded protein is only marginally stable over its unfolded state, which can be disrupted by an environmental change such as a rise or fall in temperature, pH, or pressure, or by the addition of chemical denaturants. Thus, thermal or denaturant induced unfolding measured either spectroscopically or calorimetrically gives us a quantitative estimation of protein stability (Nicholson and Scholtz, 1996). Experimentalists have differentiated the folded and the unfolded forms of the protein by monitoring the change in optical, hydrodynamic, and thermodynamic characteristics (Agashe and Udgaonkar, 1995; Ullah et al., 2005). The choice of a protein is also very important in determining the type of physical/chemical interactions one wants to study. An important criterion a protein has to fulfill for these studies is that it establishes a reversible equilibrium between the folded and unfolded states. Most of the studies in this field have mainly concentrated on small monomeric proteins, which have provided a lot of information about the stability and folding pathways of such proteins. However, there are a large number of proteins that exist as multimers and thus it becomes necessary to deal with issues pertaining to the role of subunit interactions in the stability of oligomeric proteins (Sinha et al., 2005).
Legume lectins serve as excellent model systems for studies of multisubunit proteins and the effect of oligomerization on their structural integrity and stability. They share almost 35% sequence identity and have similar secondary and tertiary structures, yet differ in their modes of oligomerization and, hence, are rightly described as the “natural mutants” of quaternary structure (Srinivas et al., 2001). Fig. 1 a shows the monomeric unit of soybean agglutinin (SBA) tetramer, which is a representative of a typical legume lectin monomer. Also, many of these proteins are glycosylated. These proteins thus serve as paradigms for the studies addressing the effect of glycosylation and quaternary association on stability and folding studies of oligomeric systems (Mitra et al., 2002, 2003). Hence, most of the unfolding studies on lectins to date have dealt with their natural oligomeric forms, excepting the observation of a partially folded monomeric intermediate for peanut agglutinin (Ahmad et al., 1998; Reddy et al., 1999; Bachhawat et al., 2001).
FIGURE 1.
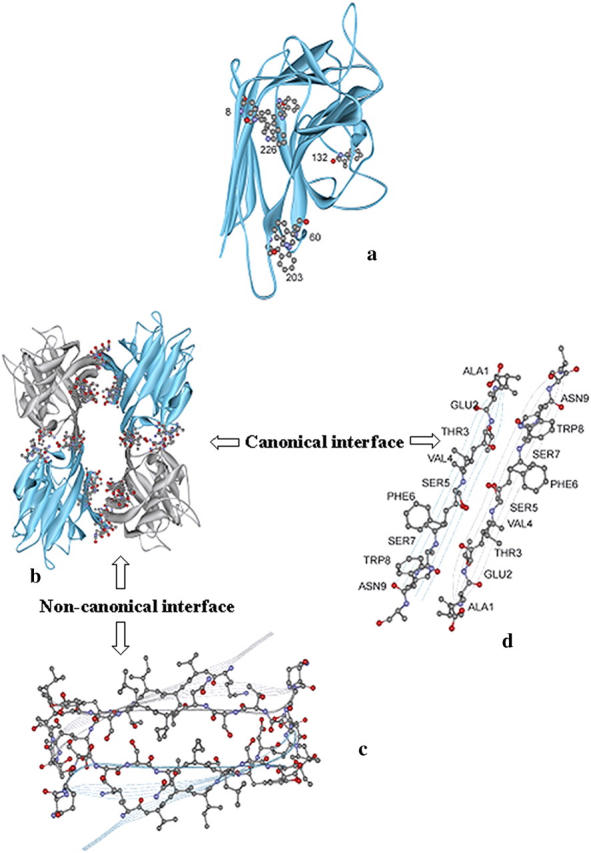
(a) The monomer of SBA (PDB code 2sba) showing the disposition of the tryptophan residues. The residue numbers are indicated in boldface. (b) The types of residues present at the two-state interface of SBA tetramer. The figure clearly indicates that the interface is mainly made up of polar residues. The residues at the interface are marked by the ball-and-stick model. (Carbon is represented by black, oxygen by red, and nitrogen by blue spheres in the model.) The residues that line up the interface are 1–10, 163–173, and 183–193. (d) Numbers represent the residues that line up the canonical interface in SBA. (c) The residues at the non-canonical interface in SBA. The latter residues are not marked to avoid overcrowding; however, it is quite clear from the figure that this interface has a considerable number of polar residues.
In this study we report for the first time the unfolding of a monomeric form of a legume lectin for soybean agglutinin. When the thermodynamic parameters for the tetrameric and monomeric SBA are compared, the difference in the stability of the two forms allows an assignment of the contribution of subunit interaction to the total protein stability of the tetramer. Similar approaches have been used for comparing the stabilities of Trp-apo-repressor dimers and procaspase-3 dimers with their respective monomers (Matthews, 1993; Gittelman and Matthews, 1990; Bose and Clark, 2005). However, unlike these systems, polar interactions contribute in a significant manner to the stability of SBA tetramer.
MATERIALS AND METHODS
Materials
Ultrapure guanidinium hydrochloride (GdnCl) was purchased from Sigma Chemical (St. Louis, MO). All other reagents used for the study were of the highest purity available. Stock GdnCl solutions were prepared fresh, in 10 mM glycine-HCl buffer pH 1.9 containing 15 mM CaCl2 and MnCl2. The concentration of GdnCl was determined by refractive index as described by Pace (1990).
Protein purification
In a typical preparation, 250 g of soybean seeds were homogenized and defatted. The defatted dry meal was extracted with 20 mM phosphate buffer, pH 7.4, containing 150 mM sodium chloride for 12 h at 4°C under constant stirring. The extract was subjected to ammonium sulfate fractionation of 30%. The precipitate was removed by centrifugation at 8000 rpm for 30 min. The supernatant was again subjected to 65% ammonium sulfate fractionation. The precipitate was collected this time by centrifugation at 8000 rpm for 45 min. The precipitate was dissolved in minimum amount of the buffer and extensively dialyzed against the same buffer. The dialyzed solution was centrifuged at 8000 rpm for 15 min and the clear supernatant was loaded on a lactosylamine Biogel P-150 column (Regent Medical, Irlam, UK) pre-equilibrated with phosphate-buffered saline (PBS) (Baues and Gray, 1977). The column was then washed extensively with PBS until the washings have A280 < 0.005. Elution was carried out in 0.2 M lactose in PBS. The concentration of the protein solution was determined from specific extinction coefficient of  for SBA (Lotan et al., 1974).
Spectral measurements
Fluorescence emission spectra were collected on a Jobin-Yvon fluorometer (HORIBA, Jobin-Yvon/Spex Division, Longjumeau, France) in a 1-cm water-jacketed cell using a protein concentration of 2 μM, unless otherwise stated. Samples were excited at 280 nm and the emission spectra were recorded from 300 to 400 nm. All the circular dichroism (CD) experiments were done in a JASCO-J715 polarimeter (JASCO, Tokyo, Japan) in a 0.1-cm pathlength cell for far UV-CD and 0.2-cm pathlength for near UV-CD, with a slit width of 1 nm, response time of 4 s, and scan speed of 50 nm/s.
Dynamic light scattering measurements
The dynamic light scattering measurements were done using Dyna Pro-MS800 dynamic light scattering equipment (Proterion, Protein Solutions, Wyatt Technology, Santa Barbara, CA). The protein concentration used was 0.8 mg/ml. The readings were obtained at different values of pH, using AGH10 buffer (10 mM acetate/10 mM glycine/10 mM HEPES containing 15 mM Ca2+/Mn2+ and 154 mM NaCl) at 25°C.
Isothermal GdnCl-induced denaturation
Equilibrium unfolding studies as a function of guanidinium hydrochloride concentration were performed by monitoring fluorescence spectroscopy and far UV-CD. The protein concentration used for all the experiments was 2 μM, unless otherwise mentioned. The excitation and emission wavelengths were fixed at 280 nm and 370 nm, respectively. The wavelength was determined by obtaining the maxima of the difference spectra of the native and unfolded forms of the respective proteins. The maximum difference between the native and the denatured spectra occurs at 370 nm. In all experiments the slit width was fixed at 3 nm and 5 nm for excitation and emission, respectively. Each data point was an average of three accumulations. Similarly CD data were collected at 222 nm. Eight GdnCl-induced isothermal denaturation curves were collected in the temperature range 273–308 K for SBA at pH 1.9. It was not possible to execute the experiments at higher temperatures than this because of the kinetics of the unfolding and sample aggregation problems. A Julabo water bath (JULABO, Seelbach, Germany) was used to maintain the sample temperature within 0.1 K of the set temperature. The values of ΔGo (the free energy change upon protein unfolding at zero denaturant concentration) and m (the linear dependence of free energy upon protein unfolding on denaturant) at a given temperature were estimated according to the linear free energy model (Schellman, 1990). According to the linear free energy model, the changes in free energy and enthalpy upon unfolding depend linearly on denaturant concentration, as
 |
(1) |
where  is the Gibb's free energy of the process, m is the slope of the transition, and ΔGo corresponds to the difference in free energy between the unfolded and the folded states in the absence of any denaturant (D). The equations describing the unfolding of SBA monomer are given as
 |
(2a) |
 |
(2b) |
N and U are the representative native and unfolded states, fu is the fraction of unfolded protein, and Keq is the equilibrium constant for the change. The equilibrium constant is related to the free energy  according to
 |
(3) |
Substituting Eq. 2b and Eq. 1 in Eq. 3, we get
 |
(4) |
The value fu was calculated from the spectroscopic signal (CD or fluorescence) according to the equation given below, Y being the spectroscopic signal,
 |
(5a) |
The values Yf and Yu are characteristic of the native and unfolded baselines, which depend on denaturant concentration linearly as
 |
(5b) |
 |
(5c) |
And, finally, the following equation was fitted to obtain the desired parameters, as
 |
(6) |
where fn = 1 − fu.
After obtaining ΔGo at each temperature, the values were fitted to the following equation to obtain  ΔCp, and Tg (Nicholson, and Scholtz, 1996; Ahmad et al., 1998),
 |
(7) |
Size-exclusion chromatography
To check the oligomeric state of SBA at different values of pH, gel-filtration studies using a Bio-Gel P-150 column (column volume 50 ml, void volume 15 ml by blue dextran) were done. Buffers used were 10 mM HEPES for pH 7; 10 mM acetate buffer for pH 5 and 10 mM glycine buffer for pH values 3, 2.5, 2, and 1.9. All the standards—i.e., lysozyme, ovalbumin, EcorL (a legume lectin dimer), and SBA tetramer—were run at pH 7.0. A standard calibration curve was drawn by plotting the ratio of the elution volume to void volume (Ve/Vo) against log of relative molecular mass (Mr). The column properties were almost unaltered during the course of the experiment.
RESULTS
pH titration of SBA using fluorescence, CD, and gel filtration
The structure of SBA as a function of pH was monitored by fluorescence, CD, dynamic light scattering, and gel-filtration studies. There was almost no change in the protein characteristics in the pH range 7–2.5. Similarly, the gel-filtration profiles show only one peak where the tetramer should elute. On further lowering the pH to 2.0, the fluorescence and CD spectra exhibit changes from those of the native fluorescence and CD spectra (shift of fluorescence λmax and slight change in the secondary structure in CD measurements). The gel-filtration profile at this point is very interesting. In addition to the tetramer another peak appears at a position corresponding to that of a folded monomer. Further decreasing the pH to 1.9 it was found that the protein elutes only as a monomer. Some amount of aggregate that elutes out in the void volume is observed at this pH if the sample is left in acid for more than 30 min (Fig. 2). At this pH the fluorescence and the CD spectra also show difference from that of the native tetrameric protein. The λmax shifts from 329 ± 2 nm to 336 ± 2 nm in fluorescence spectra (Fig. 3, upper panel). The CD spectra reveal that the secondary and tertiary structures in monomer are retained almost to the same extent as in the tetramer (Fig. 4, a and b).
FIGURE 2.

Size-exclusion chromatography studies on SBA at different pH. The column used was a Biogel P-150 column (50 cm × 1 cm2). Its void volume was estimated to be 15 ml using blue dextran as a marker. The column properties (bed volume) remained almost unaltered with change in pH. (A) SBA at pH 1.9 with 15 min of incubation before gel filtration. (B) SBA at pH 1.9 with 30 min of incubation. (C) SBA at pH 2.0. (D) SBA at pH 2.5. (E) SBA at pH 3.0. (F) SBA at pH 5.0. (G) SBA at pH 7.0. The standards used were lysozyme, ovalbumin, EcorL, and SBA tetramer. (The arrow in the inset indicates the SBA monomer.)
FIGURE 3.

The pH titration of SBA monitored by fluorescence λmax change (upper panel) and change in hydrodynamic radius monitored by DLS (lower panel). The tetramer (at pH 7.0) has a fluorescence λmax at 327 nm, which drops to 336 nm in the monomer (at pH 1.9). Similarly the hydrodynamic radii of the tetramer and the monomer are, respectively, 4.0 nm and 3.0 nm.
FIGURE 4.

(a) The pH-dependent CD spectra of SBA. The respective pH values are indicated in the diagram. The spectra were obtained in a 1-mm cell with a protein concentration of 2-μM (monomeric concentration) in all cases. (b) The tertiary structure of monomeric and tetrameric SBA at pH 1.9 and 7.0, respectively. The spectra were obtained in a 2-mm cell at a protein concentration of 50 μM (monomeric concentration) in both cases. All the spectra were normalized to the highest intensity observed.
Dynamic light scattering studies of SBA at different pH
The size of SBA monomer at different values of pH was monitored using dynamic light scattering. Lower panel in Fig. 3 shows the plot of hydrodynamic radius against pH for SBA. Under these conditions polydispersity was <20% throughout the pH range. It was found that SBA has a hydrodynamic radius of 4.1 ± 0.1 nm in the pH range 7–2.5. The size gradually starts changing below this pH and finally at pH 1.9 it attains a size of 3.1 ± 0.1 nm.
Two-state denaturant mediated unfolding of SBA at pH 1.9
The denaturation profile of monomeric SBA shows a two-state unfolding as shown by fluorescence and CD isothermal melts. The protein showed >70% reversibility when diluted to <0.5 M GdnCl from a 5.0 M solution of the denaturant. For each of the melts the protein concentration was kept at 2 μM. The samples were incubated for 20 min, which was the time found sufficient for achieving the equilibration of the denaturation process. Consistent with the gel-filtration studies, during this time no aggregation of SBA monomer was observed in dynamic light scattering (DLS) experiments. The intrinsic fluorescence at 370 nm was used as a probe to monitor the change, as at this wavelength there was maximum difference between the intensity of the native and denatured species. The curves showing the GdnCl-induced unfolding at different temperatures are shown in Fig. 5 a. The curve fitted well to a two-state model described by Eq. 6, which has been dealt with in detail in Materials and Methods. The parameters obtained from the fit of Eq. 6 are listed in Table 1. The fit of the curve is shown in the inset of Fig. 5 a. Further, the superposition of the isothermal melts obtained from two different optical probes—CD and fluorescence—completely overlapped with one another, proving the process to be two-state, which is shown in Fig. 5 b (Barrick and Baldwin, 1993). The isothermal melts were done with protein concentrations of 2 μM and 10 μM, and it was found that the transition is concentration-independent in contrast to that of the tetramer, where the change is concentration-dependent. From each of the isothermal melts ΔGo of unfolding at each temperature is calculated and a stability curve is drawn by fitting the values of ΔGo and T to Eq. 7, which generated the values of ΔHg, ΔCp, and Tg. The curve is shown in Fig. 6. These values are compared in Table 2 with those of the tetramer obtained previously (Sinha et al., 2005).
FIGURE 5.

(a) Overlay of the isothermal melts done at different temperatures at pH 1.9. The inset shows the best fit at 298 K according to Eq. 6. (b) The overlay of isothermal denaturation curves monitored by two different spectroscopic probes for UV-CD and fluorescence far monomer of SBA done at pH 1.9.
TABLE 1.
Unfolding free energy change for SBA monomer at different temperatures obtained from denaturant-induced isothermal melts
| Temperature (K) | ΔG (kcal/mol) | −m (kcal/mol/M) | Cm (M) |
|---|---|---|---|
| 288 | 7.20(±0.30) | 1.87(±0.09) | 4.62 |
| 290 | 7.50(±0.44) | 1.36(±0.17) | 4.66 |
| 292 | 7.76(±1.07) | 1.69(±0.27) | 4.65 |
| 294 | 8.69(±0.31) | 1.64(±0.07) | 4.63 |
| 296 | 8.07(±0.32) | 1.70(±0.07) | 4.73 |
| 298 | 9.48(±0.37) | 1.96(±0.08) | 4.61 |
| 300 | 9.91(±0.25) | 2.20(±0.53) | 4.65 |
| 302 | 9.48(±0.50) | 2.00(±0.10) | 4.55 |
| 304 | 8.65(±0.65) | 1.97(±0.15) | 4.42 |
| 306 | 9.96(±0.54) | 2.23(±0.12) | 4.40 |
| 308 | 9.81(±0.56) | 2.22(±0.13) | 4.36 |
The signal monitored was fluorescence in all cases. Each denaturation experiment was performed twice. The profiles from each duplicate were completely superimposable and consequently yielded identical results. The standard errors are given in parentheses. The value Cm is calculated from the fit of the curve.
FIGURE 6.

Thermodynamic stability of the monomer of SBA at pH 1.9. The solid line passing through the points is the fit of Eq. 7 to these points. Inset shows the m-values obtained from each isothermal melt. The m-value remains constant in the temperature range studied.
TABLE 2.
Thermodynamic parameters of SBA monomer and tetramer (data taken from Sinha et al., 2005) analyzed on the basis of stability curves drawn by fitting data to Eq. 7
| Oligomeric state | ΔHg (kcal/mol) | Tg (K) | ΔCp (kcal/mol/K) |
|---|---|---|---|
| Tetramer* | 505.7 ± 25.2 | 389.5 ± 5.6 | 5.0 ± 0.6 |
| Monomer | 164.2 ± 18.2 | 348.9 ± 7.2 | 3.4 ± 0.8 |
Data from Sinha et al. (2005).
DISCUSSION
Soybean agglutinin (SBA) is a tetramer like any other legume lectin that is made up of mainly β-sheets, i.e., the subunit adopts a tertiary structural fold described as the “jelly roll” motif common to all legume lectins (Dessen et al., 1995). A comparison of the fluorescence, CD, dynamic light scattering, and gel-filtration studies at different values of pH suggest that the protein retains its oligomeric state until pH 2.5, below which it starts dissociating. This was also observed by Sharon and co-workers in disk electrophoresis experiments (Lotan et al., 1974). They report that “…SBA afforded a single peak in buffers ranging in pH from 2.2 to 10.8, indicating neither apparent heterogeneity nor association-dissociation phenomena”. These studies thus reinforce earlier inferences about the structural integrity of the tetrameric assembly in SBA. Further, the similarity of fluorescence, CD, and DLS profiles till pH 2.5 suggests that SBA retains the tetrameric identity very strongly. Coming down to pH 2.25, it was found that the structural features were changing gradually. At this pH the onset of dissociation of the tetramer into monomers begins to occur. The picture at pH 1.9 is totally different. The process of dissociation is complete here (Fig. 3). The gel-filtration shows the presence of only the monomer. Slight amount of aggregate of SBA monomers is observed if the sample is kept at pH 1.9 for periods exceeding 0.5 h. The fluorescence spectra of monomeric and tetrameric SBA are, however, different. The native fluorescence spectrum for SBA at pH 7 shows emission λmax at 329 ± 2 nm, whereas that of the monomer is at 337 ± 2 nm. The upper panel in Fig. 3 shows the change in λmax of SBA with pH. SBA has six tryptophans per subunit. In the folded tetramer the residues are <32% accessible, as evident from the output of NACCESS program (Hubbard, 1996). Considering the monomer at pH 1.9 to be similar to that of the native subunit NACCESS analysis revealed that two of the tryptophan residues (i.e., 8 and 203) become remarkably more solvent-accessible in monomer as compared to the tetramer (Table 3), which perhaps accounts for the red shift of the fluorescence in the former. However, as discussed later, the emission λmax of SBA monomer is considerably blue-shifted as compared to the unfolded monomer (λmax of unfolded monomer is 357 nm); DLS studies of SBA indicate that its size is 4.0 ± 0.1 nm in the pH range 7.0–2.5, indicating that the species is a tetramer. At pH 2.25, there is a drop in size to 3.4 nm. Further lowering of the pH shows a species of size 3.0 ± 0.1 nm, which corresponds to that of the monomer. A temperature-dependent DLS (data not shown) was done on both forms of the protein at the temperature range at which experiments were conducted, wherein it was noted that the protein is a tetramer in the temperature range 283 K–323 K at pH 7.0 and a monomer in the range 283 K–308 K. Above 308 K the monomeric form (at pH 1.9) starts aggregating. A pH-dependent CD spectrum of SBA is shown in Fig. 4. The protein shows nearly similar secondary structure for both the tetrameric and monomeric forms (Fig. 4 a). The tertiary CD spectra are nearly similar in both the forms. However, at ∼290–295 nm, the monomer shows higher intensity compared to the tetramer (Fig. 4 b). This may be due to the fact that the tryptophan residues in the monomer become somewhat more exposed than those in the tetramer, as discussed above.
TABLE 3.
Accessibilities of the tryptophan residues in SBA monomer and SBA tetramer
| Tryptophan residue | % Accessible in monomer | % Accessible in tetramer |
|---|---|---|
| 8 | 17 | 6.4 |
| 60 | 16.4 | 16.4 |
| 132 | 31.6 | 31.6 |
| 154 | 5.2 | 5.2 |
| 203 | 43.8 | 15.2 |
| 226 | 1.6 | 1.6 |
The two-state nature of the transition was proved by the observation that fluorescence (at 370 nm) and CD (at 222 nm) melts were completely superimposable (Fig. 5 b). Thus the process of the denaturation of the folded monomers of SBA to their unfolded form: N ↔ U. The tetramer also exhibited a two-state denaturation transition, but with a higher Cm. The average Cm in the experimental domain for the monomer is 4.5 ± 0.2 M whereas that of the tetramer is at 5.7 ± 0.2 M GnCl at 2 μM protein concentration. On an average, the Cm for the monomer is less than that of the tetramer at the temperatures at which experiments were conducted, as shown in Fig. 7. Because the pH 1.9 species under consideration is a monomer, the Cm of the denaturant-induced transition should be concentration-independent; and indeed, that is the case. However, in the case of the tetramer, the Cm of the transition was highly concentration-dependent. The mean values of ΔGo and m in the experimental regime are 8.77 ± 1.02 kcal/mol and 1.91 ± 0.286 kcal/mol/M for the monomer, whereas those for the tetramer are 53.58 ± 2.49 kcal/mol and 6.1 ± 0.53 kcal/mol/M. However, the temperature of maximum stability, Ts, of the protein in both forms remains around the same temperature, i.e., at 308–310 K (Fig. 6). The equilibrium thermodynamic parameters for the unfolding of the monomer obtained from the fit of Eq. 7 are listed and compared to the tetrameric form in Table 2. The value of ΔCp for the monomer is 3.42 kcal/mol/K and that for the tetramer is 5.05 kcal/mol/K. Thus ΔCp values for the tetramer are only marginally greater than those for the monomers. This indicates that most of the opening of the hydrophobic core occurs due to the monomer unfolding, and that oligomerization does not involve much hydrophobic interaction. Privalov and Gill (1988) showed that the ΔCp/residue of the monomer is constant at 14 cal/°C per mole of amino acid. The SBA monomer has 235 amino acids, so, accordingly, the ΔCp for the unfolding of the monomer should be 3.29 kcal/mol/K, which is very close to the experimentally observed value (3.4 kcal/mol/K). This suggests that the monomers become totally unfolded during the experiment. An analysis of the residues at the interface of the protein was done, and it was seen that nearly 62% of the residues that line up the interfaces are polar in nature. The stretch of amino acids that line up the canonical interface are 1–10; six out of 10 amino acids in this stretch are polar in nature. Similarly, the residues that make up the non-canonical interface are 163–173 and 183–193. Here, also, 13 out of 21 amino acids are polar in character. This once again proves that subunit association in SBA is primarily due to ionic interactions rather than hydrophobic interactions, in contrast to the observations in most other cases, and that the hydrophobic interactions at the interface are, at most, contributing to one-third of the total stabilizing effort in SBA tetramer.
FIGURE 7.

The plot of Cm versus GdnCl concentration for the tetramer (at pH 7.0) and monomer (at pH 1.9) of SBA. The Cm for the tetramer was calculated according to the data in Sinha et al. (2005).
It is in order to mention here that the legume lectin monomer has two hydrophobic cores, one of which lies at the center of the three sheets, and the other in the curvature of the front β-sheet. Fig. 1 shows the disposition of the amino acids at the interface of the protein. It is clear from the figure that the subunit interactions at the canonical interface are polar in nature, in that they invoke mostly hydrogen bonding (i.e., the C=O of one β-sheet of one subunit forms a hydrogen bond with the N-H of a strand in the other subunit). Similarly, in the non-canonical interface, it is seen that there are quite a number of ionic interactions (Sinha et al., 2005). So, although there are hydrophobic residues present at the interface, their contribution in oligomerization is marginal. The difference in Tg in the two forms is ∼40 K. Although both forms of the protein fulfill one of the criterions of cold denaturation, such phenomenon is not seen in SBA in either of the forms in the temperature range amenable to experimentation. One of the conditions of cold denaturation—that the temperature of maximum stability, Ts, of the protein should be significantly above 273 K—is well satisfied by both the tetramer and the monomer. However, it fails to fulfill another important criterion for cold denaturation close to 273.15 K—namely, a low value for the ratio ΔH/ΔCp. The ratio is 48.03 and 100.1 for the monomer and tetramer, respectively, which is indeed very high for a protein to undergo cold denaturation in the region of 273.15 K.
It is known that the tetramer of SBA undergoes a cooperative two-state unfolding. However, for a detailed understanding of the forces involved in holding the tetrameric structure and to compare the stability of the native tetramer with the monomer, we have divided the total denaturation process into two discrete steps:  Here, the free energy associated with process A accounts for the disruption of the intersubunit interactions, and that of process B quantifies the unfolding of the monomeric state. Since ΔG is a state function, one can say that ΔGo (tetramer) = ΔGo(A) + 4 × ΔGo(B). Isothermal denaturation studies in the case of SBA show that, at 298 K, the ΔGo of unfolding of the tetramer is 59.25 kcal/mol, and that for the monomer is 9.48 kcal/mol. Hence the free energy for transition A is 21.33 kcal/mol, which is indeed a very pronounced contribution, and implies that the dissociation constant between the folded tetramer and folded monomers is ∼100 μM−3. This value for the equilibrium constant matches well with the values of the tetramers reported in the literature. For example, the β-chain tetramer of hemoglobin dissociates to its corresponding monomers with an equilibrium constant of 250 μM−3 (Yamaguchi and Adachi, 2002); similarly, the ATPase domain of SecA forms a tetramer with a dissociation constant of 63 μM−3 (Dempsey et al., 2002). Therefore, it means that at any concentration <5 μM the protein will exist as a monomer, and above that it will exist as a tetramer. SBA is thus even more stable as an oligomer as compared to SecA tetramer. A pH-dependent 1-anilino-8-naphthalenesulfonate binding study was done with SBA (data not shown). These studies showed negligible increase in intensity of 1-anilino-8-naphthalenesulfonate in the presence of SBA tetramer at pH 7, or on its dissociation to the folded monomer, or to its totally unfolded polypeptide chain. Thus, the monomer of SBA is compact like its tetramer and does not expose hydrophobic patches like the monomeric intermediate observed during unfolding of peanut agglutinin (Reddy et al., 1999). The literature has ample examples where unfolding of oligomers occurs via a monomeric or monomer-like intermediate (molten globule). In the legume lectin family too, we have encountered such transitions in peanut agglutinin (Reddy et al., 1999). However, the characterization of monomer in such cases becomes a very difficult task, due to the fact that the monomer is sparsely populated. In addition, equations describing a three-state transition are quite complicated to handle, because the boundary for the unfolding of the tetramer to the monomer is not well defined. Further, these monomers are not the nativelike monomers, but are partially denatured. Thus, one can cull very little information about the native properties of the monomers from these studies. In contrast, we have been able to characterize the SBA molecule as a tetramer and a monomer, which is almost unperturbed structurally (as evident from the CD spectrum). The monomer is quite stable as compared to naturally occurring monomers of similar size. For example, porcine odorant binding protein is 4.7 kcal mol−1 more stable with respect to its denatured state (Parisi et al., 2003). Similarly, the stabilities of CH2 antibody domain and phage P22 coat protein are, respectively, 3.76 kcal/mol and 5.8 kcal/mol (Feige et al., 2004; Anderson and Teschke, 2003). The dissociation of the tetramer into corresponding monomers most probably occurs because of repulsive interactions among the individual subunits with the increase in positive charge in the system. The total charge on the protein at different values of pH was calculated using the program PROTEIN CALCULATOR (http://www.scripps.edu/∼cdputnam/protcalc.html), which showed that, at pH 7, the charge on the protein is −6.6, which increases to 24.9 at pH 1.9.
Stabilities of oligomeric forms of several proteins with their corresponding monomers have been studied as a function of pH. For example, procaspase-3 and CcdB (controller of cell division or death B) exist as dimers at pH 7 and as monomers in the acidic pH range 3.5–4, whereas tryptophan-apo-repressor protein exists as dimer and monomer at pH 7 and 6–3.5, respectively (Bajaj et al., 2004). The ΔGo for the stability of procaspase-3, tryptophan-apo-repressor, and CcdB are 25 kcal/mol, 23 kcal/mol, and 21 kcal/mol, respectively, whereas the stabilities of the corresponding monomers of these proteins are 4 kcal/mol, 5.4 kcal/mol, and 9.2 kcal/mol, respectively. Thus dimerization contributes 17 kcal/mol in the case of procaspase-3, 12.5 kcal/mol for the tryptophan-apo-repressor, and 2.1 kcal/mol for CcdB protein. Thus, the stabilization force for SBA tetramer, on the other hand, is quite large—i.e., >21 kcal/mol, as compared to its monomeric form, thereby explaining its exceptional stability. This apart, a greater contribution of polar interactions to the stability of SBA distinguishes it from the above proteins as well as many members of the legume lectin family (Srinivas et al., 2001).
In summary, our work shows that SBA unfolds via a two-state pathway in both the monomeric and tetrameric states, and that these transitions are highly cooperative. Tetramerization endows the protein with a great deal of conformational stability. The oligomerization in legume lectins has important biological implications. The quaternary structure provides the protein with a requisite topology that helps in multivalent binding to cells. Although the monomeric unit in any lectin is capable of sugar binding, they are generally found in nature in their oligomeric state. Thus the nature has endowed the lectins with enormous stability by oligomerization so that they can efficiently carry out their biological functions.
Acknowledgments
The authors thank Shantanu Shankar Bhattacharya and Arpan Ghosh for their participation in the pH-dependent Sec studies.
This work has been supported by a grant to A.S. from the Department of Biotechnology, Government of India. S.S. thanks the Council of Scientific and Industrial Research, India for the award of a Senior Research Fellowship.
References
- Agashe, V. R., and J. B. Udgaonkar. 1995. Thermodynamics of denaturation of barstar: evidence for cold denaturation and evaluation of the interaction with guanidine hydrochloride. Biochemistry. 34:3286–3299. [DOI] [PubMed] [Google Scholar]
- Ahmad, N., V. R. Srinivas, G. B. Reddy, and A. Surolia. 1998. Thermodynamic characterization of the conformational stability of the homodimeric protein, pea lectin. Biochemistry. 37:16765–16772. [DOI] [PubMed] [Google Scholar]
- Anderson, E., and C. M. Teschke. 2003. Folding of phage P22 coat protein monomers: kinetic and thermodynamic properties. Virology. 313:184–197. [DOI] [PubMed] [Google Scholar]
- Bachhawat, K., M. Kapoor, T. K. Dam, and A. Surolia. 2001. The reversible two-state unfolding of a monocot mannose-binding lectin from garlic bulbs reveals the dominant role of the dimeric interface in its stabilization. Biochemistry. 40:7291–7300. [DOI] [PubMed] [Google Scholar]
- Bajaj, K., G. Chakshusmathi, K. Bachhawat-Sikder, A. Surolia, and R. Varadarajan. 2004. Thermodynamic characterization of monomeric and dimeric forms of CcdB (controller of cell division or death B protein). Biochem. J. 380:409–417. [DOI] [PMC free article] [PubMed] [Google Scholar]
- Barrick, D., and R. L. Baldwin. 1993. Stein and Moore Award address. The molten globule intermediate of apomyoglobin and the process of protein folding. Protein Sci. 2:869–876. [DOI] [PMC free article] [PubMed] [Google Scholar]
- Baues, R. J., and G. R. Gray. 1977. Lectin purification on affinity columns containing reductively animated disaccharides. J. Biol. Chem. 252:57–60. [PubMed] [Google Scholar]
- Bose, K., and A. C. Clark. 2005. pH effects on the stability and dimerization of procaspase-3. Protein Sci. 14:24–36. [DOI] [PMC free article] [PubMed] [Google Scholar]
- Dempsey, B. R., A. Economou, S. D. Dunn, and B. H. Shilton. 2002. The ATPase domain of SecA can form a tetramer in solution. J. Mol. Biol. 315:831–843. [DOI] [PubMed] [Google Scholar]
- Dessen, A., D. Gupta, S. Sabesan, C. F. Brewer, and J. C. Sacchettini. 1995. X-ray crystal structure of the soybean agglutinin cross-linked with a biantennary analog of the blood group I carbohydrate antigen. Biochemistry. 34:4933–4942. [DOI] [PubMed] [Google Scholar]
- Feige, M. J., W. Stefan, and J. Buchner. 2004. Folding mechanism of the CH2 antibody domain. J. Mol. Biol. 344:107–118. [DOI] [PubMed] [Google Scholar]
- Gittelman, M. S., and C. R. Matthews. 1990. Folding and stability of Trp aporepressor from Escherichia coli. Biochemistry. 29:7011–7020. [DOI] [PubMed] [Google Scholar]
- Hubbard, S. J. 1996. NACCESS, Ver. 2.1.1 Computer Program, Department of Biomolecular Sciences, UMIST, Manchester, UK.
- Lotan, R., H. W. Siegelman, H. Lis, and N. Sharon. 1974. Subunit structure of soybean agglutinin. J. Biol. Chem. 249:1219–1224. [PubMed] [Google Scholar]
- Matthews, C. R. 1993. Pathways of protein folding. Annu. Rev. Biochem. 62:653–658. [DOI] [PubMed] [Google Scholar]
- Mitra, N., N. Sharon, and A. Surolia. 2003. Role of N-linked glycan in the unfolding pathway of Erythrina corallodendron lectin. Biochemistry. 42:12208–12216. [DOI] [PubMed] [Google Scholar]
- Mitra, N., V. R. Srinivas, T. N. Ramya, N. Ahmad, G. B. Reddy, and A. Surolia. 2002. Conformational stability of legume lectins reflect their different modes of quaternary association: solvent denaturation studies on Concanavalin A and winged bean acidic agglutinin. Biochemistry. 41:9256–9263. [DOI] [PubMed] [Google Scholar]
- Nicholson, E. M., and J. M. Scholtz. 1996. Conformational stability of the Escherichia coli HPr protein: test of the linear extrapolation method and a thermodynamic characterization of cold denaturation. Biochemistry. 35:11369–11378. [DOI] [PubMed] [Google Scholar]
- Pace, C. N. 1990. Conformational stability of globular proteins. Trends Biochem. Sci. 15:14–17. [DOI] [PubMed] [Google Scholar]
- Parisi, M., A. Mazzini, R. T. Sorbi, R. Ramoni, S. Grolli, and R. Favilla. 2003. Unfolding and refolding of porcine odorant binding protein in guanidinium hydrochloride: equilibrium studies at neutral pH. Biochim. Biophys. Acta. 1652:115–125. [DOI] [PubMed] [Google Scholar]
- Privalov, P. L., and S. J. Gill. 1988. Stability of protein structure and hydrophobic interaction. Adv. Protein Chem. 39:191–235. [DOI] [PubMed] [Google Scholar]
- Reddy, G. B., V. R. Srinivas, N. Ahmad, and A. Surolia. 1999. Molten globule-like state of peanut lectin monomer retains its carbohydrate specificity. Implications in protein folding and legume lectin oligomerization. J. Biol. Chem. 274:4500–4503. [DOI] [PubMed] [Google Scholar]
- Schellman, J. A. 1990. Selective binding and solvent denaturation. Biophys. Chem. 37:121–140.2285775 [Google Scholar]
- Sinha, S., N. Mitra, G. Kumar, K. Bajaj, and A. Surolia. 2005. Unfolding studies on soybean agglutinin and Concanavalin-A tetramers: a comparative account. Biophys. J. 88:1300–1310. [DOI] [PMC free article] [PubMed] [Google Scholar]
- Srinivas, V. R., G. B. Reddy, N. Ahmad, C. P. Swaminathan, N. Mitra, and A. Surolia. 2001. Legume lectin family, the “natural mutants of the quaternary state”, provide insights into the relationship between protein stability and oligomerization. Biochim. Biophys. Acta. 1527:102–111. [DOI] [PubMed] [Google Scholar]
- Ullah, A. H. J., K. Sethumadhavan, and E. J. Mullaney. 2005. Monitoring of unfolding and refolding in fungal phytase (phyA) by dynamic light scattering. Biochem. Biophys. Res. Com. 327:993–998. [DOI] [PubMed] [Google Scholar]
- Yamaguchi, T., and K. Adachi. 2002. Hemoglobin equilibrium analysis by the multiangle laser light-scattering method. Biochem. Biophys. Res. Com. 290:1382–1387. [DOI] [PubMed] [Google Scholar]