Abstract
We studied the dipolar relaxation of the surfactant-water interface in reverse micelles of AOT-water in isooctane in the nanosecond and subnanosecond time ranges by incorporating the amphipathic solvatochromic fluorescent probes LAURDAN and TOE. A negative component was observed in the fluorescence decays in the red edge of the emission spectrum—the signature of an excited state reaction—with LAURDAN but not for TOE. The deconvolution of the transient reconstructed spectra of LAURDAN based on a model constructed by adding together three log-normal Gaussian equations made it possible to separate the specific dynamic solvent response from the intramolecular excited state reactions of the probe. The deconvoluted spectrum of lowest energy displayed the largest Stokes shift. This spectral shift was described by unimodal kinetics on the nanosecond timescale, whereas the relaxation kinetics of water-soluble probes have been reported to be biphasic (on the subnanosecond and nanosecond timescales) due to the heterogeneous distribution of these probes in the water pool. Most of this spectral shift probably resulted from water relaxation as it was highly sensitive to the water to surfactant molar ratio (w0) (60–65 nm at w0 = 20–30). A small part of this spectral shift (9 nm at w0 = 0) probably resulted from dipolar interaction with the AOT polar headgroup. The measured relaxation time values were in the range of the rotational motion of the AOT polar headgroup region as assessed by LAURDAN and TOE fluorescence anisotropy decays.
INTRODUCTION
Reverse micelles are mimic membrane-water interfaces. They consist of surfactant molecules with their polar headgroups pointing toward an internal aqueous space and their hydrocarbon tails projecting into the surrounding apolar solvent. By adopting such a structure, these entities are able to confine various numbers of water molecules (typically from <100 to several thousands), referred to as the water pool (Bhattacharyya and Bagchi, 2000; Levinger, 2002). Micellar parameters may depend on water content w0 (the water to surfactant molar ratio). The parameters affected include size (Keh and Valeur, 1981), surfactant polar group packing (Freda et al., 2003), microscopic polarity (Panja and Chakravorti, 2003), internal fluidity (Keh and Valeur, 1981), water mobility (Levinger, 2002), and proton transfer efficiency (Bhattacharyya, 2003). Reverse micelles form microemulsions in the nanometer range, which can be used for the incorporation of molecules such as peptides, proteins, or nucleic acids (Luisi et al., 1988; Nicot and Waks, 1996). This makes it possible to study the conformation and dynamics of these molecules in confined water by means of a variety of techniques (Davis et al., 1996; Fiori et al., 1999; Gallay et al., 1987; Marzola and Gratton, 1991; Shastry and Eftink, 1996; Wille and Prusiner, 1999). Functional interplay between water and enzymes can also be studied in these microreactors to elucidate the relations between solvent dynamics and enzymatic kinetics, stability, and structure (Orlich and Schomacker, 2002). It was recently shown that the incorporation of large proteins into reverse micelles in low viscosity fluids can be used to make such proteins amenable to structure determination by NMR spectroscopy (Gaemers et al., 1999). Reverse micelles are also powerful tools for the refolding and reactivation of proteins from inclusion bodies (Vinogradov et al., 2003).
Experimental characterization of the dynamics of these micelles and, particularly, of the water molecules they contain has often been based on optical techniques, including measurement of the fluorescence of polarity-sensitive probes (Chattopadhyay et al., 2002; Hungerford et al., 2002; Karukstis et al., 1996; Keh and Valeur, 1981; Riter et al., 1998; Sengupta and Sengupta, 2000; Sengupta et al., 2000). Such measurements have highlighted the diversity of water dynamics in these supramolecular entities, depending on the water/surfactant molar ratio, w0. The solvent response function, which describes the influence of solvent fluctuations on the emitting dipoles, displays multiexponential decays showing time constants of subpicoseconds to several hundreds of picoseconds, or even up to a few nanoseconds (Bhattacharyya, 2003; Bhattacharyya and Bagchi, 2000; Levinger, 2002; Nandi et al., 2000). Unlike bulk water, which has solvation dynamics of ∼1 ps or less (Jimenez et al., 1994; Pal and Zewail, 2004; Riter et al., 1998), confined water displays a restriction of motion by several orders of magnitude. The nanosecond component accounts for 15%–30% of the total solvent response (Bhattacharyya and Bagchi, 2000). Such slow solvation dynamics may have major consequences for the rate of polar reactions, such as proton transfer at the membrane-water interface (Bhattacharyya, 2003; Prats et al., 1986; Teissie et al., 1985).
However, most of these studies used probes displaying partitioning between the various regions of the micelle and different types of water within the water pool, thereby complicating the spectral and dynamic response to changes in the water to surfactant molar ratio w0 and their interpretation. This is particularly evident for aminonaphtalene derivatives like PRODAN (Karukstis et al., 1996).
Amphipathic probes can provide more specific information about the dynamics of the interface and its dependence on w0 because they are anchored at the interface and oriented. This is the case for LAURDAN, the lauryl derivative of PRODAN, which is anchored by its C12 hydrophobic tail in the hydrophobic part of membranes or micelles, with its fluorescent moiety pointing toward the polar region. Like PRODAN, it belongs to a diverse class of chromophores characterized by an electron donor and an acceptor connected to an aromatic spacer by a single bond. Such molecules therefore display a charge-transfer state upon excitation, resulting in a large increase in dipole moment. They are, therefore, extremely sensitive to dipolar relaxation in polar solvents (Balter et al., 1988; Weber and Farris, 1979), as shown by a significant so-called Stokes shift: the difference in energy between the initial absorption and the final emission photons. These properties have resulted in LAURDAN being widely used for studies of the dynamics of the membrane-water interface (Bagatolli and Gratton, 2000; Fiori et al., 1999; Parasassi et al., 1991; Viard et al., 1997). This molecule is also weakly fluorescent in hydrocarbon solvents (Lissi et al., 2000; Viard et al., 1997). The ground state as well as the excited state properties of PRODAN in interaction with polar solvents have been studied by molecular orbital calculations (Ilich and Prendergast, 1989; Parusel, 1998). These studies and recent experiments with constrained derivatives (Lobo and Abelt, 2003) have shown that a TICT in which the N-dimethylamino group (N-TICT) stabilizes CT in the excited state is unlikely and that the emissive state could be O-TICT (twisted propionyl group). TOE, an amphipathic derivative of tryptophan, has also been used to characterize membrane and micelle dynamics (Chattopadhyay et al., 1997; de Foresta et al., 1999; Ladokhin and Holloway, 1995; Sengupta and Sengupta, 2000; Tortech et al., 2001; Yeager and Feigenson, 1990). The spectroscopy of tryptophan has been extensively studied and its solvatochromic properties as well (Lakowicz, 1999), owing to its importance in protein dynamics studies.
In this work, we used LAURDAN and TOE as specific reporters of the surfactant-water interface dynamics of reverse micelles of AOT-water in isooctane. This system should give more specific information than has been obtained with water-soluble solvatochromic probes, which may be located in different regions of the water pool. LAURDAN has complex photophysics. We therefore carried out a detailed time-resolved fluorescence study, involving deconvolution of the TRES with a log-normal Gaussian model, to separate the specific solvent response from the intramolecular excited state reactions. The major conclusion of this study is that dipolar relaxation at the surfactant-water interface is characterized by a single time constant in the nanosecond time range of the order of magnitude of the rotational motion of the AOT polar headgroup region. No subnanosecond relaxation component was found, in contrast to the results obtained with water-soluble probes.
MATERIALS AND METHODS
Chemicals
AOT was purchased from Sigma (St. Louis, MO) and used as supplied. Isooctane, cyclohexane, and ethanol (Uvasol grade) were from Merck (Darmstadt, Germany). The white oil Primol 352 (Viard et al., 1997) was obtained from ESSO (Mont Saint-Aignan, France). LAURDAN was purchased from Molecular Probes (Eugene, OR). TOE was obtained from Sigma. All these chemicals were used without further purification.
Preparation of AOT-isooctane reverse micelles
Reverse micelles of AOT and water in isooctane were prepared at room temperature as previously described (Gallay et al., 1987). Briefly, a stock solution of 0.1 M AOT in isooctane was prepared, and the desired volume of MilliQ (Millipore, Bedford, MA) purified water was added with a Hamilton syringe. The sample was shaken until it became clear. The water/surfactant molar ratio, w0, was varied from 0 (no added water) to 33. The reverse micelles were labeled with 10 μM LAURDAN or TOE.
Fluorescence excited-state lifetime and anisotropy measurements
Fluorescence intensity decays were obtained by the time-correlated single photon counting technique (TCSPC) from the polarized components Ivv(t) and Ivh(t) on the experimental setup installed on the SB1 window of the Super-ACO synchrotron radiation machine (Anneau de Collision d'Orsay), which has been described elsewhere (Vincent et al., 1995). The storage ring provides a light pulse with a FWHM of ∼500 ps at a frequency of 8.33 MHz for a double bunch mode. A microchannel plate (model R3809U-02, Hamamatsu, Shizuoka, Japan) was used to detect the fluorescence photons. Data for Ivv(t) and Ivh(t) were stored in separated 2K memories of a plug-in multichannel analyzer card (Canberra, France) in a microcomputer. The microcomputer controlled the sampling of the data. They were automatically collected by measuring, in alternation, the scattering of a glycogen solution for 30 s at the emission wavelength, then the parallel and perpendicular components of polarized fluorescence decay for 90 s. Time resolution was usually in the range of 10–20 ps per channel. The shortest excited state lifetime the instrument can resolve is in the range of 20–30 ps.
Cryogenic experimental conditions were obtained with a variable temperature Janis cryostat VPF-100 (Janis Research, Wilmington, MA). This system consists of a cold finger, a radiation shield, an aluminum vacuum shroud, and a sealed electrical port. It uses liquid nitrogen in conjunction with a thermal impedance and a built-in heater to operate at any stabilized temperature (within 0.5 K) between 83 and 320 K (Vincent et al., 2000).
Analyses of fluorescence intensity decay, I(t) reconstructed from the parallel Ivv(t) and perpendicular Ivh(t) polarized components, as sums of exponentials were performed by the MEM as previously described (Vincent et al., 2000). MEMSYS 5 can handle a 150-dimensioned vector, with no a priori assumption concerning the sign of each amplitude, if required. This option was used in cases in which classical analysis with exclusively positive amplitudes provided poor results in terms of χ2 values and shape of the deviation function of the weighted residuals.
A classical anisotropy model, in which each lifetime may be coupled to any rotational correlation time, was used to resolve the polarized fluorescence decays. Calculations were carried out on a DEC Vax station 4000/90 with a set of 150 independent variables (equally spaced on a logarithmic scale). The programs, including the MEMSYS 5 subroutines (MEDC Ltd., Cambridge, UK), were written in double-precision FORTRAN 77.
TRES collection and analysis
LAURDAN TRES were reconstructed in each set of experimental conditions from 33 individual decays as a function of emission wavelength from 370 to 530 nm (bandwidth 5 nm) with 5 nm increments. The MEM program was used to fit individual curves, using the negative amplitude option. At each wavelength, the integral of each fluorescence decay curve was normalized using the corresponding steady-state intensity value obtained on the same instrument in the same optical conditions. No correction was required for Raman scatter of isooctane (peak at 391 nm) since its amplitude never exceeded 3% of the fluorescence signal at this wavelength. As we collected the vertical (Ivv) and horizontal (Ivh) fluorescence intensity components and took into account the β-correction factor, the calculated impulse fluorescence intensity: (Ivv (t) + 2 βIvh(t)) and the steady-state intensity: (Ivv + 2βIvh) values are de facto corrected for the difference in transmission of the polarized light components by the optics. We used ∼20 ps steps for spectral shift construction. For a quantitative description of the spectral shift, frequency barycenters were computed from the smoothed raw spectra.
The steady-state or time-resolved fluorescence spectra were analytically described using up to three 4-parameter log-normal functions (a skewed Gaussian equation) of the following form (Burstein and Emelyanenko, 1996):
 |
Here, Im = I(νm) is the maximal fluorescence intensity; νm is the wavenumber of the band maximum (peak); ρ = (νm − ν−)/(ν+ − νm) is the band asymmetry parameter; ν+ and ν− are the wavenumber positions of left and right half-maximal amplitudes; a is a function limiting point: a = νm + FWHM ρ/(ρ2 − 1); the bandwidth FWHM = ν+ − ν−.
We fitted a linear combination of this analytical model to the transient emission spectra by means of a least-squares regression method, using a Gauss-Marquard algorithm. The fit efficiency was ensured by the minimization of the squared residuals. This procedure was performed in an iterative manner: the parameters resulting from analysis of the spectrum at time t being used as the starting parameters for the spectrum at time t + Δt.
RESULTS
Steady-state and time-resolved fluorescence intensity of TOE in AOT reverse micelles
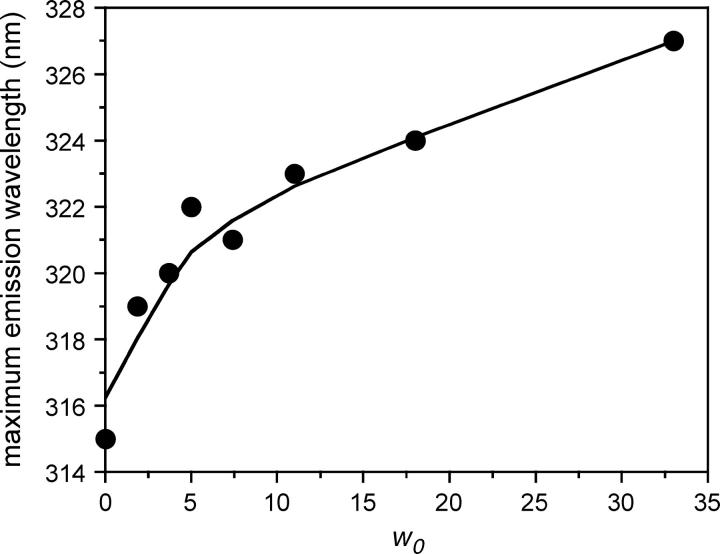
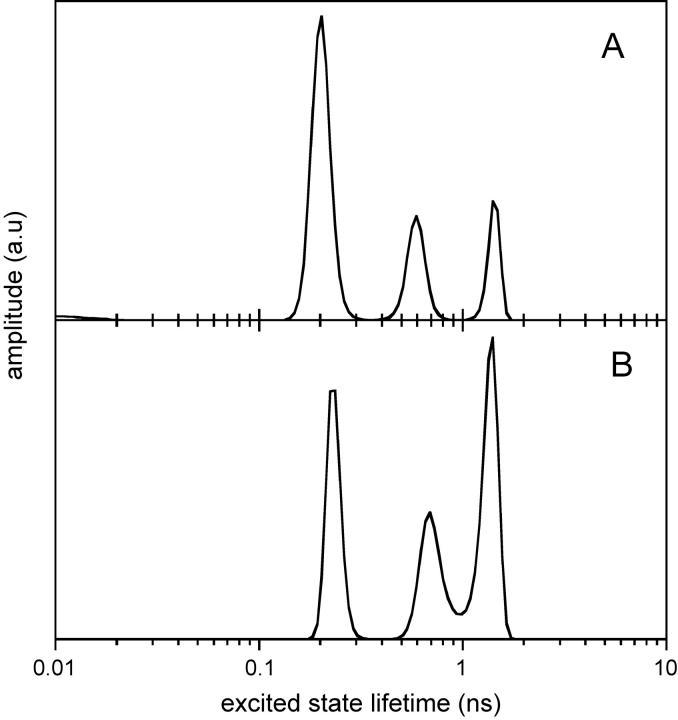
The steady-state fluorescence emission spectrum of TOE in reverse micelles displayed a maximum at 319 nm for a w0 = 1.9 and at 327 nm for a w0 of 32 (Fig. 1). It emitted more in the blue than in direct micelles (335 nm) of various surfactants in water (dodecylmaltoside, octa(ethyleneglycol) dodecyl monoether, or dodecyl phosphocholine; Chattopadhyay et al., 1997; de Foresta et al., 1999; Tortech et al., 2001) or in phospholipid bilayers (Ladokhin and Holloway, 1995; Yeager and Feigenson, 1990) and than N-acetyl tryptophanamide in bulk water (∼357 nm; Gallay et al., 1987; Lakowicz, 1999). This indicates that the indole ring detects solvent molecules moving slowly in the surfactant polar region of the reverse micelles at low w0 and more mobile solvent molecules at higher w0. We then carried out time-resolved fluorescence measurements to estimate the time range of dipolar dynamics as a function of w0. The TOE fluorescence decays analyzed by MEM showed excited state lifetime heterogeneity in the subnanosecond and nanosecond time ranges, regardless of emission wavelength at all w0 (see Fig. 2 for an example of the lifetime distributions at w0 = 11). No significant difference in lifetime values was observed, but the two longest lifetimes displayed significantly larger amplitudes at long emission wavelength. No time constants associated with negative amplitude were found in the red edge of the fluorescence emission spectrum at any value of w0 (Fig. 2). The heterogeneity of TOE fluorescence decay, with three lifetime components in the subnanosecond and nanosecond time ranges, may obscure a component with a negative amplitude. Rotamers undergoing slow exchange on the nanosecond timescale probably account for this fluorescence heterogeneity (Chen et al., 1991; Liu et al., 2002; Petrich et al., 1983; Szabo and Rayner, 1980).
FIGURE 1.
Variations of the maximum emission wavelength of TOE in AOT-water reverse micelles in isooctane as a function of w0. Excitation wavelength: 280 nm. Experiments were performed at 20°C.
FIGURE 2.
MEM recovered excited state lifetime distribution of TOE in AOT-water reverse micelles in isooctane at w0 = 11. MEM analysis was performed on the fluorescence intensity T(t) reconstructed from the parallel and perpendicular polarized components Ivv(t) and Ivh(t) such that  where τ is the excited state lifetime, α(τ) is its amplitude, and βcorr is a correction factor accounting for the difference in transmission of the Ivv(t) and Ivh(t) components. (A) Emission wavelength: 305 nm, τ1 = 0.19 ns; τ2 = 0.56 ns; τ3 = 1.40 ns; α1 = 0.63; α2 = 0.21; α3 = 0.16; (B) Emission wavelength: 367 nm, τ1 = 0.23 ns; τ2 = 0.72 ns; τ3 = 1.37 ns; α1 = 0.32; α2 = 0.28; α3 = 0.40. Excitation wavelength: 280 nm. Experiments were performed at 20°C.
LAURDAN in AOT-water reverse micelles: the steady-state spectral deconvolution approach
The steady-state fluorescence emission spectrum of LAURDAN embedded in AOT-water reverse micelles in isooctane was recorded as a function of w0, the surfactant to water molar ratio (Fig. 3). Emission spectra exhibit increased complexity with reverse micelle water content. Fluorescence intensity at the emission peak decreased with reverse micelle water content, but no major change occurred in the spectrum peak position, which remained centered around 420 nm. Nevertheless, the shapes of the emission spectra obtained differed according to water content. In particular, the shoulders located at the reddest and bluest edges were more pronounced at high w0 values. The quantum yield values relating to the total emission of LAURDAN in AOT reverse micelles at various w0 values were calculated by comparison with a reference probe of known quantum yield, solvated in a given medium, here, the 1,1,4,4-tetraphenylbutadiene dissolved in cyclohexane. They decreased continuously as a function of the amount of water contained in the reverse micelles (from 0.239 to 0.157 for w0 = 0–33, respectively). The quantum yields corresponding to the intermediate w0 values are listed in Table 1.
FIGURE 3.
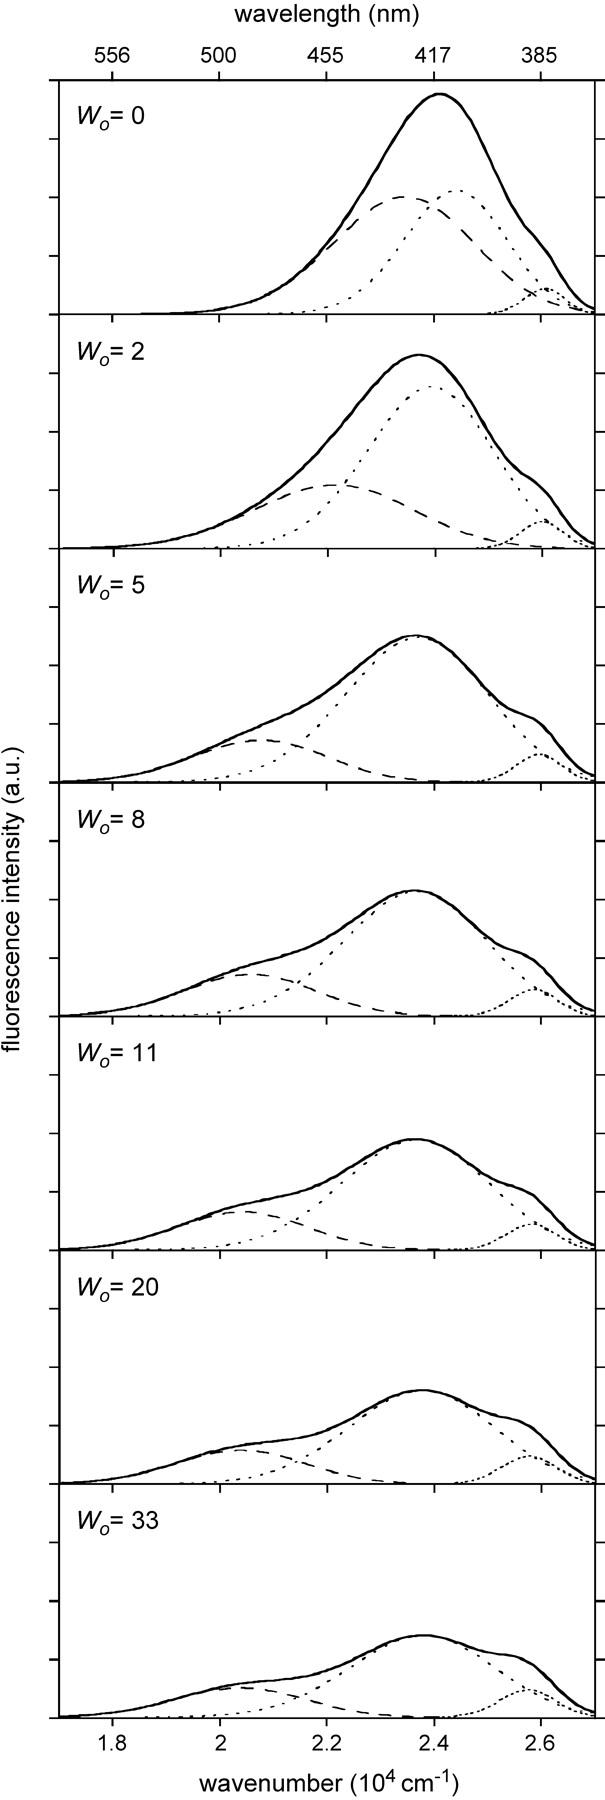
Steady-state fluorescence spectra (solid lines) of LAURDAN in AOT-isooctane reverse micelle as a function of their water content, w0, and deconvolution into three log-normal Gaussian curves (dotted lines, short-dashed lines, and long-dashed lines). The parameters of the raw and fitted Gaussian curves are listed in Table 1. The excitation wavelength was set at 350 nm, and the spectra were recorded at 20°C.
TABLE 1.
The steady-state fluorescence spectrum parameters of LAURDAN in AOT-isooctane reverse micelles as a function of w0
| Total emission
|
Log-normal Gaussian No. 1
|
Log-normal Gaussian No. 2
|
Log-normal Gaussian No. 3
|
|||||||||||||||||
|---|---|---|---|---|---|---|---|---|---|---|---|---|---|---|---|---|---|---|---|---|
| w0 | Im | νm (104cm−1) | λm (nm) | FWHM (104cm−1) | QY | Im1 | νm1 (104cm−1) | λm1 (nm) | FWHM1 (104cm−1) | QY1 | Im2 | νm2 (104cm−1) | λm2 (nm) | FWHM2 (104cm−1) | QY2 | Im3 | νm3 (104cm−1) | λm3 (nm) | FWHM3 (104cm−1) | QY3 |
| 0 | 1.883 | 2.410 | 415 | 0.2922 | 0.239 | 0.214 | 2.608 | 383 | 0.873 | 0.007 | 1.054 | 2.443 | 409 | 0.2237 | 0.096 | 1.013 | 2.345 | 426 | 0.3082 | 0.136 |
| 2 | 1.658 | 2.375 | 421 | 0.3419 | 0.263 | 0.228 | 2.603 | 384 | 0.925 | 0.008 | 1.381 | 2.396 | 417 | 0.2771 | 0.160 | 0.543 | 2.217 | 451 | 0.3498 | 0.095 |
| 5 | 1.254 | 2.364 | 423 | 0.3922 | 0.235 | 0.237 | 2.597 | 385 | 0.986 | 0.009 | 1.236 | 2.372 | 422 | 0.3136 | 0.167 | 0.358 | 2.078 | 481 | 0.2933 | 0.059 |
| 8 | 1.076 | 2.364 | 423 | 0.4319 | 0.212 | 0.224 | 2.587 | 387 | 0.1060 | 0.009 | 1.064 | 2.368 | 422 | 0.3120 | 0.144 | 0.355 | 2.058 | 486 | 0.2898 | 0.059 |
| 11 | 0.949 | 2.364 | 423 | 0.4563 | 0.194 | 0.218 | 2.584 | 387 | 0.1098 | 0.009 | 0.941 | 2.370 | 422 | 0.3213 | 0.132 | 0.323 | 2.045 | 489 | 0.2848 | 0.054 |
| 20 | 0.806 | 2.375 | 421 | 0.4490 | 0.172 | 0.237 | 2.578 | 388 | 0.1210 | 0.010 | 0.802 | 2.376 | 421 | 0.3192 | 0.112 | 0.289 | 2.040 | 490 | 0.2878 | 0.050 |
| 33 | 0.706 | 2.381 | 420 | 0.4558 | 0.157 | 0.239 | 2.577 | 388 | 0.1236 | 0.011 | 0.701 | 2.382 | 420 | 0.3197 | 0.100 | 0.254 | 2.038 | 491 | 0.2916 | 0.046 |
The parameters result from their log-normal Gaussian deconvolution (see Materials and Methods). Quantum yield (QY) was calculated taking 1,1,4,4-tetraphenylbutadiene in cyclohexane as the reference compound (quantum yield of 0.60; Berlman, 1971). The QY for each emitting species is the QY for total emission weighted by the emitting surface spectrum of that species. A sum of three elemental log-normal Gaussian curves (see Materials and Methods) was used for the deconvolution.
We applied a spectral deconvolution method, using log-normal Gaussian distributions, a formalism suitable for fluorescence spectroscopy (Burstein and Emelyanenko, 1996), itself originating from that developed for absorption spectroscopy (Siano and Metzler, 1969). Deconvolution of the steady-state emission spectra of LAURDAN in AOT-isooctane reverse micelles, at various w0 values, required three elemental log-normal Gaussian distributions, regardless of water content (Fig. 3). Based on the classical deactivation pathway of the excited state of the LAURDAN probe, it seems likely that these deconvoluted spectra might be related to one of the sequential intermediate excited states. The intermediate excited states described for the two species with spectra furthest in the blue are the LE state and a CT state (Rollinson and Drickamer, 1980). The red-shifted fluorescence, for PRODAN, has been assigned to a highly polar TICT (Nowak et al., 1986; Bunker et al., 1993), involving the dimethylamino group (N-TICT), the propionyl rotations (O-TICT) or both (Parusel, 1998). Considerations based on rotational energy barriers led Parusel to suggest that O-TICT was the most likely candidate. However, other authors have suggested that O-TICT is unlikely to be involved for energetic reasons (Ilich and Prendergast, 1989) and that a photo-induced structural change, involving deformation of the aromatic ring stabilizing the ICT, is more likely. Moreover, this highly polar CT state is strongly stabilized in polar solvent by dipolar interactions with it. Thus, at least three different emitting species are likely to occur corresponding to the LE, CT, and CTR states (Sire et al., 1996).
The individual parameters of each of the three elemental log-normal Gaussian curves describing the steady-state fluorescence emission spectrum of LAURDAN, as a function of w0, are reported in Table 1. The Gaussian curve peaking furthest into the blue corresponds to LE state emission, and its deactivation pathway is known to be insensitive to the solvent polarity (Rollinson and Drickamer, 1980). Consistently, its emission energy appeared to be almost invariant in this study (383–388 nm; Table 1). Depending on w0, there was a moderate red shift in the peak position (409–422 nm) of the intermediate CT-related spectrum (Table 1). In contrast, the reddest deconvoluted spectra displayed the largest shifts of emission peak (426–491 nm) for the range of w0 explored (Table 1).
However, these parameters are probably time averaged owing to the presence of a nanosecond TDFSS when LAURDAN is solvated in viscous polar media (Chapman and Maroncelli, 1991). A similar situation occurs when LAURDAN is embedded in membranes or micellar systems (Lissi et al., 2000; Parasassi et al., 1991; Viard et al., 1997) or bound to other molecular assemblies of biological interest (Bhattacharyya, 2003; Castner et al., 1987). Thus, in reverse micelles, which are viscous and bear permanent electric charges or dipoles (projecting from AOT and/or water molecules), LAURDAN should display transient spectral changes. These changes (peak position or FWHM), reflecting both internal relaxation and solvent dielectric relaxation processes, are averaged in the steady-state emission spectra. This is illustrated in the next section by analysis of the transient emission of LAURDAN dissolved in a viscous polar medium.
Modeling the transient fluorescence emission spectra of LAURDAN in ethanol at low temperature
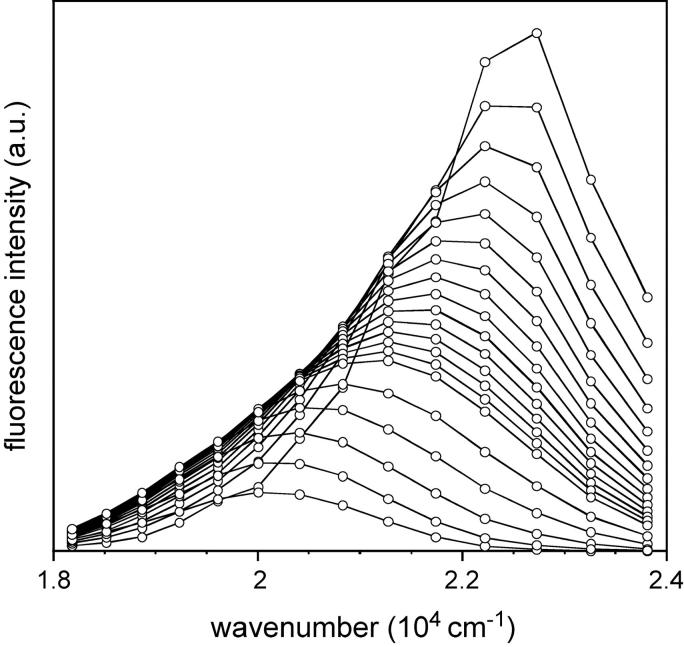
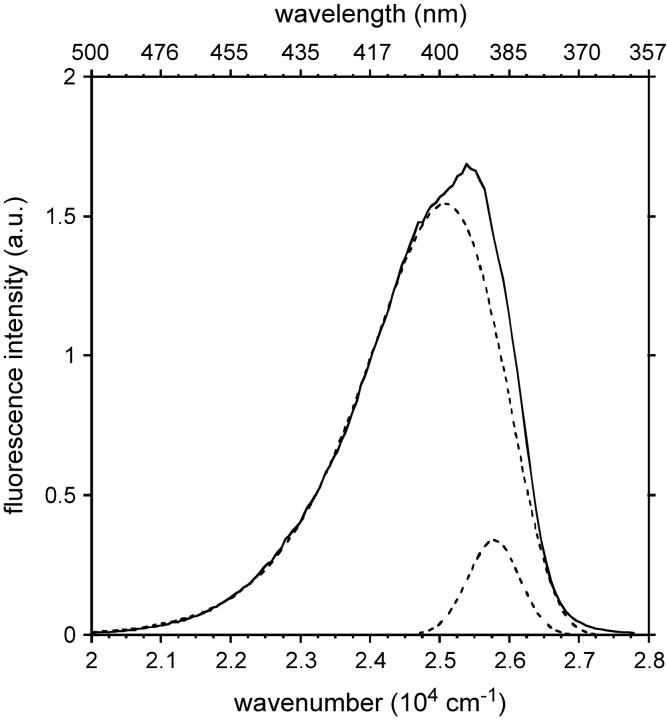
We generated TRES for LAURDAN dissolved in a viscous polar medium, ethanol, at −80°C. As previously shown (Viard et al., 1997), fluorescence intensity decays at the blue edge of the emission spectrum were characterized by one or two short time constants (∼100 ps), whereas those at the red edge of the emission spectrum had a time constant associated with a negative amplitude (data not shown). Transient emission spectra were reconstructed from intensity decays at the various emission wavelengths as described in Materials and Methods (Vincent et al., 1995). Log-normal Gaussian deconvolution of each transient spectrum provided a satisfactory fit with one and only one log-normal Gaussian (Fig. 4). A red shift of the emission spectrum peak, from 440 nm at time 0 to 498 nm at infinite time with respect to the excited lifetime, was observed, consistent with previously published data (Viard et al., 1997).
FIGURE 4.
Transient spectra of LAURDAN in ethanol at −80°C. Excitation wavelength: 350 nm. The decreasing spectra shown correspond to equidistant time steps starting from 0.0 to 1.01 ns for the first 15 spectra and to 1.39, 1.80, 3.02, 3.40, and 4.84 ns for each of the last five spectra, respectively.
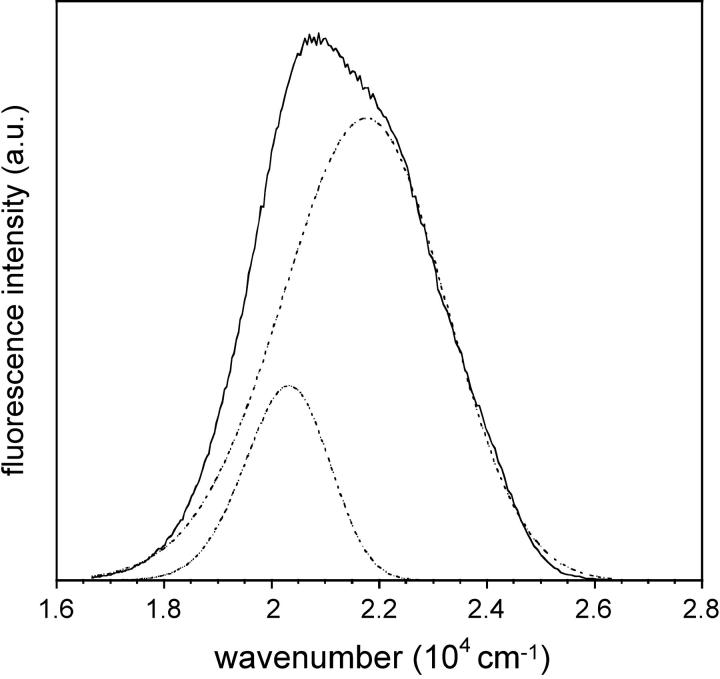
When recorded in the same temperature conditions (−80°C), the steady-state fluorescence emission spectrum of LAURDAN displayed apparent emission heterogeneity (Fig. 5). Its deconvolution with log-normal Gaussian distributions led to the recovery of two spectra (Fig. 5). This apparent dual emission does not result from species heterogeneity. It is the signature of a single emitting species (as shown by deconvolution of the TRES) subjected to a temporal shift related to a solvent relaxation process (Chapman and Maroncelli, 1991) occurring over a timescale of the same order of magnitude (τr = 1.1 ns) as the excited state lifetime of LAURDAN (τ = 3.4 ns).
FIGURE 5.
Steady-state fluorescence spectrum of LAURDAN in ethanol at −80°C (solid line) and their deconvolution into two log-normal Gaussian curves (dotted lines). Excitation wavelength: 350 nm.
LAURDAN in AOT-water reverse micelles: the TRES approach
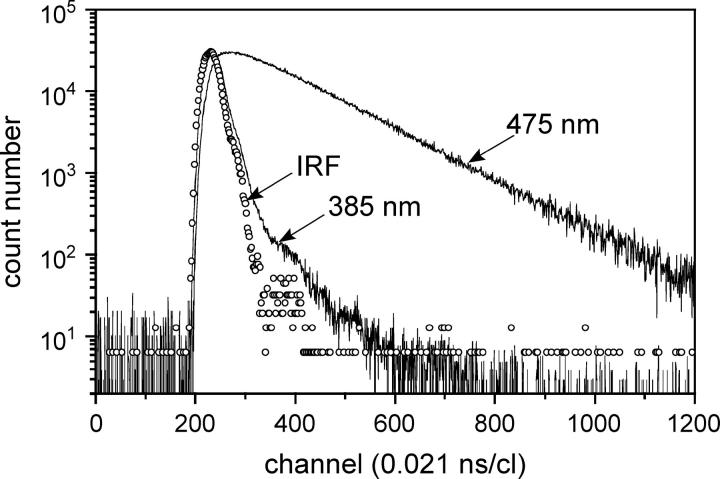
The transient emission spectra of LAURDAN in AOT-water reverse micelles were reconstructed as a function of w0. For each w0 value, the fluorescence intensity decays of LAURDAN were recorded as a function of emission wavelength. An example of fluorescence decays at the blue and red edges of the fluorescence emission spectrum is shown in Fig. 6. Very rapid decay was observed at the blue edge, whereas the decay at the red edge was much longer. We used the MEM program, with the negative amplitude option, to fit each individual decay, making it possible to obtain pseudoexcited state lifetime profiles (Fig. 7). We investigated the general features of these pseudoexcited state lifetime distributions in the presence of water. With wavelengths at the blue edge of the emission spectrum (370–470 nm), these lifetimes were distributed over 0.1–0.2 ns whatever the w0. At wavelengths >470 nm, for all values of w0 except w0 = 0, the distribution displayed a time constant of 0.8–1.5 ns (depending on w0), associated with a negative preexponential term that could be interpreted as the signature of an excited state reaction. A third and single positive component was present at emission wavelengths exceeding 420 nm, and its corresponding lifetime value was constant between 420 and 450 nm (at ∼1 ns), then increased and stabilized in the red edge of the emission spectrum (at 3–4 ns). For w0 = 0, only two components with lifetimes values of ∼1 and ∼3 ns in the 395–435 and 420–500 nm ranges respectively, were observed (Fig. 7).
FIGURE 6.
Fluorescence intensity decays of LAURDAN in AOT-water reverse micelles in isooctane for w0 = 11 at the blue (385 nm) and red (475 nm) edges of the fluorescence emission spectrum. IRF: instrument response function. Excitation wavelength: 350 nm. Experiments were performed at 20°C.
FIGURE 7.
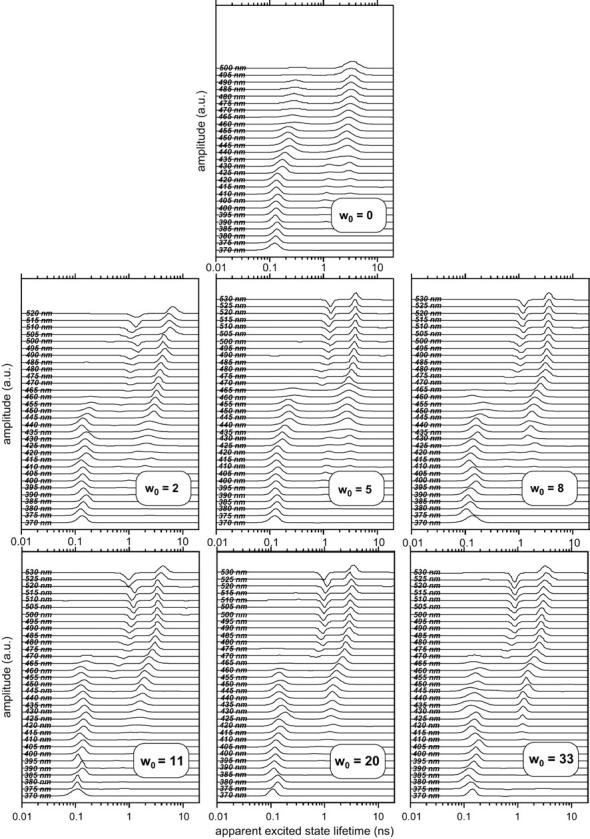
MEM recovered lifetime profiles of LAURDAN in AOT-water reverse micelles in isooctane as a function of the emission wavelength. Excitation wavelength: 350 nm. For each w0, the profiles at each wavelength have been arbitrarily shifted by the same distance in each case to render the figure clearer. Experiments were performed at 20°C.
Strictly speaking, we did not recover excited state lifetime profiles, as if there were no excited state reaction. However, these pseudolifetime amplitude profiles are valuable mathematical solutions optimizing the description of the fluorescence decays of the probe for each emission wavelength. We therefore used them as a tool for TRES rebuilding.
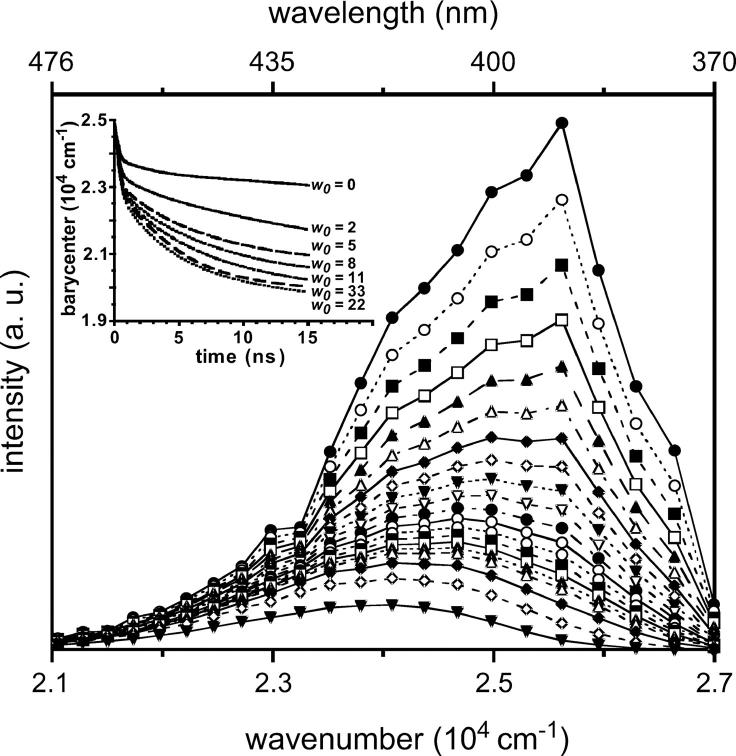
Raw TRES data are shown in Fig. 8 for w0 = 0, together with the changes over time of their barycenter for each w0 (Fig. 8, inset). The spectrum at t = 0 displayed a maximum at 25,420 cm−1 (393 nm), very close to the maximum of the steady-state emission spectrum in apolar solvent (25,773 cm−1, 388 nm; Catalan et al., 1991; Viard et al., 1997). Thus, our experimental setup resulted in the description of more than 98% of the TDFSS of LAURDAN in reverse micelles. A large spectral shift was observed, its amplitude depending on w0, increasing from 1874 cm−1 at w0 = 0 up to 5827 cm−1 at w0 = 33. MEM analysis of the maximum shift showed two relaxation times, regardless of w0, and a constant plateau. The shortest time constant value was in the subnanosecond time range (average value over the whole range of w0: 0.23 ± 0.04 ns), and the longest decreased from ∼4 to ∼2 ns with increasing w0 values. This dual behavior was similar to that observed for LAURDAN in phospholipid vesicles (Viard et al., 2001). We have to remark that the transient spectra were not symmetric, indicating an emission heterogeneity which is discussed in the following section.
FIGURE 8.
TRES of LAURDAN in AOT-water reverse micelles in isooctane at w0 = 0 reconstructed by steps of 21 ps, except for the last three spectra, which correspond to 420, 504, and 882 ps, respectively. Excitation wavelength: 350 nm. Experiments were performed at 20°C.
LAURDAN in AOT-water reverse micelles: time-resolved log-normal Gaussian spectral analysis
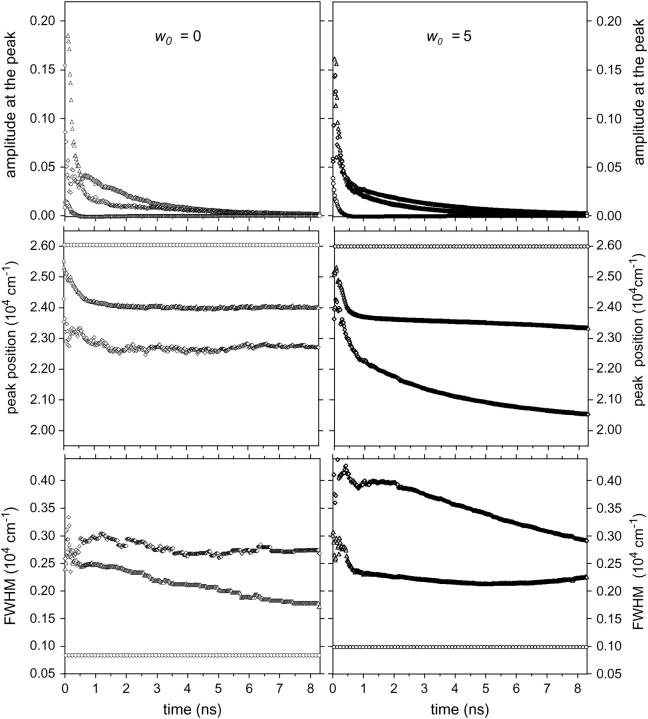
The total TDFSS, as analyzed here, probably included the effects of both the intrinsic excited state processes (CT formation) and the excited state solvent response. The next step was analysis of the transient fluorescence spectra of LAURDAN in reverse micelles as a function of w0, using log-normal Gaussian curves, to differentiate the TDFSS due to intra- and intermolecular excited state processes. We fitted a model comprising the sum of three log-normal Gaussian curves to fluorescence spectra of LAURDAN, as we had previously done for the steady-state spectra. The transient spectrum peak position, FWHM, and amplitude at the peak were determined as a function of time. Data are reported in Fig. 9 for two w0 values (0 and 5) by way of illustration. Concerning the first log-normal Gaussian curve, its peak position and FWHM, which we assumed to be associated with the initial part of the LE state reaction, were kept constant and fixed according to the values obtained in the spectral analysis of the steady-state emission spectra. The amplitude of the peak of Gaussian furthest into the blue was the only free parameter that could be adjusted. Skewness was also assumed to be invariant for the three log-normal Gaussian curves, and the value of this parameter corresponded to an almost symmetric spectrum. We were unable to fit curves to the transient fluorescence spectra of LAURDAN in the absence of this restrictive condition. This was probably due to a lack of conditioning of the system, particularly the small number of points (33) describing each transient spectrum with respect to the large number of free parameters involved in the chosen model (three amplitudes at the peak, two peak positions, and two FWHM).
FIGURE 9.
Parameters of the log-normal Gaussian curves as a function of time for two values of w0. Left panels: w0 = 0; right panels: w0 = 5; upper panels: amplitudes of the peak; middle panels: peak position; lower panel: FWHM. (Ο) log-normal Gaussian 1; (Δ) log-normal Gaussian 2; (⋄) log-normal Gaussian 3. Experiments were performed at 20°C.
The TDFSS kinetics of the peak frequency of each log-normal Gaussian curve (examples are shown in Fig. 9 for w0 values of 0 and 5) were modeled using an exponential decreasing term plus a plateau value. The exponential term τν2 of the intermediate spectrum was in the subnanosecond time range (0.3–0.4 ns), and did not depend on w0 (Table 2). That of the lowest energy spectrum (τν3) was in the nanosecond time range, with a relaxation time of 2.0 for w0 = 2 and 0.9 ns for w0 = 33. Table 2 lists the time-dependent spectral parameters for each log-normal Gaussian curve. The amplitude shift of the intermediate spectrum was ∼1750 ± 250 cm−1 (between 416 and 429 nm) and did not depend on w0, whereas that of the lowest energy spectrum increased with w0 from 492 cm−1 at w0 = 0 to ∼3000 cm−1 at values of w0 between 11 and 33 (Table 2). For species with intermediate and low levels of energy emission, it was not possible to generate an analytical description of the changes over time in FWHM, but two examples (w0 = 0 and 5) are given in Fig. 9. By working with normalized log-normal Gaussian functions for each of the emitting species, we were also able to estimate fractional quantum yields (QYGi) from the radiative constant (IGi, the preexponential term, which represents the radiative rate constant) and lifetime decays (τGi) (Chapman and Maroncelli, 1991). Whatever the w0 value, a general pattern of behavior was observed: the amplitude of the peak displayed rapid, subnanosecond decay followed by a phase of slower decay over several nanoseconds (Table 3). The biexponential behavior of the intensity decay of the intermediate energy spectrum (Gaussian No. 2) may result from competition between direct emission in the nonrelaxed state (∼0.1 ns) and emission in an intramolecular-relaxed state (∼1.2–2.1 ns), as in a PICT to TICT transition. The intensity decay of the lowest energy spectrum (Gaussian No. 3) was also biexponential (Table 3). In this case, competition would be expected to occur between direct emission in the TICT (0.1–0.4 ns) and emission in the solvent-relaxed state, which would display a lifetime of ∼3–4 ns (Table 3).
TABLE 2.
The spectral shape parameters of emission for LAURDAN in AOT-isooctane reverse micelles as a function of w0
| Log-normal Gaussian No. 1
|
Log-normal Gaussian No. 2
|
Log-normal Gaussian No. 3
|
|||||||||||||
|---|---|---|---|---|---|---|---|---|---|---|---|---|---|---|---|
| w0 | ν01* (104 cm−1) | λ01*(nm) | FWHM1* (104cm−1) | ν02 (104 cm−1) | λ02 (nm) | ν∞2 (104 cm−1) | λ∞2 (nm) | ν02−ν∞2(104 cm−1) | τν2 (ns) | ν03 (104 cm−1) | λ03 (nm) | ν∞3 (104 cm−1) | λ∞3 (nm) | ν02 −ν∞2 (104 cm−1) | τν3 (ns) |
| 0 | 2.611 | 383 | 0.873 | 2.5548 | 391 | 2.4027 | 416 | 0.1521 | 0.43 | 2.3149 | 432 | 2.2657 | 441 | 0.0492 | 0.50 |
| 2 | 2.611 | 383 | 0.925 | 2.5149 | 397 | 2.3640 | 423 | 0.1549 | 0.53 | 2.3109 | 432 | 2.1931 | 456 | 0.1118 | 1.62 |
| 5 | 2.611 | 383 | 0.986 | 2.5369 | 394 | 2.3499 | 426 | 0.1870 | 0.43 | 2.3755 | 421 | 2.0623 | 485 | 0.3132 | 1.91 |
| 8 | 2.611 | 383 | 0.1060 | 2.5416 | 393 | 2.3528 | 425 | 0.1888 | 0.34 | 2.2558 | 443 | 2.0326 | 492 | 0.2232 | 1.97 |
| 11 | 2.611 | 383 | 0.1098 | 2.5375 | 394 | 2.3347 | 428 | 0.2028 | 0.31 | 2.3884 | 419 | 2.0617 | 485 | 0.3267 | 1.02 |
| 20 | 2.611 | 383 | 0.1210 | 2.5266 | 396 | 2.3308 | 429 | 0.1958 | 0.44 | 2.3128 | 432 | 2.0144 | 496 | 0.2984 | 1.29 |
| 33 | 2.611 | 383 | 0.1236 | 2.5440 | 393 | 2.3437 | 427 | 0.2028 | 0.30 | 2.3125 | 433 | 2.0360 | 491 | 0.2765 | 0.89 |
The peak position (νm) parameter (see Materials and Methods, examples given in Fig. 9 for w0 = 0 and 5) of the intermediate and of the reddest emitting species (No. 2 and No. 3) are fitted using a model: νmi = (ν0i− ν∞i ) exp(−t/τνi) + ν∞i. The ν0 and ν∞ parameters represent the spectral peak position at time 0 and its plateau value, respectively.
We assumed a constant fluorescence peak emission value of 2.6 104 cm−1 (383 nm) for the component farthest in the blue part of the spectrum. The asymmetry parameters were chosen and kept constant such that the log-normal Gaussian distributions were almost symmetrical (skewness = 80).
TABLE 3.
The intensity parameters of emission for LAURDAN in AOT-isooctane reverse micelles as a function of w0
| Log-normal Gaussian No. 1
|
Log-normal Gaussian No. 2
|
Log-normal Gaussian No. 3
|
|||||||||||||
|---|---|---|---|---|---|---|---|---|---|---|---|---|---|---|---|
| w0 | IG1 | τG1 (ns) | QYG1 | IG2,A | τG2,A (ns) | QYG2,A | IG2,B | τG2,B (ns) | QYG2,B | IG3,A | τG3,A (ns) | QYG3,A | IG3,B | τG3,B (ns) | QYG3,B |
| 0 | 0.028 | 0.11 | 0.003 | 0.281 | 0.15 | 0.042 | 0.057 | 2.06 | 0.118 | 0.081 | 0.31 | 0.025 | 0.016 | 3.93 | 0.063 |
| 2 | 0.021 | 0.17 | 0.004 | 0.360 | 0.07 | 0.025 | 0.050 | 1.95 | 0.097 | 0.059 | 0.40 | 0.024 | 0.028 | 4.13 | 0.116 |
| 5 | 0.038 | 0.12 | 0.005 | 0.338 | 0.08 | 0.028 | 0.034 | 1.96 | 0.066 | 0.074 | 0.30 | 0.022 | 0.036 | 3.00 | 0.108 |
| 8 | 0.078 | 0.06 | 0.005 | 0.333 | 0.12 | 0.040 | 0.029 | 2.07 | 0.059 | 0.094 | 0.19 | 0.018 | 0.029 | 3.02 | 0.089 |
| 11 | 0.068 | 0.12 | 0.008 | 0.254 | 0.11 | 0.027 | 0.036 | 1.70 | 0.061 | 0.138 | 0.09 | 0.013 | 0.026 | 3.21 | 0.080 |
| 20 | 0.103 | 0.10 | 0.010 | 0.215 | 0.09 | 0.011 | 0.031 | 1.41 | 0.035 | 0.113 | 0.20 | 0.022 | 0.026 | 2.87 | 0.074 |
| 33 | 0.189 | 0.14 | 0.026 | 0.253 | 0.09 | 0.022 | 0.038 | 1.21 | 0.046 | 0.117 | 0.16 | 0.019 | 0.019 | 2.94 | 0.056 |
The TRES are fitted with a sum of three log-normal Gaussians. The Im parameters (see Materials and Methods, examples given in Fig. 9 for w0 = 0 and 5) of each log-normal Gaussian are fitted with an exponential (No. 1) Im1 = IG1 exp(−t/τG1) or a biexponential (No. 2 and No. 3) model Imi = IGi,A exp(−t/τGi,A) + IGi,B exp(−t/τGi,B). We assumed a constant fluorescence emission at 2.6 104 cm−1 (383 nm) for the component farthest in the blue part of the spectrum. The asymmetry parameters were chosen and kept constant such that the log-normal Gaussian curves were almost symmetrical (skewness = 80).
Rotational dynamics of LAURDAN and TOE in AOT-water reverse micelles
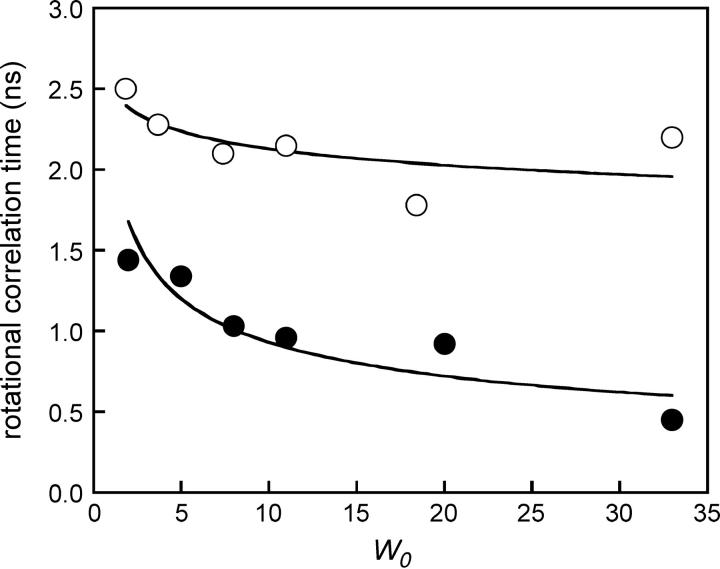
The Brownian rotational correlational time values, calculated for the whole reverse micelle from the Perrin-Einstein relationship: θ = (ηV)/(RT) exceeded 10 ns (Keh and Valeur, 1981). V is the hydrodynamic volume of the micelle, η the viscosity of isooctane, and T the absolute temperature in Kelvin scale. In this study, we investigated the rotational dynamics of LAURDAN and TOE in reverse micelles by time-resolved measurements of fluorescence anisotropy as a function of w0. MEM analysis of the anisotropy curves indicated that there were two rotational correlation times for both probes: a major one of ∼0.5–2.0 ns for LAURDAN and of 2.0–2.5 ns for TOE, depending on w0 (Fig. 10) and a second one in the subnanosecond range. These values for LAURDAN and TOE are in the range of the dynamics of the AOT polar headgroup region, as estimated by 13C NMR (Eicke and Zinsli, 1978), dielectric permittivity (Freda et al., 2002), and quasielastic neutron scattering (Freda et al., 2003). Both probes also probably displayed faster rotational motions. Indeed, for LAURDAN, the anisotropy values at time 0 (At=0 = 0.233) were lower than the intrinsic anisotropy value A0 measured in vitrified solvent (A0 350 nm = 0.361). TOE behave similarly: At=0 varied from 0.125 to 0.080 with increasing w0, whereas the fundamental anisotropy value was A0 280 nm = 0.173. This was probably due to differences in the librational motion of the fluorescent aromatic rings for both probes.
FIGURE 10.
Rotational correlation time values of TOE (Ο) and LAURDAN (•) as a function of w0. Excitation wavelength: 350 nm. Experiments were performed at 20°C.
DISCUSSION
Ultrafast dynamics is a property specific to pure water and has been studied extensively by solvation dynamics (Bhattacharyya and Bagchi, 2000; Pal and Zewail, 2004). The fluorescence technique has shown that confined water displayed a very slow component, not present in bulk water, in addition to faster relaxations, which are nonetheless still slower than those observed in bulk water (Bhattacharyya and Bagchi, 2000). The heterogeneous dynamics of confined water may have a physical meaning but may also arise from limitations of the techniques used to measure it. For example, dielectric and NMR measurements discriminate poorly between the different types of water present in microemulsions. Fluorescence measurements with solvatochromic water-soluble solutes may also be partly biased by i), the photophysics of the probe, and ii), heterogeneity in the location of the probe in the water pool of the reverse micelles (Bhattacharyya, 2003). The use of more precisely located probes could provide more specific information about interface dynamics. In this study, we aimed to obtain specific dynamic data for a selected region of the reverse micelle: the surfactant-water interface. We monitored its dynamics with the amphipathic probes LAURDAN and TOE.
LAURDAN belongs to the same family as PRODAN, DANCA, or DANSYL-derivatives, all of which display photogenerated charge separation in the excited state, maximized by the formation of a TICT, which uncouples the donor and acceptor (Grabowski et al., 1979). These molecules therefore display complex photophysics even in the absence of solvent relaxation, which must be taken into account when trying to separate the specific solvent dynamics response from intramolecular conformational excited state reactions. Careful analysis of absorption, emission, and time-resolved emission spectra is therefore required.
The steady-state emission spectra of LAURDAN in reverse micelles are highly asymmetric at all values of w0. Steady-state spectral deconvolution by log-normal Gaussian showed that these spectra corresponded to the sum of three elementary spectra. These spectra are time averaged and can be distinguished if we assume that excited state kinetics are slow enough to occur over a timescale similar in length to the fluorescence lifetime (a few nanoseconds or slightly faster). The deconvolution of the TRES also revealed three elementary spectra, two of which had biexponential maximum intensity decays. This behavior cannot be accounted for simply by the classical reaction scheme involving only three excited states, LE, CT, and CTR, as discussed in a previous study (Viard et al., 1997). More sophisticated models, involving either the fluorescent probe having two locations within the reverse micelle or several ICTs, are required to explain the existence of shifted or different time component(s) at the red edge of the fluorescence emission spectrum.
It has been suggested that PRODAN is located at two different sites within micelles, but this hypothesis was not accurately documented by a time-resolved approach (Hungerford et al., 2002). However, the amphipathic properties of LAURDAN would tend to favor the location of the fluorescent moiety at the surfactant-water interface, although this does not preclude small displacements of weak amplitudes along the interface.
As far as the possible existence of several ICTs is concerned, three absorption bands were observed by deconvolution of the LAURDAN absorption spectra in apolar solvents (Viard et al., 1997). In decreasing order of energy and according to theoretical calculations (Parusel et al., 1998), these spectra probably correspond to i), the LE excited state of absorption maximum: 317–325 nm, ii), a first planar excited state with significant CT character (absorption maximum: 348–350 nm), and iii), a second one (absorption maximum: 371–374 nm). Fluorescence is emitted from the various transient states involving intramolecular geometric relaxation, the precise origin of which has been the subject of much debate and which depends on the polarity and dynamics of the solvent (Balter et al., 1988; Bunker et al., 1993; Ilich and Prendergast, 1989; Nowak et al., 1986; Parusel, 1998). Consistent with the existence of an intramolecular excited state process, dual fluorescence emission was observed in the apolar viscous solvent Primol 352, which clearly demonstrated the existence of two elementary spectra with maxima at 387 and 401 nm, after deconvolution of the steady-state fluorescence emission spectrum (Fig. 11). These spectral species were associated with lifetimes of ∼100 and ∼200 ps, respectively, consistent with previous data (Viard et al., 1997). As this apolar solvent is noninteractive, the heterogeneity in emission is probably due to the LE excited state and one PICT or the two PICT states if the LE state is very rapidly deactivated (several tenths of picoseconds) as previously reported (Rollinson and Drickamer, 1980; Viard et al., 1997).
FIGURE 11.
Steady-state emission spectrum of LAURDAN in PRIMOL 352 (solid line). Its deconvolution into two log-normal Gaussian distributions (dotted line). Excitation wavelength: 350 nm. Experiments were performed at 20°C.
The situation is somewhat different in polar environments. According to theoretical calculations, in this case, fluorescence is emitted either from the solvated N-TICT (N-dimethylamino group twisted conformation of highly polar CT character) or from the solvated O-TICT (propanoyl TICT state) both of which are at lower energies than PICT states (Parusel, 1998). With respect to both fluorescence energies and the rotational barriers, the solvated O-TICT is thought to be the most probable emissive state in polar environments, consistent with the fluorescence properties of a PRODAN derivative with a blocked dialkyl-amino group (Lobo and Abelt, 2003).
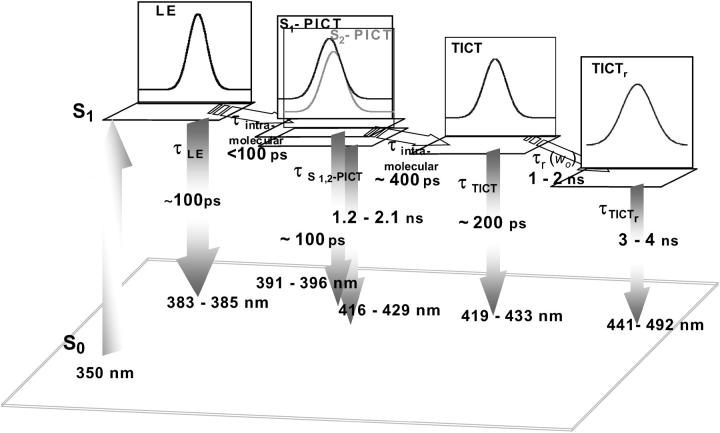
The spectral heterogeneity of LAURDAN in reverse micelles is thus fully accounted for by the photophysics of LAURDAN and solvent relaxation, in association with relaxation rates similar in size to the fluorescence timescale. We described the full relaxation dynamics, including the intra- and intermolecular excited state processes, with our instrumentation. Spectral decomposition of the transient emission spectra and calculation of their decay times make it possible to identify differences in the timescales of intramolecular excited state processes and solvent relaxation. The resulting data are summarized in the diagram for the excited state reaction pathway shown in Fig. 12. The fluorescence emission properties of the “bluest” species (LE state) were almost identical to those in the apolar viscous solvent Primol 352, as indicated both by spectral deconvolution and the measured excited state lifetime values (0.1 ns). The time required for relaxation from LE to the planar excited states S1- and S2-PICT is shorter than the instrumental limit (<50 ps) as we were unable to detect any time-dependent shift in this spectrum. However, it cannot be much more rapid than the lifetime or we would have been unable to resolve this spectrum. PICTs emit at wavelengths of 394 to 425 nm, similar to Primol 352. This emission is characterized by two intensity decay times of ∼0.1 ns and 1.2–2.0 ns (Table 3). This is consistent with the two PICTs states predicted by theoretical calculations (Parusel, 1998) and a single measured TDFSS relaxation time in the ∼0.3–0.5 ns range (Table 2), probably due to PICT-TICT relaxation. Finally, two different lifetimes describe the decay of the lowest energy spectrum associated with the TICT, possibly due to competition between direct emission and solvent relaxation. Only one relaxation time in the 0.9–2.0 ns time range describes the TDFSS of this spectrum for w0 > 2. The amplitude of the spectral shift corresponds to a stabilization of the TICT by up to 9.3 kcal.M−1 (3200 cm−1) at w0 = 11. However, a significant proportion of this dipolar interaction energy arises from dipolar interactions with the AOT polar headgroup region as, for w0 = 0, corresponding to the presence of only small traces of water, we observed a spectral shift of 492 cm−1 corresponding to 1.4 kcal.M−1 (Table 2).
FIGURE 12.
Proposed diagram of the excited state processes of LAURDAN in AOT-water reverse micelles. The lifetime values, solvent relaxation time values, and emission peak values reported here were taken from Tables 2 and 3.
The results presented in Fig. 7 validate the excited state reaction pathway shown in Fig. 12. The short lifetime component present in the 370–450 nm range is probably an average of the 0.1 and 0.2 ns direct emission of S1-PITC and TICT, respectively. The lifetime of this component seems to increase slightly between 420 and 450 nm. A similar biphasic feature is observed for the component with the longest lifetime, which is ∼2 ns at 420 nm, then increases to ∼3 ns between 420 and 465 nm, depending on the water content of the micelle. These two lifetimes can be assigned to direct emissions from the S2-PICT and TICTr states, respectively. Finally, the negative term of the lifetime profiles clearly present between 475 and 530 nm at w0 > 2 in Fig. 7 reflects the dynamic spectral shift that serves as a hallmark of the relaxation exerted by the solvent.
Anisotropy decay measurements showed that the rotational correlation time was significantly shorter than would be expected for the Brownian rotational correlation time of the micelle, whatever the w0. They were in the range of those obtained with various techniques for the AOT polar headgroup region (Eicke and Zinsli, 1978; Freda et al., 2002, 2003). They were also very close to the dipolar relaxation time value obtained with LAURDAN. This suggests that the dipolar relaxation observed with this amphipathic interfacial probe at the AOT-water interface includes interdependent motions of the AOT polar headgroup region and the strongly bound or trapped water dipoles at the interface.
CONCLUSIONS
This report aimed to characterize dipolar dynamics at a membrane-water interface mimic. Description of the solvent response of LAURDAN in reverse micelles could be improved by separating the excited state intramolecular relaxation of this solvatochromic fluorescent probe from the intermolecular relaxation processes. We achieved this by performing a log-normal Gaussian deconvolution of the TRES. The intramolecular and solvent dipolar relaxations of LAURDAN were fully described by subnanosecond and nanosecond time constants. The solvent dipolar relaxation at the interface, as probed by LAURDAN, was described by a single nanosecond relaxation time. No subnanosecond relaxation time was detected with LAURDAN. These findings contrast with those obtained with other water-soluble solvatochromic probes, suggesting partitioning at the surfactant-water interface and within the aqueous core of the micelle. The time range required for solvent dipolar relaxation was of the same order of magnitude as the rotational motion of both LAURDAN and TOE, suggesting that the dipolar interaction involves the AOT polar headgroup region and strongly bound water molecules.
Acknowledgments
We thank the technical staff of LURE for running the synchrotron machine during the beam sessions. M.V. also thanks the Institut National de la Santé et de la Recherche Médicale for financial support.
Michel Vincent's and Jacques Gallay's present address is Institut de Biophysique et Biologie Moléculaire et Cellulaire, UMR CNRS 8619, Université Paris-Sud, Bâtiment 430, F-91405 Orsay Cedex, France.
Abbreviations used: AOT, aerosol OT (sodium diethylhexyl sulfosuccinate); FWHM, full width at half-maximum; LAURDAN, 6-dodecanoyl-2-(N-dimethyl aminonaphtalene); PRODAN, 6-propanoyl-2-(N-dimethyl aminonaphtalene); TOE, tryptophan octyl ester; MEM, maximum entropy method; TDFSS, time-dependent fluorescence Stokes shift; TRES, time-resolved emission spectrum; LE, locally excited; PICT, planar intramolecular charge transfer; TICT, twisted intramolecular charge transfer; CT, charge transfer; CTr, relaxed charge transfer.
References
- Bagatolli, L. A., and E. Gratton. 2000. Two photon fluorescence microscopy of coexisting lipid domains in giant unilamellar vesicles of binary phospholipid mixtures. Biophys. J. 78:290–305. [DOI] [PMC free article] [PubMed] [Google Scholar]
- Balter, A., W. Nowak, W. Pawelkiewicz, and A. Kowalczyk. 1988. Some remarks on the interpretation of the spectral properties of PRODAN. Chem. Phys. Lett. 143:565–570. [Google Scholar]
- Berlman, I. B. 1971. Handbook of Fluorescence Spectra of Aromatic Molecules. Academic Press, New York and London.
- Bhattacharyya, K. 2003. Solvation dynamics and proton transfer in supramolecular assemblies. Acc. Chem. Res. 36:95–101. [DOI] [PubMed] [Google Scholar]
- Bhattacharyya, K., and B. Bagchi. 2000. Slow dynamics of constrained water in complex geometries. J. Phys. Chem. A. 104:10603–10613. [Google Scholar]
- Bunker, C. E., T. L. Bowea, and Y. Sun. 1993. A photophysical study of solvatochromic probe 9-propiony-2-(dimethylamino)naphtalene (prodan) in solution. Photochem. Photobiol. 94:4929–4935. [Google Scholar]
- Burstein, E. A., and V. I. Emelyanenko. 1996. Log-normal description of fluorescence spectra of organic fluorophores. Photochem. Photobiol. 64:316–320. [Google Scholar]
- Castner, E. W. Jr., M. Maroncelli, and G. R. Fleming. 1987. Subpicosecond resolution studies of solvation dynamics in polar aprotic and alcohol solvents. J. Chem. Phys. 86:1090–1097. [Google Scholar]
- Catalan, J., P. Perez, J. Laynez, and F. G. Blanco. 1991. Analysis of the solvent effect on the photophysics properties of 6-Propionyl-2-(dimethylamino)naphtalene (PRODAN). J. Fluoresc. 1:215–223. [DOI] [PubMed] [Google Scholar]
- Chapman, C. F., and M. Maroncelli. 1991. Fluorescence studies of solvation and solvation dynamics in ionic solutions. J. Phys. Chem. 95:9095–9114. [Google Scholar]
- Chattopadhyay, A., S. Mukherjee, and H. Raghuraman. 2002. Reverse micellar organization and dynamics: a wavelength-selective fluorescence approach. J. Phys. Chem. B. 106:13002–13009. [Google Scholar]
- Chattopadhyay, A., S. Mukherjee, R. Rukmini, S. S. Rawat, and S. Sudha. 1997. Ionization, partitioning, and dynamics of tryptophan octyl ester: implications for membrane-bound tryptophan residues. Biophys. J. 73:839–849. [DOI] [PMC free article] [PubMed] [Google Scholar]
- Chen, R. F., J. R. Knutson, H. Ziffer, and D. Porter. 1991. Fluorescence of tryptophan dipeptides: correlations with the rotamer model. Biochemistry. 30:5184–5195. [DOI] [PubMed] [Google Scholar]
- Davis, D. M., D. McLoskey, D. J. Birch, P. R. Gellert, R. S. Kittlety, and R. M. Swart. 1996. The fluorescence and circular dichroism of proteins in reverse micelles: application to the photophysics of human serum albumin and N-acetyl-L-tryptophanamide. Biophys. Chem. 60:63–77. [DOI] [PubMed] [Google Scholar]
- de Foresta, B., J. Gallay, J. Sopkova, P. Champeil, and M. Vincent. 1999. Tryptophan octyl ester in detergent micelles of dodecylmaltoside: fluorescence properties and quenching by brominated detergent analogs. Biophys. J. 77:3071–3084. [DOI] [PMC free article] [PubMed] [Google Scholar]
- Eicke, H.-F., and P. E. Zinsli. 1978. Nanosecond spectroscopic investigations of molecular processes in W/O microemulsions. J. Colloid. Interface. Sci. 65:131–140. [Google Scholar]
- Fiori, S., C. Renner, J. Cramer, S. Pegoraro, and L. Moroder. 1999. Preferred conformation of endomorphin-1 in aqueous and membrane-mimetic environments. J. Mol. Biol. 291:163–175. [DOI] [PubMed] [Google Scholar]
- Freda, M., G. Onori, A. Paciaroni, and A. Santucci. 2002. Hydration and dynamics of aerosol OT reverse micelles. J. Mol. Liq. 101:55–68. [Google Scholar]
- Freda, M., G. Onori, A. Paciaroni, and A. Santucci. 2003. Hydration-dependent internal dynamics of reverse micelles: a quasielastic neutron scattering study. Phys. Rev. E. 68:21406–21411. [DOI] [PubMed] [Google Scholar]
- Gaemers, S., C. J. Elsevier, and A. Bax. 1999. NMR of biomolecules in low viscosity, liquid CO2. Chem. Phys. Lett. 301:138–144. [Google Scholar]
- Gallay, J., M. Vincent, C. Nicot, and M. Waks. 1987. Conformational aspects and rotational dynamics of synthetic adrenocorticotropin-(1–24) and glucagon in reverse micelles. Biochemistry. 26:5738–5747. [DOI] [PubMed] [Google Scholar]
- Grabowski, Z. R., K. Rotkiewicz, A. Siemiarczuk, D. J. Cowley, and W. Baumann. 1979. Twisted intramolecular charge transfer states (TICT). A new class of excited states with a full charge separation. Nouv. J. Chim. 3:443–454. [Google Scholar]
- Hungerford, G., E. M. S. Castanheira, E. C. D. Real Oliveira, M. d. G. Miguel, and H. D. Burrows. 2002. Monitoring ternary systems of C12E5/water/tetradecane via the fluorescence of solvatochromic Probes. J. Phys. Chem. B. 106:4061–4069. [Google Scholar]
- Ilich, P., and F. G. Prendergast. 1989. Singlet adiabatic states of solvated prodan: a semi-empirical molecular orbital study. J. Phys. Chem. 93:4441–4447. [Google Scholar]
- Jimenez, R., G. R. Fleming, P. V. Kumar, and M. Maroncelli. 1994. Femtosecond solvation dynamics of water. Nature. 369:471–473. [Google Scholar]
- Karukstis, K., A. A. Frazier, D. S. Martula, and J. A. Whiles. 1996. Characterization of the microenvironments in AOT reverse micelles using multidimensional spectral analysis. J. Phys. Chem. 100:11133–11138. [Google Scholar]
- Keh, E., and B. Valeur. 1981. Investigation of water-containing inverted micelles by fluorescence polarization. Determination of size and internal fluidity. J. Colloid. Interface Sci. 79:465–468. [Google Scholar]
- Ladokhin, A. S., and P. W. Holloway. 1995. Fluorescence of membrane-bound tryptophan octyl ester: a model for studying intrinsic fluorescence of protein-membrane interactions. Biophys. J. 69:506–517. [DOI] [PMC free article] [PubMed] [Google Scholar]
- Lakowicz, J. R. 1999. Principles of Fluorescence Spectroscopy. Kluwer Academic, Plenum Publishers, New York.
- Levinger, N. E. 2002. Chemistry. Water in confinement. Science. 298:1722–1723. [DOI] [PubMed] [Google Scholar]
- Lissi, E. A., E. B. Abuin, M. A. Rubio, and A. Ceron. 2000. Fluorescence of Prodan and Laurdan in AOT/heptane/water microemulsions: partitioning of the probes and characterization of microenvironments. Langmuir. 16:178–181. [Google Scholar]
- Liu, B., R. K. Thalji, P. D. Adams, F. R. Fronczek, M. L. McLaughlin, and M. D. Barkley. 2002. Fluorescence of cis-1-amino-2-(3-indolyl)cyclohexane-1-carboxylic acid: a single tryptophan chi(1) rotamer model. J. Am. Chem. Soc. 124:13329–13338. [DOI] [PubMed] [Google Scholar]
- Lobo, B. C., and C. J. Abelt. 2003. Does PRODAN possess a planar or twisted charge-transfer excited state? Photophysical properties of two PRODAN derivatives. J. Phys. Chem. A. 107:10938–10943. [Google Scholar]
- Luisi, P. L., M. Giomini, M. P. Pileni, and B. H. Robinson. 1988. Reverse micelles as hosts for proteins and small molecules. Biochim. Biophys. Acta. 947:209–246. [DOI] [PubMed] [Google Scholar]
- Marzola, P., and E. Gratton. 1991. Hydration and protein dynamics: frequency domain fluorescence spectroscopy on proteins in reverse micelles. J. Phys. Chem. 95:9488–9495. [Google Scholar]
- Nandi, N., K. Bhattacharyya, and B. Bagchi. 2000. Dielectric relaxation and solvation dynamics of water in complex chemical and biological systems. Chem. Rev. 100:2013–2045. [DOI] [PubMed] [Google Scholar]
- Nicot, C., and M. Waks. 1996. Proteins as invited guests of reverse micelles: conformational effects, significance, applications. Biotechnol. Genet. Eng. Rev. 13:267–314. [DOI] [PubMed] [Google Scholar]
- Nowak, W., P. Adamczak, and A. Balter. 1986. On the possibility of fluorescence from twisted intramolecular charge transfer states of 2-dimethylamino-6-acylnaphtalenes. A quantum-chemical study. J. Mol. Struct. THEOCHEM. 139:13–23. [Google Scholar]
- Orlich, B., and R. Schomacker. 2002. Enzyme catalysis in reverse micelles. Adv. Biochem. Eng. Biotechnol. 75:185–208. [DOI] [PubMed] [Google Scholar]
- Pal, S. K., and A. H. Zewail. 2004. Dynamics of water in biological recognition. Chem. Rev. 104:2099–2123. [DOI] [PubMed] [Google Scholar]
- Panja, S., and S. Chakravorti. 2003. Photophysics of 4-N,N-dimethylamino cinnamaldehyde in AOT reverse micelles and exploration of its position and orientation. Chem. Phys. Lett. 367:330–338. [Google Scholar]
- Parasassi, T., G. De-Stasio, G. Ravagnan, R. M. Rusch, and E. Gratton. 1991. Quantitation of lipid phases in phospholipid vesicles by the generalized polarization of Laurdan fluorescence. Biophys. J. 60:179–189. [DOI] [PMC free article] [PubMed] [Google Scholar]
- Parusel, A. 1998. Semiempirical studies of solvent effects on the intramolecular charge transfer of the fluorescence probe PRODAN. J. Chem. Soc., Faraday Trans. 1. 94:2923–2927. [Google Scholar]
- Parusel, A. B. J., W. Nowak, S. Grimme, and G. Köhler. 1998. Comparative theoretical study on charge-transfer fluorescence probes: 6-propanoyl-2-(N,N-dimethylamino)naphalene and derivatives. J. Phys. Chem. A. 102:7149–7156. [Google Scholar]
- Petrich, J. W., M. C. Chang, D. B. McDonald, and G. R. Fleming. 1983. On the origin of nonexponential fluorescence decay in tryptophan and its derivatives. J. Am. Chem. Soc. 105:3824–3832. [Google Scholar]
- Prats, M., J. Teissie, and J. F. Tocanne. 1986. Lateral proton conduction at lipid-water interfaces and its implications for the chemiosmotic-coupling hypothesis. Nature. 322:756–758. [Google Scholar]
- Riter, R. E., D. M. Wilard, and N. E. Levinger. 1998. Water immobilization at surfactant interfaces in reverse micelles. J. Phys. Chem. B. 102:2705–2714. [Google Scholar]
- Rollinson, A. M., and H. G. Drickamer. 1980. High pressure study of luminescence from intramolecular CT compounds. J. Chem. Phys. 73:5981–5996. [Google Scholar]
- Sengupta, B., J. Guharay, and P. K. Sengupta. 2000. Characterization of the fluorescence emission properties of prodan in different reverse micelle environments. Spectrochim. Acta [A]. 56:1433–1441. [DOI] [PubMed] [Google Scholar]
- Sengupta, B., and P. K. Sengupta. 2000. Influence of reverse micellar environments on the fluorescence emission properties of tryptophan octyl ester. Biochem. Biophys. Res. Commun. 277:13–19. [DOI] [PubMed] [Google Scholar]
- Shastry, M. C., and M. R. Eftink. 1996. Reversible thermal unfolding of ribonuclease T1 in reverse micelles. Biochemistry. 35:4094–4101. [DOI] [PubMed] [Google Scholar]
- Siano, D. B., and D. E. Metzler. 1969. Band shapes of the electronic spectra of complex molecules. J. Chem. Phys. 51:1856–1861. [Google Scholar]
- Sire, O., B. Alpert, and C. Royer. 1996. Probing pH and pressure effects on the apomyoglobin heme pocket with the 2′-(N,N-dimethylamino)-6-naphtoyl-4-trans-cyclohexanoic acid fluorophore. Biophys. J. 70:2903–2914. [DOI] [PMC free article] [PubMed] [Google Scholar]
- Szabo, A. G., and D. M. Rayner. 1980. Fluorescence decay of tryptophan conformers in aqueous solutions. J. Am. Chem. Soc. 102:554–563. [Google Scholar]
- Teissie, J., M. Prats, P. Soucaille, and J. F. Tocanne. 1985. Evidence for conduction of protons along the interface between water and a polar lipid monolayer. Proc. Natl. Acad. Sci. USA. 82:3217–3222. [DOI] [PMC free article] [PubMed] [Google Scholar]
- Tortech, L., C. Jaxel, M. Vincent, J. Gallay, and B. de Foresta. 2001. The polar headgroup of the detergent governs the accessibility to water of tryptophan octyl ester in host micelles. Biochim. Biophys. Acta. 3:76–86. [DOI] [PubMed] [Google Scholar]
- Viard, M., J. Gallay, M. Vincent, O. Meyer, B. Robert, and M. Paternostre. 1997. Laurdan solvatochromism: solvent dielectric relaxation and intramolecular excited state reaction. Biophys. J. 73:2221–2234. [DOI] [PMC free article] [PubMed] [Google Scholar]
- Viard, M., J. Gallay, M. Vincent, and M. Paternostre. 2001. Origin of laurdan sensitivity to the vesicle-to-micelle transition of phospholipid-octylglucoside system: a time-resolved fluorescence study. Biophys. J. 80:347–359. [DOI] [PMC free article] [PubMed] [Google Scholar]
- Vincent, M., J. Gallay, and A. P. Demchenko. 1995. Solvent relaxation around the excited state of indole: analysis of fluorescence lifetime distributions and time-dependence spectral shifts. J. Phys. Chem. B. 99:14931–14941. [Google Scholar]
- Vincent, M., A.-M. Gilles, I. M. Li de la Sierra, P. Briozzo, O. Bârzu, and J. Gallay. 2000. Nanosecond fluorescence dynamic Stokes shift of tryptophan in a protein matrix. J. Phys. Chem. 104:11286–11295. [Google Scholar]
- Vinogradov, A. A., E. V. Kudryashova, A. V. Levashov, and W. M. van Dongen. 2003. Solubilization and refolding of inclusion body proteins in reverse micelles. Anal. Biochem. 320:234–238. [DOI] [PubMed] [Google Scholar]
- Weber, G., and F. J. Farris. 1979. Synthesis and spectral properties of a hydrophobic fluorescent probe: 6-propionyl-2-(dimethylamino)naphthalene. Biochemistry. 18:3075–3078. [DOI] [PubMed] [Google Scholar]
- Wille, H., and S. B. Prusiner. 1999. Ultrastructural studies on scrapie prion protein crystals obtained from reverse micellar solutions. Biophys. J. 76:1048–1062. [DOI] [PMC free article] [PubMed] [Google Scholar]
- Yeager, M. D., and G. W. Feigenson. 1990. Fluorescence quenching in model membranes: phospholipid acyl chain distributions around small fluorophores. Biochemistry. 29:4380–4392. [DOI] [PubMed] [Google Scholar]


