

Abstract
Site-directed spin labeling is used to investigate the structure of adsorbed T4 lysozyme (T4L). A monolayer of T4L is prepared by tethering the protein selectively via a His-tag to the chelating headgroups (NTA Ni) of a planar quartz-supported lipid bilayer. This results in a vectorially oriented ensemble of proteins on the surface, which gives rise to angular-dependent electron paramagnetic resonance spectra. Similar measurements of spin-labeled lipid bilayers were used to characterize the structure and dynamics of the supports. Electron paramagnetic resonance line shape was analyzed using the stochastic Liouville equation approach developed by Freed and co-workers. The simulations reveal a conservation of the secondary and tertiary structure of T4L upon adsorption although slight conformational changes in the presence of the surface can be detected by probing tertiary contact sites. The orientation of the entire protein was deduced on the basis of an anisotropic motional model for the spin-labeled side chain. In addition, a polar order but azimuthal disorder of the molecules was assumed to fit the data. These results demonstrate the utility of site-directed spin labeling in combination with spectral simulation to study not only the secondary and tertiary structure of adsorbed proteins in monolayer coverage but also their orientation with respect to the surface.
INTRODUCTION
Interfacial binding or adsorption of proteins to surfaces and membranes is an important process in cell biology, biomembranes, and biomedical devices that come into contact with biological fluids such as implants. In these diverse fields it is crucial to acquire knowledge on the principle properties of surfaces that govern the change in structure and dynamics of proteins in the adsorbed state. To elucidate protein-surface interactions and details of membrane-mediated processes the structure of adsorbed protein extends beyond the secondary and tertiary fold to include orientation relative to the surface as well as two-dimensional organization.
A large variety of techniques have been used to study protein adsorption including infrared spectroscopy, surface-enhanced Raman spectroscopy, nonlinear optical spectroscopy such as sum frequency generation or second harmonic generation, circular dichroism, neutron reflectivity, and fluorescence spectroscopy. These methods provide global information on the secondary structure of adsorbed proteins. The orientation of adsorbed proteins has also been addressed by these techniques either probing specific chromophores (MacDonald and Smith, 1996; Perrenoud-Rinuy et al., 2002; Wood et al., 1997) or deducing the global orientation of anisotropically shaped proteins from layer thickness measurements (Su et al., 1998). Information on the atomic structure is traditionally gained by the use of diffraction techniques. However, the relatively small number of solved structures for membrane proteins already indicates the difficulties to crystallize such entities. For proteins that are attached to a surface the situation is even more complicated, and structure determination has been limited to a few cases such as annexin adsorbed to phosphatidylserine containing lipid bilayers (Brisson et al., 1991). The application of NMR spectroscopy suffers from the long rotational correlation times of the entities that usually require the application of solid-state NMR techniques to study the structure. Up to now only a very limited number of structures have been elucidated using solid-state NMR (Opella and Marassi, 2004).
Site-directed spin labeling has emerged as a powerful tool for monitoring sequence-specific structure and dynamics of proteins of arbitrary mass (Columbus and Hubbell, 2002; Feix and Klug, 1998; Hubbell et al., 2000, 1998). In site-directed spin labeling (SDSL), a paramagnetic nitroxide side is introduced via selective coupling to a cysteine introduced into the amino acid sequence by a substitution mutation. Most of the previous studies have used the side chain shown in Fig. 1, which is designated R1 throughout the text. The EPR spectrum of a spin-labeled side chain in a protein encodes information on the dynamics of the nitroxide that in turn reflect a variety of the structural and dynamic features of the protein itself. It was shown that the motion of the side chain R1 is uniquely determined by backbone dynamics and the local environment of the label (Columbus and Hubbell, 2002). Thus the EPR spectra for a set of R1 side chains at specific sites throughout the protein can be used to determine sequence-specific secondary structure, tertiary fold, and to map backbone dynamics. In addition, these spectra can be used to monitor structural changes of the protein upon binding.
FIGURE 1.

Structure of the R1 side chain, indicating the dihedral angles X1–X5.
The extraction of these properties requires a detailed analysis of the line shape of the EPR spectra. In the past Freed and co-workers have developed a methodology based on the stochastic Liouville equation to describe the EPR line shape in the slow tumbling regime (Budil et al., 1996; Schneider and Freed, 1989). Recently, progress has been made to correlate quantitatively the motion of the spin label with local protein structure and dynamics (Columbus and Hubbell, 2004; Columbus et al., 2001). The analysis of EPR spectra showed that the dynamics of solvent-exposed helical sites can be understood as a superposition of local dynamics of the side chain, which is almost independent of the position and contributions of backbone dynamics (Columbus and Hubbell, 2002). This allows a description of the EPR line shape of these sites in characteristic regions of parameter space (Columbus et al., 2001). In combination with x-ray crystallography of spin-labeled T4L a motional model for the R1 side chain (Fig. 1) at solvent-exposed sites has been developed (Langen et al., 2000). In this model the Sδ of the disulfide bond interacts with atoms of the backbone thereby constraining rotations about X1 and X2. In addition, the rotation around the disulfide bond requires too much energy to be excited at physiological conditions (Weaver and Matthews, 1987). Therefore, a combination of rotational motion around X4 and X5 and protein backbone fluctuations dominate the motion of the nitroxide ring and give rise to the experimentally observed EPR spectra. This model, which was already developed for α-helical sites was recently extended to the analysis of β-sheet proteins by investigation of the cellular retinal-binding protein (Lietzow and Hubbell, 2004).
Due to the tensorial nature of the interaction between the spin label and the static magnetic field, EPR is capable of resolving the orientation of a spin probe for an ordered ensemble of molecules as long as the anisotropic magnetic interactions of the nitroxide are not completely averaged by the motion of the side chain. Thus, for oriented molecules additional spectral information can be obtained that may be used to determine the orientation of molecules or secondary structure elements with respect to the surface, information which is crucial for the understanding of a large variety of surface-mediated processes. In an exploratory study, two-dimensional crystals of Annexin 12 adsorbed to a planar, quartz-supported POPC/POPS lipid bilayer were investigated, proving that EPR spectroscopy has the sensitivity to detect proteins on planar surfaces in submonolayer coverage (Risse et al., 2003). In addition, the orientation of a helix with respect to the surface was deduced from the analysis of angular-dependent EPR spectra of a helix surface site. Due to the crystalline nature of the adsorbed layer it was possible to show that the orientation of the helix determined by EPR spectroscopy is compatible with values of electron diffraction.
A primary goal of this work is to develop a SDSL methodology to quantitatively analyze EPR spectra of adsorbed proteins in terms of local protein structure, orientation, and dynamics. To this end a quantitative description of the EPR line shape is mandatory. In isotropic solution the EPR line shape of solvent-exposed helical sites can be accurately modeled by the Microscopic Order Macroscopic Disorder (MOMD) model developed by Freed and co-worker (Schneider and Freed, 1989). In this work, this analysis is adapted to the investigation of vectorially tethered proteins on planar surfaces. For such a system the information content of the EPR spectra is increased as compared to the isotropic solution due to the angular dependence of the EPR line shape that may allow a critical test of the physical interpretation of the X4/X5 model established to describe the side-chain dynamics. The same methodology was also used to characterize the structure and dynamics of the lipid bilayers. Here, small amounts of spin-labeled lipids were added, to make the film susceptible to EPR spectroscopy.
Following up previous stochastic Liouville equation (SLE) simulation studies in solution done on spectra of helix surface sites of the small globular protein T4L (Columbus et al., 2001), this study uses T4L as model protein. The molecules were coordinatively bound to a planar quartz-supported DOPC lipid bilayer containing a nickel-chelating lipid (DOGS-NTA) via an engineered His-tag. The vectorially ordered protein layer was studied by EPR spectroscopy for several residues throughout the protein. The line shape was analyzed subsequently to elucidate the secondary and tertiary structure as well as the dynamics of the adsorbed protein. In addition, the angular-dependent spectra were used to determine the orientation of the protein on the surface and to test the physical interpretation of the dynamics of the side chain.
MATERIALS AND METHODS
Materials
The spin-labeling reagent (1-oxyl-2, 2, 5, 5-tetramethylpyrroline-3-methyl) methanethiosulfonate (MTSSL) was purchased from Toronto Research Chemicals (North York, Canada). The cysteine-less pseudo-wild-type T4L gene containing the substitutions C45T and C97A was kindly provided by F. W. Dahlquist (University of Oregon). This will be referred to as the “wild type”.
The lipids were purchased from Avanti Polar Lipids (Alabaster, AL) and used without further purification.
Cloning, expression, and purification of T4L mutants
The cloning, expression, purification, and spin labeling of the eight T4L mutants investigated (F4C, E22C, D61C, D72C, D76C, T109C, V131C, I150C) was performed as reported by Mchaourab and others (Mchaourab et al., 1996), but a different vector was used, namely the pET-28b(+) vector (Novagen, Madison, WI) that carries an N-terminal His-tag configuration. Polymerase chain reaction was used to isolate the wild-type T4L gene and to provide it with a BamHI and a NdeI restriction site. The target plasmid was obtained by restriction digest of vector and insert followed by gel purification and ligation. The mutations were introduced into the plasmid using the QuikChange method (Stratagene, La Jolla, CA). The nucleotide sequence of each mutant was verified by sequencing the entire gene. All mutants were expressed in Escherichia coli BL21 (DE3) cells as previously described (Mchaourab et al., 1996; Sauer et al., 1992). Briefly, cell cultures were grown to an OD ∼ 1.0 and protein expression was induced by adding IPTG (1 mM). The cells were harvested by centrifugation after 1 h of induction. The cell pellets were resuspended in a buffer containing 25 mM Tris, 25 mM MOPS, and 0.2 mM EDTA, pH 7.6, and sonicated on ice for 5 min. The cell debris was pelleted by centrifugation at 27,000× g for 15 min. The supernatant was filtered (0.2 μm) and loaded either onto a SP sepharose Hi-Trap cation exchange column (Amersham Biosciences, Buckinghamshire, UK) or a Hi-Trap chelating nickel affinity column (Amersham Biosciences). From the sepharose column T4L was eluted with a linear NaCl gradient (from 0 to 1.0 M NaCl); from the nickel affinity column, elution was with a buffer containing 0.01 M NaH2PO4, 0.01 M Na2HPO4, 0.5 M NaCl, and 0.5 M imidazole, pH 7.4. Protein purity was determined to be 95% pure on an 8–25% SDS-PAGE gel. For storage DTT was added to a concentration of ∼10 mM and the samples were frozen at from −20 to −80°C.
Spin labeling of T4L mutants
For spin labeling, DTT was removed using a Hi-Trap desalting column (Amersham Biosciences), eluting with a buffer containing 50 mM MOPS and 25 mM NaCl at pH 6.8. The T4L mutants were incubated with 10-fold molar excess of the spin-labeling reagent for 2–4 h at room temperature. The same desalting column was used to remove excess spin label and to transfer the protein into the binding buffer (0.01 M NH4H2PO4, 0.01 M (NH4)2HPO4, 0.5 M NaCl, pH 7.4). Protein solutions were concentrated to ∼0.2 mg/mL using a Microcon filter concentrator (10-kDa cutoff; Millipore, Billerica, MA).
The spin-labeled mutants are designated by giving the residue position with a suffix R1 to indicate the spin-labeled side chain.
Surface preparation
Samples were prepared in aqueous flat cells (Wilmad WG 812 Q). The surface of the flat cell was cleaned by incubating in chloroform for 12 h followed by rinsing sequentially with chloroform, acetone, ethanol, and water and by sonication in a water bath. Before use the cells were baked in a furnace at 600°C for 12 h. Small unilamellar lipid vesicles were prepared by sonication as described previously (Barenholz et al., 1977). Briefly, a 9:1 lipid mixture of DOPC and DOGS-NTA nickel was suspended in an aqueous buffer (10 mM HEPES, 100 mM NaCl, pH 7.4). The large multilamellar vesicles were disrupted by sonication with a Branson tip sonifier to form small unilamellar vesicles. SUVs were separated from residual material by ultracentrifugation at ∼135,000× g. Adsorbing these small vesicles to the inner surfaces of the quartz cell for 2 h leads to the formation of a single lipid bilayer (Cremer and Boxer, 1999). For the investigation of the lipid film alone, 2 mol% spin-labeled lipid (7-doxyl- or 14-doxyl-stearoylphosphatidylcholine) was added to the lipid mixture before preparation of lipid vesicles.
Protein attachment
The lipid bilayer was loaded with nickel ions by exposing it to 0.1 M NiSO4 solution for 2–5 min and followed by washing with binding buffer. The protein was allowed to adsorb for ∼4 h before the film was washed with binding buffer. For elution of the bound protein, the cell was rinsed with binding buffer containing 0.05 M EDTA.
EPR measurements
EPR spectroscopy was performed on a Bruker EMX spectrometer fitted with a spherical SHQ (super-high-Q) resonator (Bruker, Karlsruhe, Germany). All spectra were acquired using 2 mW incident microwave power. Typically, the signal was averaged for 170 min. For samples with narrow lines (22R1) acquisition of 50 min was sufficient to obtain the signal/noise ratio shown. In less favorable cases spectra were accumulated for up to 800 min.
The modulation amplitude of the spectra was chosen according to the linewidth observed in solution. For the surface-bound species it was always chosen at the upper edge of acceptable values to optimize the signal/noise ratio. For lipid bilayer samples typical modulation amplitude of 2 G was used, whereas spectra of adsorbed proteins were usually taken with 3 G modulation. For protein samples in solution a modulation of 1 G was used. To reduce the global tumbling of the protein in solution, these spectra were recorded in 30% w/v sucrose (Mchaourab et al., 1996). Sucrose at this concentration does not affect the rotational mobility of the side chain (Langen et al., 1999).
Angular resolved spectra of surface samples were obtained using a homemade goniometer. Spectra of lipid bilayers were taken under constant temperature using a homemade air-based temperature control device.
Simulations of EPR spectra
The magnetic framework of the nitroxide spin labels used in these investigations is defined such that the x axis is taken to be parallel to the N-O bond and the z axis lies along the 2π* orbital of the NO bond containing the unpaired electron. It has been shown from single crystal studies that the principal axes of the g and A matrices of these molecules coincide with this framework (Libertini and Griffith, 1970).
EPR spectra of dynamic spin probes were fit using a stochastic Liouville formalism as developed by Freed and co-workers (Schneider and Freed, 1989). In particular, a modified version of the program NLSL as described by Budil and others was used (Budil et al., 1996).
The motion of the spin probe is modeled by Brownian diffusion characterized by three mutually orthogonal diffusion constants. This motion may be restricted by an axial symmetric potential with the director of the potential being defined along the z axis. This restoring potential is set up by an expansion into a series of spherical harmonics incorporated in the time-dependent Hamiltonian,
 |
where (Ω) = (α,β,γ) designate the angles relating the diffusion frame of the nitroxide moiety to the molecule-fixed director frame,  the expansion coefficients of the potential, and
  Wigner rotation matrices, respectively (Lee et al., 1994). For the fits in this report only the first term in the expansion, specified by
  was used and sufficient to obtain reasonable fits. The order parameter S is calculated from
  as described by Schneider and Freed (1989).
For a complex motion the diffusion frame is not necessarily coincident with the magnetic frame of the nitroxide, in which the magnetic parameters (A, g) are defined. This is taken into account by a unitary transformation involving three Euler angles (αD,βD,γD). Due to the almost axial symmetric nature of the g and A tensor only βD, the angle between the z axis of the diffusion tensor zR and that of the magnetic frame zM, needs to be considered.
Simulation of spectra from spin-labeled lipids in a planar lipid bilayer
The rotational dynamics of the spin-bearing lipid in a lipid bilayer can be understood as a superposition of two contributions: a rigid body motion of the lipid molecule within the film that is highly anisotropic due to the prolate shape of the molecule and motions arising from C-C bond isomerizations of the alkyl chain segments. This motion is modeled by a Brownian diffusion in an axial symmetric potential. It has been shown that the z axis of the nitroxide is on average parallel to the long axis of the lipid (Waggoner et al., 1969). From this observation it can be concluded that the diffusion frame coincides with the magnetic frame of the nitroxide, i.e., βD = 0°. The rotation about the long axis of the molecule is relatively fast, whereas the rotations about the other two directions are considerably slower. In addition, the motion of the alkyl chain away from the orthogonal orientation with respect to the surface is hindered by the adjacent lipid molecules. In practice, an axial symmetric diffusion tensor characterized by two values Rperp and Rpar and an axial symmetric restoring potential along the surface normal can be used. It is often convenient to transform the rotation constants into an isotropic value  and a dynamic asymmetry parameter N = Rpar/Rperp. The principal values of the A and g tensors were fixed at the values found in literature (Ge et al., 2003) (see Table 1).
TABLE 1.
Parameter of the fit to EPR spectra of DOPC/DOGS-NTA/14-doxyl PC (88/10/2%) lipid bilayer supported on quartz
| Position | R (× 108 s−1) | N | S | βD (°) |
|---|---|---|---|---|
| 14-doxyl | 1.6 | 4.0 | 0.11 | 0 |
Magnetic parameters are taken from Ge et al. (2003); gxx = 2.0082, gyy = 2.0062, gzz = 2.0020; Axx = 5.5 G, Ayy = 5.5 G, Azz = 33.3 G.
To generate a spectrum acquired in the laboratory frame the molecule fixed director frame needs to be transformed into the laboratory system. The connection between the two coordinate systems is given by the angle ζ, the angle between the local director (zD) and the surface normal (see Fig. 2). For a well-ordered lipid bilayer the long axis of the lipid molecules is oriented normal to the surface (ζ = 0) (Singer and Nicolson, 1972), which simplifies the situation considerably. In this case a single configuration characterized by the angle between the static magnetic field and the surface normal (θ) determines the EPR spectrum.
FIGURE 2.

A diagram showing the relationship between the z axes of the probe rotational frame (zR) and the protein fixed director (zD) taken to lie along the symmetry axis of the ordering potential. The angle γ is the instantaneous angle between zR and zD; the average of γ is restricted by the order potential characterized by the order parameter S. For adsorbed species θ is the experimental tilt angle between magnetic field and surface normal; ζ indicates the polar angle of the director with respect to the surface normal; and φ is the azimuthal angle with respect to the plane defined by the surface normal and the direction of the static magnetic field.
On the contrary, the spectrum of spherical vesicles is determined by a spherical average over all angles between director and static magnetic field. Both situations are implemented in the NLSL routine, the first allowing a fit over a series of angular-dependent EPR spectra assuming a well-defined orientation of the order potential with respect to the surface normal. The latter case is described by the MOMD model (Meirovitch et al., 1984), as the motion of the molecules is anisotropic on microscopic scale due to the local environment of the molecule whereas the characteristic direction of the anisotropic motion, namely the direction of the director of the order potential, is distributed randomly with respect to the laboratory frame. A global fit was made to the spectrum obtained from the vesicle solution as well as the angular-dependent spectra of the supported bilayer to extract a consistent set of dynamical parameters (Rbar, N, and 
Simulation of spectra from spin-labeled proteins in solution and adsorbed on the surface
The MOMD model has already been successfully applied to analyze EPR spectra of proteins in solution in terms of side-chain as well as backbone dynamics (Columbus and Hubbell, 2004; Columbus et al., 2001). Thus, the spectra taken in solution were used to determine the dynamic parameters, namely R, N and  For mutants 72R1 and 131R1 the dynamic parameters determined in a previous study were adopted (Columbus et al., 2001). It should be noted in passing that global tumbling of the molecule has to be suppressed by increasing the viscosity of the solution to extract reasonable parameters of the local dynamics. The principal values of the A and g tensors were fixed for all simulations at the literature values (Columbus et al., 2001).
The case of an adsorbed protein on a planar surface is similar to the situation of a lipid bilayer discussed above. The only difference arises from the fact that the tilt angle ζ (Fig. 2) between the director and the surface normal is usually not zero. This introduces another degree of freedom namely the azimuthal angle (φ) defined as the angle between the plane determined by the static magnetic field and the surface normal and the plane spanned by the director of the potential and the surface normal. In the given case of a vectorial attachment of the molecules an isotropic distribution of the azimuthal angle φ is expected for a macroscopic ensemble of molecules. Thus, the spectrum for a given orientation of the static magnetic field θ (Fig. 2) was calculated by choosing a tilt angle ζ and a subsequent integration over all azimuthal orientations. The situation is slightly more complex because the adsorption via the His-tag will not produce a perfect vectorial attachment of the protein. This was taken into account by introducing a distribution of tilt angles ζ. The polar disorder was modeled using a Gaussian distribution with standard deviation σ. From a computational point of view this situation is very similar to the isotropic (MOMD) case. In both cases the spectrum for an individual orientation is determined by the angle Ψ between the static magnetic field and the director of the ordering potential. In contrast to the MOMD case with an isotropic distribution of Ψ on a sphere this distribution is anisotropic for the surface model. Computationally, the problem reduces to the calculation of the proper distribution function of the angle Ψ. The current implementation uses 360 steps for the integration over the azimuth (φ) and 180 steps for the integration over the polar angle (ζ) to create the distribution of Ψ that typically contained 25 values.
For a set of angular-dependent EPR spectra a global fit to all spectra was performed using the tilt angle ζ and the standard deviation of the tilt angle distribution as adjustable parameter. The dynamic parameters were taken from the solution spectra as indicated above. This strategy assumes that the dynamics of the side chain determined by the secondary and tertiary structure of the protein is conserved upon adsorption to the lipid surface. Conversely, a consistent fit of the angular-dependent spectra with the dynamic parameters obtained from the solution spectrum does not only give the orientation of the director of the ordering potential with respect to the surface normal but it is also a strong indication that the assumption of a conserved structure of the molecule upon adsorption is valid.
RESULTS
Lipid bilayer
Structure
EPR spectroscopy of spin-labeled lipid probes is capable of giving information not only on the local rotational mobility of the spin probe but also, in the given case of a flat lipid bilayer, of providing detailed information on the structure of lipid films.
First, the phase of the lipid bilayer can be determined in analogy to the investigation of lipid vesicles by detecting the maximum hyperfine splitting as a function of nitroxide position in the sn-2 chain for the phosphatidylcholine spin-label positional isomers (Swamy and Marsh, 2001). It should be noted, that in case of the planar quartz-supported lipid bilayer investigated herein, spectra at a given orientation with respect to the magnetic field need to be compared, because of the angular dependence of the hyperfine splitting. Here, an increase of hyperfine splitting from position 14 to 7 is observed. This shows that the lipid mobility increases toward the tail of the aliphatic chain indicating the presence of a liquid phase. On the contrary, if the lipids were in a gel phase the mobility along the alkyl chain would be position independent. Temperature-dependent measurements in the region of room temperature, 18–28°C, revealed, that no phase transition occurs in this temperature range, as inferred from the lack of a discontinuity of the hyperfine splitting (Swamy and Marsh, 2001).
Second, from EPR spectra taken at different angles between surface normal and magnetic field, the ordering of the lipid molecules on the surface can be deduced. Fig. 3 shows the EPR spectra of a phosphatidylcholine bilayer (DOPC) doped with 10% chelating lipid DOGS-NTA Ni and 2% of 14-doxyl-PSPC. The topmost spectrum was obtained for a suspension of SUVs whereas the other spectra were measured for a planar lipid bilayer with the surface normal oriented parallel and perpendicular to the magnetic field, respectively. The experimental conditions (pH, ionic strength of binding buffer) of the chelating lipid bilayer were chosen such as to optimize the order of the film as inferred from EPR line shape. This optimization was guided by a preceding investigation of spin-labeled simple DOPC bilayers.
FIGURE 3.
EPR spectra of DOPC/DOGS-NTA/14-doxyl PC (88/10/2 mol%) lipid SUVs and bilayer supported on quartz at the indicated polar angle with respect to the surface normal; scan width is 100 G. The black traces are experimental spectra and the red traces are NLSL fits (see Materials and Methods).
The NLSL fitting program described above (Materials and Methods) was employed to extract information on the ordering of the lipid film and on lipid dynamics. The simulated spectra are shown as red traces indicating that the set of parameter (Table 1) allows a satisfying fit to the experimental data. The rotational diffusion rate as well as the order parameter is similar to those found previously by Ge and others for POPC vesicles that are in a liquid phase (Ge et al., 1994). The fit turned out to be fairly insensitive to the value of the motional asymmetry parameter N, as it has been found previously (Ge and Freed, 1999). βD was determined to 0° indicating that the long axis of the lipid molecule is on average aligned with the z axis of the nitroxide. In addition, it was assumed that the director of the order potential was collinear with the surface normal (ζ = 0°) as expected for an intact well-ordered lipid bilayer. This analysis is corroborated by similar results obtained for lipid bilayers doped with 7-doxyl-PSPC.
Protein attachment
The binding of His-tagged T4L to the model surface was investigated with respect to specificity and reversibility. As shown in Fig. 4 a, exposing T4L 72R1 to the chelating lipid bilayer gives an EPR signal that can be ascribed to the formation of an adsorbed protein layer, as discussed below. Fig. 4, b and c, show EPR spectra taken after the subsequent desorption with EDTA, and after reloading with Ni2+ and protein, respectively. The complete loss of signal after EDTA treatment illustrates that protein binding is mediated by the specific, nickel chelating complex. Reloading with nickel and protein reproduces the signal from the first preparation in terms of both line shape and intensity.
FIGURE 4.
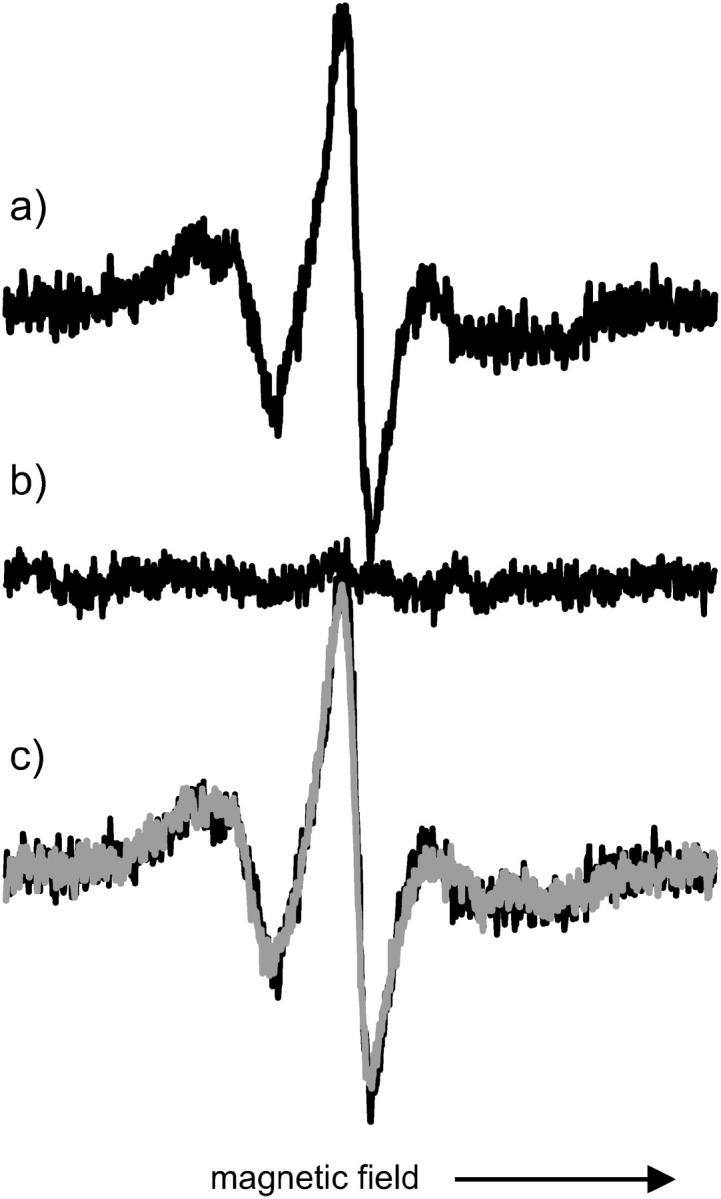
Reversibility of protein attachment. EPR spectra of bilayer during subsequent adsorption-desorption-adsorption cycle; scan width is 100 G. (Top to bottom) (a) First adsorption of T4L 72; (b) after treatment with EDTA; (c) second preparation (red); for comparison first preparation (black) underneath.
Angular-dependent EPR spectra of adsorbed T4L
Fig. 5 shows the location of the different spin-labeled residues of T4L that were prepared, one at a time, for this investigation. Most residues are solvent-exposed helix sites, where the conformation of the spin-labeled side chain is not perturbed by interaction with other protein sites (Mchaourab et al., 1996). The spin-label conformation at these sites was subject to a number of recent studies (Columbus et al., 2001; Langen et al., 2000; Mchaourab et al., 1996) predicting a site-independent preferred structure for a simple solvent-exposed residue. In addition, one loop site (22) as well as a tertiary contact site (150) was investigated.
FIGURE 5.

Model of T4L showing labeling sites. Crystal structure data were taken from Protein Data Bank (file 3lzm).
Helix surface sites (72, 76, 131)
The EPR spectra of R1 at solvent-exposed helical sites are presented in Fig. 6. The spectra in solution are juxtaposed to angular-resolved measurements taken at different angles θ between magnetic field and surface normal of T4L adsorbed to the lipid surface. The black traces are experimental spectra and the red traces the global least-square fits of the spectra to the motional model described above (see Materials and Methods). The relevant parameters of the fits are given in Table 2.
FIGURE 6.

EPR spectra of T4L labeled at helical surface sites in solution and adsorbed to lipid bilayer. (a) 72R1; (b) 76R1; (c) 131 R1. The black traces are experimental spectra and the red traces are the fits; a vertical line is added to guide the eye in panel b. Spectra of adsorbed T4L are taken under the indicated polar angle θ between surface normal and magnetic field. Scan width is 100 G.
TABLE 2.
Dynamic and orientation parameters for EPR simulations
| Residue | % Site | R (× 107 s−1) | N | S | βD (°) | σ | ζ (°) |
|---|---|---|---|---|---|---|---|
| 4 (comp 1) | 60 (80)* | 2.9 | 3.20 | 0.60 | 65 | 15 | 80 ± 5 |
| 4 (comp 2) | 40 (20)* | 5.0 | 0.94 | 0.17 | 36 | 15 | 20 ± 20 |
| 22 | 100 | 7.4 | 0.94 | 0.00 | – | – | – |
| 61 (comp 1) | 70 | 2.5 | 2.51 | 0.44 | 65 | 15 | 20 ± 10 |
| 61 (comp 2) | 30 | 8.3 | 0.94 | 0.17 | 36 | 15 | 60 ± 20 |
| 72 | 100 | 7.8 | 0.94 | 0.47 | 36 | 15 | 50 ± 5 |
| 76 | 100 | 7.6 | 0.94 | 0.27 | 36 | 15 | 90 ± 5 |
| 109 (comp 1) | 6 | 12.6 | 1.00 | 0.00 | – | – | – |
| 109 (comp 2) | 94 | 7.2 | 1.1 | 0.38 | 36 | 15 | 42 ± 5 |
| 131 | 100 | 7.8 | 0.94 | 0.35 | 36 | 15 | 73 ± 5 |
Percentage in solution. Magnetic parameters are taken from Columbus and others (Columbus et al. 2001); gxx = 2.0076, gyy = 2.0050, gzz = 2.0023, Axx = 6.2 G, Ayy = 5.9 G, Azz = 37 G.
Sites 72 and 76 are both located in the longest helix C (see Fig. 5), 72 at its center, and 76 at its C-terminal end being thus exposed to a higher degree of backbone dynamics (Columbus et al., 2001). Residue 131 is part of helix H. A qualitative comparison of the line shape measured in solution and on the lipid surface reveals no drastic changes for all residues. This indicates that the secondary structure at helices C and H is preserved upon adsorption to the lipid bilayer.
However, a closer inspection of the spectra reveals distinct variations of the line shape with respect to the incident angle of the magnetic field that proves a preferred orientation of the adsorbed T4L molecules. The anisotropy of the line shape is seen best in the low- and high-field region as indicated, e.g., in Fig. 6 b) for T4L 76R1. Here, a continuous shift of the low-field peak is observed as the angle θ is varied from 0 to 90°. It is interesting to note that the most important changes to the line shape are taking place in small regions of the polar angle. The region of enhanced line shape changes of T4L 76R1 is detected around 90° where the hyperfine splitting is maximal; for 131R1 a significant change of the low-field peak is observed in the region of 60°. In a similar way characteristic changes are found for T4L 72R1 between 45 and 60°. Because orientation of the spin label with respect to the surface is encoded in the angular-dependent EPR spectra the different behavior of the residues indicates different tilt angles of the spin label. However, a precise value of the tilt angle cannot be determined on the basis of this qualitative comparison.
The observed angular-dependent EPR spectra can be understood in detail by a quantitative line shape analysis. This analysis allows not only the determination of the orientation of the spin label, more precisely for this model the tilt angle of the director of the ordering potential with respect to the surface, but also a judgment on the secondary structure of the adsorbed protein as compared to solution. The global fits of the angular-dependent spectra of immobilized T4L to the model described in Materials and Methods proved to be sensitive to the tilt angle. However, the sensitivity depends on the mobility of the side chain as well as the tilt angle of the director. The sensitivity decreases with increasing mobility and it has a minimal sensitivity for tilt angles close to 45°. For T4L 76R1 and T4L 131R1, tilt angles of 90 and 73° were determined, respectively. These values together with the corresponding uncertainties are summarized in Table 1. The spectra of these sites can be fitted by assuming a simple azimuthal disorder of the molecules without considering polar disorder.
However, the same simple model of perfect polar order failed to reproduce the orientation-dependent spectra of T4L 72R1.To account for the observed line shape a static polar disorder had to be assumed, which has been described in the calculation by a Gaussian disorder profile. The spectra were fitted with a tilt angle of the director of 50° and a standard deviation σ of the Gaussian profile of 15 ± 5°. T4L 72R1 is known to be not severely influenced by backbone fluctuation as being situated in the center of the long helix C (Columbus et al., 2001). Thus, it is especially sensitive to ordering effects such as polar disorder. The fits made for T4L 76R1 and T4l 131R1 are consistent with the polar disorder of the molecules, although the result of the polar disorder on the EPR line shape of these residues is too small to justify the introduction of that additional parameter. It should be noted that the assumption of a static disorder does not exclude dynamics of the molecule in this degree of freedom. However, it does limit the correlation time of this motion to be larger than ∼50 ns.
Helix N-terminal residues (4, 61, 109)
Helix N-terminal residues typically show more complex EPR spectra suggestive of additional interaction(s) with the environment as compared to other solvent-exposed surface sites (Mchaourab et al., 1996). Few attempts have been made so far to describe the dynamics of the spin-labeled residue at N-terminal helical sites by spectral simulation.
Residue 4R1 is located at the N-terminus of the protein at the first turn of helix A. Residue 61R1 is situated at the N-terminus of the longest helix C, the same helix probed by the solvent exposed helical sites 72R1 and 76R1. Residue 109R1 is part of the N-terminal turn of helix F.
The EPR spectra of these residues are presented in Fig. 7. All three solution spectra require two components of different mobility to account for the complex line shape. Moreover, the possible values of dynamic parameters have to be extended beyond those usually used for helix surface sites (Columbus and Hubbell, 2004; Columbus et al., 2001).
FIGURE 7.

EPR spectra of T4L labeled at N-terminal helix sites in solution and adsorbed to lipid bilayer. (a) 4R1; (b) 61R1; (c) 109 R1. Spectra of adsorbed T4L are taken under the indicated polar angle between surface normal and magnetic field. Scan width is 100 G.
The EPR spectrum of 109R1 in solution can be fit on the basis of a fast and isotropic component with a small spectral weight and a component showing typical dynamical parameters of solvent-exposed sites except for an unusual degree of anisotropy of motion (N). The parameters determined from the solution spectrum were able to describe the angular-dependent spectra giving a tilt angle of 42°.
The most abundant component of T4L 61R1 in solution is a relatively immobilized component, as compared to helix surface sites, with a highly anisotropic rotational diffusion tensor. In addition, the tilt angle βD between the director and magnetic tensor framework has to be changed as compared to the solvent-exposed helical sites investigated before. Here a βD of 65° has to be used to describe the line shape reasonably well. The second component in the T4L 61R1 spectra is a little more mobile than the other helix surface sites, but the motional anisotropy (N) and βD fall into the common scheme. Although the ordering potential of the second component is even less pronounced than that of T4L 76R1, both components contribute to the angular dependence of the line shape. For the fast component a tilt angle of 60° was extracted whereas 20° was determined for the slow component. A large error bar of ±20° was found for the tilt angle of the fast component due to the low signal/noise ratio for the spectra of T4L 61R1 as well as the weak angular dependence of that component.
The spectra of T4L 4R1 are most difficult to describe. In solution the spectrum can be fit on the basis of two components as it was done for the two other N-terminal sites under investigation. Similarly to 61R1, the first component exhibits a high motional anisotropy and a βD other than 36° and the second component falls at least in terms of N and βD into the parameter regime of helix surface sites. The order parameter is the same as for 61R1-component 2, but the motional rate is reduced relative to helix surface sites. Despite the uncertainties of the fits resulting from the lack of established starting values for fitting as present for helix surface sites a significant increase of the mobile component from 20% in solution to ∼40% on the surface was found. The spectra of adsorbed T4L 4R1 display an angular dependence of both components. The simulation gives tilt angles of 20° for component 1 and 80° for component 2.
Tertiary contact (150)
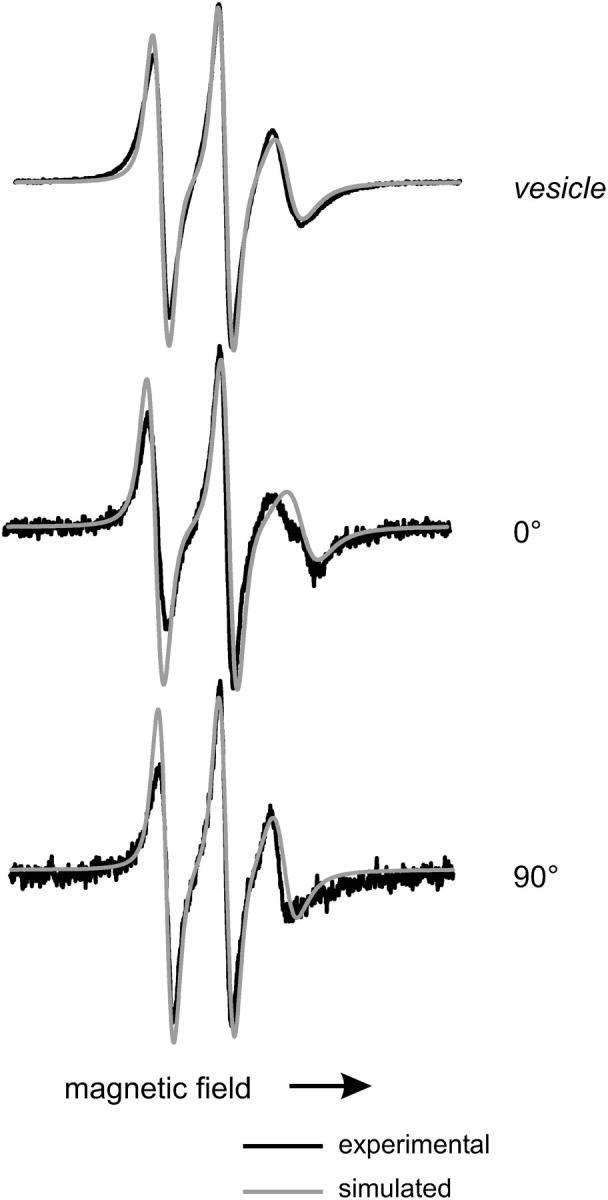
Site 150 is located in helix J at a contact surface with helix H. The crystal structure of 150R1 reveals tertiary interactions of the R1 side chain with residues in both helices H and I. These interactions cause a strict confinement of the spin-label conformation that is also reflected by the line shape of the EPR spectrum (M. Fleissner, D. Cascio, and W. L. Hubbell, unpublished). A qualitative comparison of the solution spectrum with the angular-dependent spectra measured on the planar bilayer indicates that the line shape and thus the local environment of the spin label changes upon adsorption. This is most obvious in the low-field region of the spectra shown in Fig. 8. Although the solution spectrum shows two well-separated maxima in this region, the angular-resolved spectra reveal all substantial intensity in the region between the maxima. However, a direct comparison of the data is hampered by the angular dependence of the spectra in the adsorbed state. To overcome this problem T4L 150R1 was adsorbed to large unilamellar lipid vesicles (diameter ∼400 nm) as prepared by extrusion through a membrane. The resulting EPR spectrum (Fig. 9) can be readily compared to the one in solution. Both spectra show large similarities. However, the well-resolved parallel and perpendicular hyperfine components in the low-field region of the spectrum are considerably smeared out after adsorption to the lipid vesicles. This is exactly the region of the spectrum where additional intensity is also found in the case of the planar surface.
FIGURE 8.
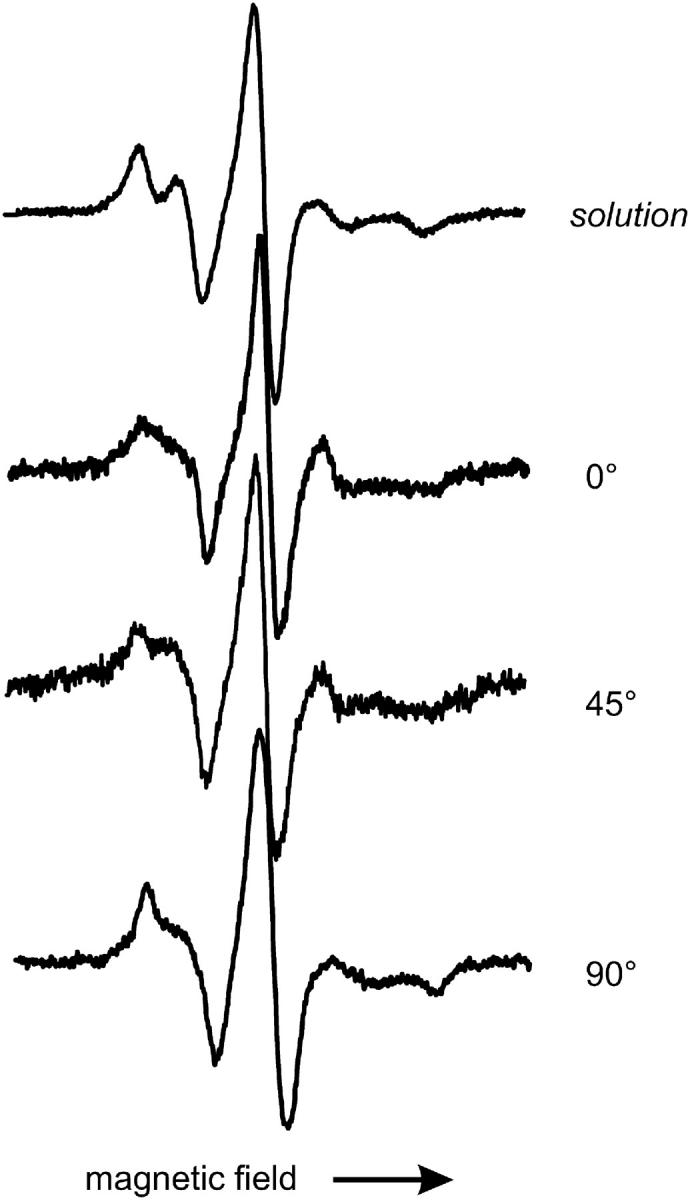
EPR spectra of T4L labeled at the tertiary contact site 150 in solution and adsorbed to lipid bilayer. Spectra of adsorbed T4L are taken under the indicated polar angle between surface normal and magnetic field. Scan width is 100 G.
FIGURE 9.

EPR spectrum of T4L 150R1 adsorbed to large unilamellar vesicles of 400-nm diameter. Scan width is 100 G.
Loop site (22)
The motion of the spin-labeled side chain at loop sites is dominated by the high backbone mobility at these residues. Thus, the analysis of EPR spectra gained from labeling these sites are not expected to be especially useful to obtain protein orientations on surfaces, as contributions arising from protein ordering are subjected to dynamical averaging. However, site 22 was selected to illuminate eventual structural changes of adsorbed T4L in domain I, the region including not only helices A and B but also a β-sheet and a number of loops. Site 22 is part of the loop at the opening of the substrate cleft that comprises also Asp-20, presumably involved in substrate binding (Kuroki et al., 1993).
The acquired EPR spectra of adsorbed T4L 22R1 do not indicate structural changes of the adsorbed protein as the surface spectra can be fit with the dynamic parameters of the solution fit (Fig. 10). As shown in Table 2 the spectra in solution and on the surface can be fit without employing an order parameter. Thus, isotropic spectra are observed as T4L 22R1 is adsorbed on the surface, which prohibits the extraction of orientational data thereof.
FIGURE 10.

EPR spectra of T4L 22R1 in solution and adsorbed to lipid bilayer. Scan width is 100 G.
DISCUSSION
Lipid bilayer
To invoke a method to investigate the structure and dynamics of adsorbed proteins by EPR spectroscopy it is of outstanding importance to create a well-defined model surface that is stable on the timescale of the experiments. The chosen quartz-supported lipid bilayer surfaces have already been investigated by other techniques as the quartz crystal microbalance (Keller et al., 2000), fluorescence recovery after photobleaching (Kalb et al., 1992), and impedance spectroscopy (Wiegand et al., 2002). From these results the formation of a well-ordered, laterally mobile film without pin holes is inferred. By the use of spin-labeled lipid probes, lipid systems become susceptible for analysis by EPR spectroscopy. In the past, EPR spectroscopy has been used to investigate lipid vesicle dispersions in detail, providing a wealth of information on lipid structure and dynamics (e.g., Hubbell and McConnell 1969; Marsh and Horvath 1998; Swamy and Marsh 2001).
In this study an analogous EPR study of the planar model surface was performed. The analysis of the spectra revealed a well-defined orientation of the lipid molecules. In addition, a temperature-dependent investigation for different positions of the spin label along the alkyl chain shows, that the lipid bilayer is in a fluid phase in the temperature range between 18 and 28°C. This is consistent with fluorescence recovery after photobleaching experiments described before (Kalb et al., 1992). It also implies that the model surface can be considered as a simple model for a biological membrane.
His-tagged T4L can be bound reversibly to this lipid surface. Thus, no unspecific binding of the protein to the lipid surface is involved but the protein attachment is selectively established by the His-linker. The coordinative binding via the central nickel atom leads to a vectorial alignment of T4L on the surface.
To estimate the protein coverage the (reproducible) EPR intensity was analyzed. The protein coverage was assessed by a side-on adsorption (motivated by the central position of the His-tag in the protein) of closed packed ellipsoids. The length of the principal axes was taken from crystal structure data of T4L. By comparing the integrated EPR intensity of the protein layer with that measured for a dense spin-containing lipid bilayer under the same experimental conditions a density of 75 ± 15% of an ideal protein monolayer is deduced. The large error bar results from uncertainties in the determination of the double integrated spectra due to the poor signal/noise ratio and particularly due to baseline artifacts. The effective protein density is enhanced by the fact that the spin-labeling efficiency does not always achieve 100%. Moreover, the calculation assumes a closed packed array of ellipsoids. In reality, there will be a substantial amount of azimuthal disorder that reduces the achievable density considerably. Therefore, we assume this coverage to be close to a “full” monolayer. From the lack of appreciable dipolar coupling between the spin labels it can be concluded that average distance has to be larger than ∼20 Å.
Furthermore, the presence of multilayer protein aggregates, as it has been observed with chemically different lipid bilayers (K. Jacobsen and T. Risse, unpublished data), can be excluded because the binding proved to be nickel dependent and the histidine linkage can only be formed in the first surface layer. Because the reversibility has been checked at the end of each set of experiments, ageing processes can also be excluded.
Angular-dependent EPR spectra of adsorbed T4L
Secondary structure of adsorbed T4L
The qualitative comparison of EPR spectra of adsorbed T4L with those of T4L in its native solution conformation lead to the conclusion that the secondary structure does not change dramatically upon adsorption. The analysis is corroborated by the quantitative line shape analysis. It was shown that the EPR spectra of solvent-exposed helical sites in solution and in the adsorbed state can be simulated with a consistent set of dynamical parameters using a simple model of vectorially adsorbed molecules. Because the line shape is a sensitive fingerprint of the side-chain dynamics, the consistent description of both states prove that the local environment of the side chain is preserved upon adsorption.
MOMD simulations of the EPR spectra for R1 at N-terminal helical sites have not been previously reported. The EPR spectra of N-terminal sites obtained in this study could not be simulated using established parameters for helix surface sites, where extensive studies have shown that their dynamics can be described by a single component. In particular, a tilt angle βD between the dynamical frame and the magnetic frame of 36° and an anisotropy parameter of the dynamics N slightly <1 were consistently found, whereas the rate of the motion as well as the order parameter changes from site to site, indicative of the different amount of backbone fluctuations.
To simulate the EPR spectra of N-terminal sites under investigation a larger part of parameter space has been searched extensively for suitable and physically meaningful sets of values. In terms of a qualitative line shape analysis it has been proposed that EPR spectra of N-terminal sites characteristically consist of two components (Mchaourab et al., 1996). In this work two components had to be assumed for all three N-terminal sites to fit the data. A component characterized by a βD of 36° and an anisotropy parameter N of 0.94 was found for each of the N-terminal sites, which is comparable to the parameters used for solvent-exposed helical sites. However, a second component needs to be included to account for the observed line shape. The second components of 4R1 and 61R1 show a reduced mobility and a βD different than 36° whereas the spectrum of 109R1 contains a small amount of a fast second component.
The situation of 4R1 and 61R1 can be understood by the presence of two different conformations of the side chain with an exchange rate slow on EPR timescale. One of these is characterized by dynamical parameters typically found for solvent-exposed helix surface sites (especially βD of 36° is conserved). Therefore, this spectral component corresponds to a conformation commonly found for helix surface sites. The other component is characterized by interactions with nearby residues qualitatively comparable to the situation for 119R1 as revealed by crystal structure analysis (Langen et al., 2000). The additional interaction with other residues explains the low mobility of this component as well as an unusual mode of motion indicated by the different value of βD required to simulate the spectrum. Interestingly, the immobilized components of T4L 4R1 and T4L 61R1 can be described using similar fitting parameters; in particular both exhibit a significantly increased anisotropy of the nitroxide motion as compared to helix surface sites and the same unusual value of βD = 65°. This interpretation is consistent with the qualitative analysis by Mchaourab et al. proposing these N-terminal sites to be involved in reciprocal backbone side-chain hydrogen bonding with “capping sites” of the helices in the preceding turn (Lu et al., 1999; Mchaourab et al., 1996).
When T4L is adsorbed to the lipid bilayer, 61R1 can be fitted with the same set of parameters as in solution indicating the conservation of the secondary structure. In particular, the ratio between the two components remains the same even though it was a free parameter of the global fit to the angular-dependent spectra. The spectra of 4R1 on the surface can also be fitted using the same dynamical parameters as in solution. However, the ratio of the two components changes in favor of the more mobile component, which indicates that the structure of T4L is slightly modified at this position.
This effect can be explained by a situation where the local environment is changed slightly, e.g., a subtle change of the distance to an adjacent helix that is responsible for the stabilization of the interacting conformation. However, the perturbation is small enough not to change the dynamic behavior within the two conformations considerably. Under these assumptions a destabilization of the interacting conformation will result in a change of the population of the two states in favor of the more mobile contribution. This subtle modification is not unexpected for a position very close to the adsorption site of the molecule.
The EPR spectra of 109 are also fit on the basis of two components, but it is dominated by the component indicative for a solvent-exposed helical site. The other component is fast and isotropic and contributes just 6% to the total intensity. In contrast to 4R1 and 61R1 no indication for an immobilized conformation is found. Based on the low amount of quantitatively analyzed spectra of N-terminal sites no definite statement on the general character of spin-labeled side-chain motion at N-terminal helix sites can be made. Yet, 61R1, located at the long rigid helix C, should be a good example of a standard N-terminal helical site as it is stabilized by the residual helix backbone. The difference between 109R1 and the two other residues, 61R1 and 4R1, may be attributed to the special conformation of helix F, whose first turn—in which 109 is located—is snapped off the rest of the helix (see Fig. 5). This leads to a unique situation in T4L that may account for the different side-chain properties of 109R1.
The investigation of 22R1, situated in the center of the less-structured region of T4L participating in the interaction with the saccharine substrate, revealed, that no protein-protein or protein-surface interaction can be detected at the local environment of 22R1. Thus, it can be deduced that not only the helical arrangement stays intact when T4L is coordinatively attached to a lipid bilayer surface but also the more flexible region probed remains in the solution conformation.
As mentioned above, the EPR spectra of T4L 150R1 reflect tertiary interactions with side chains in both helices H and I. Thus, the resulting unique dynamics of 150R1 is dictated by the relative position of 150R1 and these helices. The failure of a consistent description of the EPR spectra of T4L 150R1 in solution and adsorbed to the lipid bilayer suggests a perturbation of this tertiary interaction. This hypothesis is corroborated by comparison to the spectra of T4L 150R1 in solution and as adsorbed to large unilamellar vesicles. Similar to the spectra observed on the planar surface, a redistribution of spectral weight is observed smearing out the characteristic double-peak feature of the solution spectra. The difference in the spectra between these cases can be interpreted in terms of a weakened tertiary interaction and a population of a second conformation. Thus, it is concluded that the tertiary organization in the helix bundle of T4L is slightly modified due to the protein-surface interaction, involving at least the relative orientation between helices H, I, and J and their connecting loops. However, these changes are only subtle and the observations do not indicate a global distortion of the tertiary fold of adsorbed T4L.
This effect emphasizes the sensitivity with which EPR spectroscopy is able to probe conformational changes of proteins on surfaces. The energy of opening this specific tertiary interaction is comparable with the thermal energy and is thus very sensitive to additional interaction of the whole protein. Hence, tertiary contact sites are particularly promising to probe small distortions of the structure of adsorbed proteins.
Protein orientation
The EPR spectra observed for all residues but 22 show a distinct angular dependence that is a direct consequence of the vectorial attachment of the protein. From the line shape analysis one can directly extract the orientation of the director of the ordering potential. However, a translation of this information into an orientation of the molecule on the surface requires knowledge about the conformation as well as the rotational dynamics of the side chain. The best starting point for this discussion are solvent-exposed helical sites. For these sites that are characterized by the absence of interactions with the environment, it was shown that the internal dynamic mode of R1 may be treated site independent (e.g., Columbus et al., 2001). In addition, it was concluded that the rotational dynamics of the nitroxide is determined by rotation about the C-Cring bond (X5) and the C-Sδ bond (X4) (see Fig. 1) (Columbus et al., 2001). This assignment is based on a variety of experimental results including crystallographic investigations of spin-labeled T4L. From these investigations it was concluded that the side chain exhibits well-defined dihedral angles X1 and X2 (for definition of terminology; Lovell et al., 2000). The g−g− (X1 ∼ 300°, X2 ∼ 300°) is the most abundant conformation found by x-ray crystallography for helix surface sites (Lietzow and Hubbell, 2004). The crystal structure of T4L 131R1 reveals an interesting situation, namely two conformations can exist simultaneously. Beside the g−g− conformation also the tg+ rotamer was observed (M. Fleissner, D. Cascio, and W. L. Hubbell, unpublished data). This is in line with density functional theory and molecular modeling calculations (Herbst, 2003) predicting these two conformations being almost degenerate in energy, though, favoring the g−g− conformation slightly. These data collectively suggest the g−g− rotamer to be the most probable conformation in the absence of additional local interaction. The disulfide bond can adopt two conformations X3 ∼ 90°, 270° (g+, g−). Interconversion between these states has a free energy of activation of 28–38 kJ/mol as shown experimentally as well as theoretically (e.g., Sokalski et al., 1991; Weaver and Matthews, 1987), so that the S-S bond can be considered rigid on the timescale of EPR spectroscopy. Due to steric constraints, the tg+ conformation is associated with X3 being +90° and the g−g− with X3 = −90°, respectively. The direction of the Cα-Cβ bond with respect to the helix is assumed to be identical to the one of the native amino acid, which is a reasonable assumption considering that this orientation is primarily determined by the secondary structure.
With this information it is possible to model the direction of the C-Sδ bonds of the two conformations with respect to the protein backbone. This direction is taken as the orientation of the director of the ordering potential used in the simulations of the EPR spectra. The points that lead to this assignment are: 1), the main rotational axes of the R1 side chain are the C-Cring bond (X5) and the C-Sδ bond (X4) as mentioned above; 2), the rotation about the C-Cring bond is hindered due to interactions of the Sδ atom with substituents of the ring, which gives rise to a restoring potential; and 3), the rotation about the C-Sδ bond is relatively unhindered. In addition, the direction of the C-Sδ bond with respect to the π*-orbital of nitroxide is ∼36° for the equilibrium geometry. Thus the C-Sδ bond was assigned to be collinear with the director of the ordering potential (Columbus et al., 2001). The minimum structure developed according to the above-mentioned results is shown in Fig. 11. Here, X1, X2, and X3 are assumed to be fixed at the given values whereas X4 and X5 will vary on the timescale of the EPR experiments. With these assumptions the tilt angle of the director determined for the three solvent-exposed helical sites 72, 76, and 131 can be translated in an orientation of the corresponding helices. This is done by a least-square fitting of the angles between the C-Sδ bonds and the surface normal and the corresponding tilt angles (ζ) determined spectroscopically for the various sites.
FIGURE 11.

Ball-and-stick model of MTSSL in the g−g− conformation.
If all conformations of the side chain were taken into account, the optimal orientation of the molecule gives the angles between the C-Sδ bond and the surface normal given in Table 3. As the two conformations coincide at the Cγ position the two R1 conformations give similar values of ζ for some of the orientations. A difference of 10–15° between calculated and observed values is well within the error of the current model that assumes, e.g., ideal angles for the gauche and trans conformations that are known to spread around the ideal values giving rise to the mentioned error. However, some of the differences seem to be out of the error bar of the current experiments. This indicates that these conformations are probably populated to a small extent. The respective conformations (that are italicized in Table 3) were not taken into account for the final determination of the protein orientation on the lipid bilayer surface. However, the difference between the orientations resulting from all conformations as compared to those gained from the selected conformations is 10°, which allows estimating uncertainties of the described procedure following from the unknown population of the two R1 conformations. Additionally, it should be kept in mind that the protein ensemble shows substantial polar disorder as seen from the analysis of EPR spectra of 72R1. At this point it cannot be excluded that part of the spectral broadening interpreted as polar disorder is actually due to the simultaneous population of multiple conformations of R1.
TABLE 3.
Orientations of C-Sδ bonds as determined by SLE simulation of EPR spectra are compared to the values obtained by modeling T4L onto the surface
| Residue | Result EPR | Model g−g− | Model tg+ |
|---|---|---|---|
| 61 (comp 2) | 60 ± 20 | 50 | 54 |
| 72 | 50 ± 5 | 58 | 61 |
| 76 | 90 ± 5 | 83 | 61 |
| 109 (comp 2) | 42 ± 5 | 49 | 62 |
| 131 | 73 ± 5 | 52 | 60 |
Calculated C-Sδ values that are not in the margin of error are italicized.
The orientation of the protein on the surface can already be obtained by the analysis of the three helix surface sites under investigation, as these sites probe the orientation of helices C and H, which are orientated almost perpendicular to each other.
The analysis of the N-terminal sites in terms of protein orientation is not as straightforward because two components are necessary to describe the line shape of the EPR spectra. As discussed in the previous section the component characterized by a βD of 36° is assigned to a conformation comparable with regular solvent-exposed helical sites. Thus, this component was utilized to reconfirm the protein orientation determined by analysis of helix surface sites. The analysis of component 2 of 61R1 fits into the orientation helix C, though this statement is limited by the large error bar of the tilt angle ζ. The calculated tilt angle of 4R1 conformation is not considered in terms of protein orientation because of the relatively large deviation of the diffusion rates from those of other solvent-exposed helical sites that may be due to tertiary contacts. A more crucial check presents the analysis of residue 109 because the calculated tilt angle is highly reliable. In addition, it allows a more precise orientation of the molecule along the third direction, because its direction is mutually perpendicular to residues 131, 76, and 72. It is shown that one of the conformations fits nicely to the calculated protein orientation.
The resulting orientation of the protein on the lipid surface is shown in Fig. 12. The extracted orientation is an almost symmetric configuration of the protein with respect to the surface. However, the C-terminal domain points more toward the surface whereas the N-terminal domain points toward the liquid phase. From the spectral data this orientation cannot be distinguished from the mirror image with respect to the surface. However, the other orientation can be excluded based on the position of the His-tag with respect to the surface. It should be stressed that from our experiments nothing is known on the distance between the lipid surface and the protein molecule. Thus the indicated surface should be considered as a guide to the eye.
FIGURE 12.

Orientation of T4L adsorbed to a DOPC bilayer. Structure is taken from the PDB (file 3lzm).
It should be emphasized, that a consistent description of the tilt angles of the order potential in terms of spin-labeled side-chain orientation, assuming the X4/X5 model of motion proposed earlier (Columbus et al., 2001; Langen et al., 2000) is nontrivial. Therefore, this analysis shows that it is not only possible to determine the orientation of the protein or that of secondary structure elements with respect to the lipid surface but also possible to provide additional experimental evidence for the previously proposed correlation between the X4/X5 model and the theoretical description within the SLE formalism, namely the assignment of the C-Sδ bond to be collinear with the director of the order potential.
GENERAL SUMMARY
A main objective of this study is to evaluate the capabilities of continuous wave (CW) X-band EPR spectroscopy to study the structure and specifically the orientation of proteins adsorbed to surfaces. By the use of a specific lipid linker a monolayer of adsorbed protein was generated providing a well-defined situation of a protein-surface interface. The use of planar surfaces increases the information content of the spectra significantly. In particular, information about the orientation of the molecules or secondary structure elements with respect to the surface can be obtained. The strategy is not restricted to proteins tethered to surfaces. It can be readily extended to membrane or membrane-associated proteins where information on orientation are often crucial to the understanding of the system.
Stochastic Liouville equation simulations can be used not only to analyze spectra of helix surface sites (Columbus et al., 2001) and β-sheet proteins (Lietzow and Hubbell, 2004) but also as performed in this study to analyze N-terminal helix sites and proteins adsorbed to planar surfaces. In the latter case implementing a model of protein orientation on the surface into the framework of the SLE formalism allows us to determine the orientation of secondary structure elements with respect to the surface by simulating angular-dependent EPR spectra, information of paramount importance, e.g., to study membrane-mediated processes. It should be noted in passing that the structural information extracted from a series of angular-dependent EPR spectra is obviously more reliable than those gained from an isotropic sample and the corresponding MOMD fit to a solution spectrum (Budil et al., 1996).
To quantitatively analyze EPR spectra of spin-labeled protein in terms of protein structure and dynamics it is of outstanding importance to reveal the dynamic modes of the spin-labeled side chain and understand the correlation between the microscopic dynamics and the model used to describe it. To this end the X4/X5 model was introduced based on a number of studies employing a variety of techniques. However, the interpretation of molecular dynamics in terms of the MOMD model used to describe the spectra remained vague. Here we could provide further evidence that the proposed coincidence between the director of the potential and the S-C bond is indeed a valid assumption that allows a consistent description of a large number of experiments.
CW X-band EPR spectroscopy proves to provide the sensitivity to detect small structural changes of adsorbed spin-labeled T4L. For example, the tertiary interactions of 150R1 apparently lead to great sensitivity for sensing small perturbations in the tertiary fold. Thus, EPR spectroscopy provides a powerful tool to study not only protein structure and orientation but also the result of interactions with a surface on the structure of the protein.
In the future a variety of experiments already well established for SDSL in solution may also be transferred to planar geometries. One of the most promising experiments is the investigation of dipolar interactions in double-labeled systems, which allows us to measure distances below 25 Å for CW EPR. Small distances will be challenging but it is feasible to see dipolar coupling in a single layer for distances of ∼18 Å (K. Jacobsen and T. Risse, unpublished data). In addition, the broadening is angular dependent, which allows us in principle to determine not only the distance but also the orientation between two residues, information that can be very useful for the investigation of adsorbed proteins.
Acknowledgments
We are grateful to Prof. H.-J. Freund for his support of this work. K.J. thanks the Studienstiftung des Deutschen Volkes for a scholarship.
The work was supported by Max-Planck Society, National Institutes of Health grant EY05216 (W.L.H.), and the Jules Stein Professorship Endowment (W.L.H.).
References
- Barenholz, Y., D. Gibbes, B. J. Litman, J. Goll, T. E. Thompson, and R. D. Carlson. 1977. A simple method for the preparation of homogeneous phospholipid vesicles. Biochemistry. 16:2806–2810. [DOI] [PubMed] [Google Scholar]
- Brisson, A., G. Mosser, and R. Huber. 1991. Structure of soluble and membrane-bound human annexin V. J. Mol. Biol. 220:199–204. [DOI] [PubMed] [Google Scholar]
- Budil, D. E., S. Lee, S. Saxena, and J. H. Freed. 1996. Nonlinear-least-squares analysis of slow-motion EPR spectra in one and two dimensions using a modified Levenberg-Marquardt algorithm. J. Magn. Reson. Ser. A. 120:155–189. [Google Scholar]
- Columbus, L., and W. L. Hubbell. 2002. A new spin on protein dynamics. Trends Biochem. Sci. 27:288–295. [DOI] [PubMed] [Google Scholar]
- Columbus, L., and W. L. Hubbell. 2004. Mapping backbone dynamics in solution with site-directed spin labeling: GCN4-58 bzip free and bound to DNA. Biochemistry. 43:7273–7287. [DOI] [PubMed] [Google Scholar]
- Columbus, L., T. Kalai, J. Jekoe, K. Hideg, and W. L. Hubbell. 2001. Molecular motion of spin labeled side chains in α-helices: analysis by variation of side chain structure. Biochemistry. 40:3828–3846. [DOI] [PubMed] [Google Scholar]
- Cremer, P. S., and S. G. Boxer. 1999. Formation and spreading of lipid bilayers on planar glass supports. J. Phys. Chem. B. 103:2554–2559. [Google Scholar]
- Feix, J. B., and C. S. Klug. 1998. Site-directed spin labeling of membrane proteins and peptide-membrane interactions. In Biological Magnetic Resonance. Spin Labeling: The Next Millennium, Vol. 14. L. J. Berliner, editor. Plenum Press, New York, NY. 251–281.
- Ge, M. T., D. E. Budil, and J. H. Freed. 1994. An electron-spin-resonance study of interactions between phosphatidylcholine and phosphatidylserine in oriented membranes. Biophys. J. 66:1515–1521. [DOI] [PMC free article] [PubMed] [Google Scholar]
- Ge, M. T., and J. H. Freed. 1999. Electron-spin resonance study of aggregation of gramicidin in dipalmitoylphosphatidylcholine bilayers and hydrophobic mismatch. Biophys. J. 76:264–280. [DOI] [PMC free article] [PubMed] [Google Scholar]
- Ge, M. T., A. Gidwani, H. A. Brown, D. Holowka, B. Baird, and J. H. Freed. 2003. Ordered and disordered phases coexist in plasma membrane vesicles of RBL-2H3 mast cells. An ESR study. Biophys. J. 85:1278–1288. [DOI] [PMC free article] [PubMed] [Google Scholar]
- Herbst, A. 2003. Theoretische Untersuchungen zur Dynamik der Seitenkette spingelabelter Proteine. FU Berlin, Berlin, Germany.
- Hubbell, W. L., D. S. Cafiso, and C. Altenbach. 2000. Identifying conformational changes with site-directed spin labeling. Nat. Struct. Biol. 7:735–739. [DOI] [PubMed] [Google Scholar]
- Hubbell, W. L., A. Gross, R. Langen, and M. A. Lietzow. 1998. Recent advances in site-directed spin labeling of proteins. Curr. Opin. Struct. Biol. 8:649–656. [DOI] [PubMed] [Google Scholar]
- Hubbell, W. L., and H. M. McConnell. 1969. Orientation and motion of amphiphilic spin labels in membranes. Proc. Natl. Acad. Sci. U.S.A. 64:20–27. [DOI] [PMC free article] [PubMed] [Google Scholar]
- Kalb, E., S. Frey, and L. K. Tamm. 1992. Formation of supported planar bilayers by fusion of vesicles to supported phospholipid monolayers. Biochim. Biophys. Acta. 1103:307–316. [DOI] [PubMed] [Google Scholar]
- Keller, C. A., K. Glasmastar, V. P. Zhdanov, and B. Kasemo. 2000. Formation of supported membranes from vesicles. Phys. Rev. Lett. 84:5443–5446. [DOI] [PubMed] [Google Scholar]
- Kuroki, R., L. H. Weaver, and B. W. Matthews. 1993. A covalent enzyme-substrate intermediate with saccharide distortion in a mutant T4 lysozyme. Science. 262:2030–2033. [DOI] [PubMed] [Google Scholar]
- Langen, R., K. Cai, C. Altenbach, H. G. Khorana, and W. L. Hubbell. 1999. Structural features of the C-terminal domain of bovine rhodopsin: a site-directed spin-labeling study. Biochemistry. 38:7918–7924. [DOI] [PubMed] [Google Scholar]
- Langen, R., K. J. Oh, D. Cascio, and W. L. Hubbell. 2000. Crystal structures of spin labeled T4 lysozyme mutants: implications for the interpretation of EPR spectra in terms of structure. Biochemistry. 39:8396–8405. [DOI] [PubMed] [Google Scholar]
- Lee, S., D. E. Budil, and J. H. Freed. 1994. Theory of two-dimensional Fourier transform electron spin resonance for ordered and viscous fluids. J. Chem. Phys. 101:5529–5558. [Google Scholar]
- Libertini, L. J., and O. H. Griffith. 1970. Orientation dependence of the electron spin resonance spectrum of di-t-butyl-nitroxide. J. Chem. Phys. 53:1359–1367. [Google Scholar]
- Lietzow, M. A., and W. L. Hubbell. 2004. Motion of spin label side chains in cellular retinol-binding protein: correlation with structure and nearest-neighbor interactions in an antiparallel β-sheet. Biochemistry. 43:3137–3151. [DOI] [PubMed] [Google Scholar]
- Lovell, S. C., J. M. Word, J. S. Richardson, and D. C. Richardson. 2000. The penultimate rotamer library. Proteins. 40:389–408. [PubMed] [Google Scholar]
- Lu, M., W. Shu, H. Ji, E. Spek, L. Y. Wang, and N. R. Kallenbach. 1999. Helix capping in the GCN4 leucine zipper. J. Mol. Biol. 288:743–752. [DOI] [PubMed] [Google Scholar]
- MacDonald, I. D. G., and W. E. Smith. 1996. Orientation of cytochrome c adsorbed on a citrate-reduced silver colloid surface. Langmuir. 12:706–713. [Google Scholar]
- Marsh, D., and L. I. Horvath. 1998. Structure, dynamics and composition of the lipid-protein interface. Perspectives from spin-labelling. Biochim. Biophys. Acta. 1376:267–296. [DOI] [PubMed] [Google Scholar]
- Mchaourab, H. S., M. A. Lietzow, K. Hideg, and W. L. Hubbell. 1996. Motion of spin-labeled side chains in T4 lysozyme. Correlation with protein structure and dynamics. Biochemistry. 35:7692–7704. [DOI] [PubMed] [Google Scholar]
- Meirovitch, E., A. Nayeem, and J. H. Freed. 1984. Analysis of protein-lipid interaction based on model simulations of electron spin resonance spectra. J. Phys. Chem. 88:3354–3465. [Google Scholar]
- Opella, S. J., and F. M. Marassi. 2004. Structure determination of membrane proteins by NMR spectroscopy. Chem. Rev. 104:3587–3606. [DOI] [PMC free article] [PubMed] [Google Scholar]
- Perrenoud-Rinuy, J., P. F. Brevet, and H. H. Girault. 2002. Second harmonic generation study of myoglobin and hemoglobin and their protoporphyrin IX chromophore at the water/1,2-dichloroethane interface. Phys. Chem. Chem. Phys. 4:4774–4781. [Google Scholar]
- Risse T., W. L. Hubbell, J. M. Isas, and H. T. Haigler. 2003. Structure and dynamics of annexin 12 bound to a planar lipid bilayer. Phys. Rev. Lett. 91:188101/1–188101/4. [DOI] [PubMed] [Google Scholar]
- Sauer, U. H., D. P. Sun, and B. W. Matthews. 1992. Tolerance of t4-lysozyme to proline substitutions within the long interdomain alpha-helix illustrates the adaptability of proteins to potentially destabilizing lesions. J. Biol. Chem. 267:2393–2399. [PubMed] [Google Scholar]
- Schneider, D. J., and J. H. Freed. 1989. Calculating slow motional magnetic resonance spectra: a user's guide. In Spin Labeling Theory and Applications. L. J. Berliner and J. Reuben, editors. Plenum Press, New York, NY. 1–76.
- Singer, S. J., and G. L. Nicolson. 1972. Fluid mosaic model of structure of cell-membranes. Science. 175:720–731. [DOI] [PubMed] [Google Scholar]
- Sokalski, W. A., J. Lai, N. Luo, S. Sun, M. Shibata, R. Ornstein, and R. Rein. 1991. Ab initio study of the electrostatic multipole nature of torsional potentials in dimethyl disulfide, methylhydro disulfide, and hydrogen peroxide. Int. J. Quantum Chem. 18:61–71. [DOI] [PubMed] [Google Scholar]
- Su, T. J., J. R. Lu, R. K. Thomas, Z. F. Cui, and J. Penfold. 1998. The adsorption of lysozyme at the silica-water interface: a neutron reflection study. J. Colloid Interface Sci. 203:419–429. [DOI] [PubMed] [Google Scholar]
- Swamy, M. J., and D. Marsh. 2001. Specific surface association of avidin with n-biotinylphosphatidylethallolamine membrane assemblies: effect on lipid phase behavior and acyl-chain dynamics. Biochemistry. 40:14869–14877. [DOI] [PubMed] [Google Scholar]
- Waggoner, A. S., T. J. Kingzett, S. Rottscha, O. H. Griffith, and A. D. Keith. 1969. A spin-labeled lipid for probing biological membranes. Chem. Phys. Lipids. 3:245–253. [DOI] [PubMed] [Google Scholar]
- Weaver, L. H., and B. W. Matthews. 1987. Structure of bacteriophage-T4 lysozyme refined at 1.7 Å resolution. J. Mol. Biol. 193:189–199. [DOI] [PubMed] [Google Scholar]
- Wiegand, G., N. Arribas-Layton, H. Hillebrandt, E. Sackmann, and P. Wagner. 2002. Electrical properties of supported lipid bilayer membranes. J. Phys. Chem. B. 106:4245–4254. [Google Scholar]
- Wood, L. L., S. S. Cheng, P. L. Edmiston, and S. S. Saavedra. 1997. Molecular orientation distributions in protein films. 2. Site-directed immobilization of yeast cytochrome c on thiol-capped, self-assembled monolayers. J. Am. Chem. Soc. 119:571–576. [Google Scholar]