Abstract
Second harmonic generation offers an important alternative and complement to fluorescence for the imaging of cellular structure and function. Staining the eggs of the sea urchin, Lytechinus pictus, with the styryl dye di-8-ANEPPS, we have observed large changes in both second harmonic generation and two-photon fluorescence after fertilization, consistent with the dynamics of exocytosis of cortical granules. With nonlinear imaging on a scanning microscope, we are able to visualize the wave of exocytosis in real time.
Second harmonic generation (SHG) is a nonlinear optical phenomenon that has been exploited in laser-scanning microscopes as an imaging modality that complements two-photon fluorescence (2PF) microscopy. Whereas 2PF involves the excitation of a fluorophore by absorption of two photons, followed by relaxation and noncoherent emission, SHG is a nonabsorptive process in which two photons are coherently converted into a single photon of twice the energy. Biological applications involve either intrinsic SHG from structural proteins such as collagen (1) and cellulose (2) or extrinsic SHG from membrane-staining styryl dyes (3). As a tool for studying electrophysiology by less invasive optical methods, such dyes have been primarily developed for significant electrochromic shifts in their fluorescence spectra (4), but they also have the requisite molecular characteristics for SHG. We have previously shown that the sensitivity to membrane potential of SHG from dyes with the ANEP chromophore is both large and dependent on wavelength, consistent with a resonant process (5).
Other applications of imaging SHG from these dyes are now emerging. In this letter, we report on large changes in both SHG and 2PF observed during the wave of exocytosis after fertilization of an egg from the sea urchin, Lytechinus pictus. Before fertilization, large numbers of cortical granules are stationed immediately inside the membrane (6); a calcium wave, initiated by the sperm and propagated across the egg, triggers their exocytosis (7). Capacitance measurements show that exocytosis takes from 30 to 50 s, during which the surface area slightly more than doubles (8). Most of the additional membrane is thought to become part of the numerous elongated microvilli of the egg's surface (9).
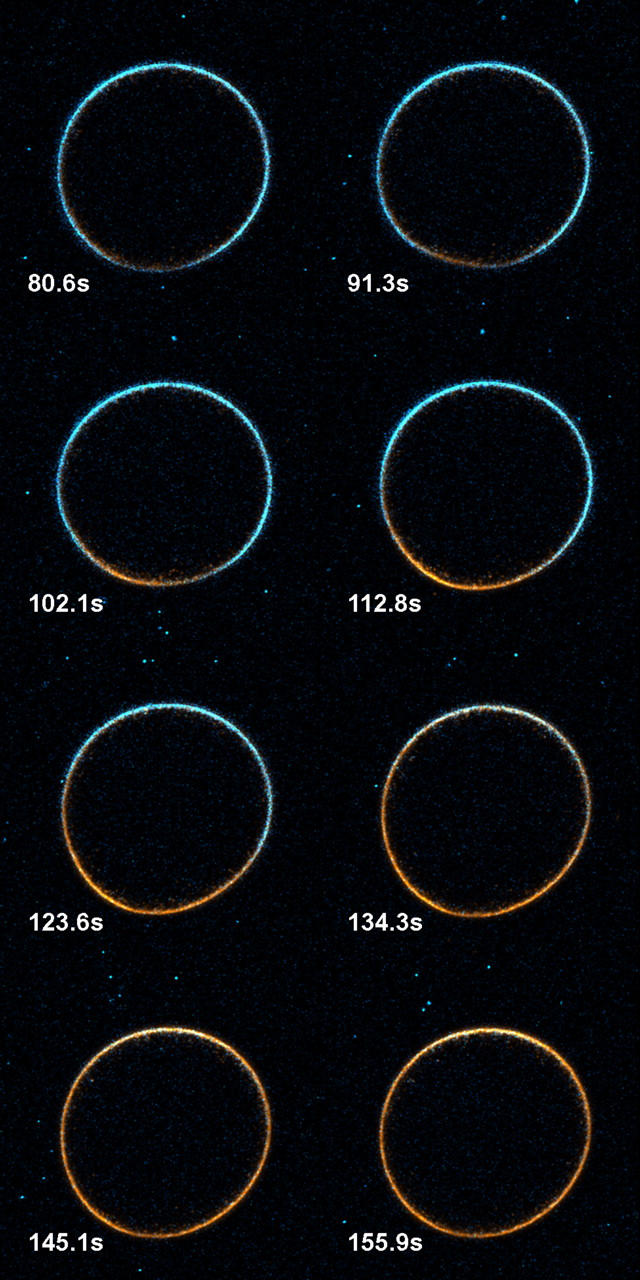
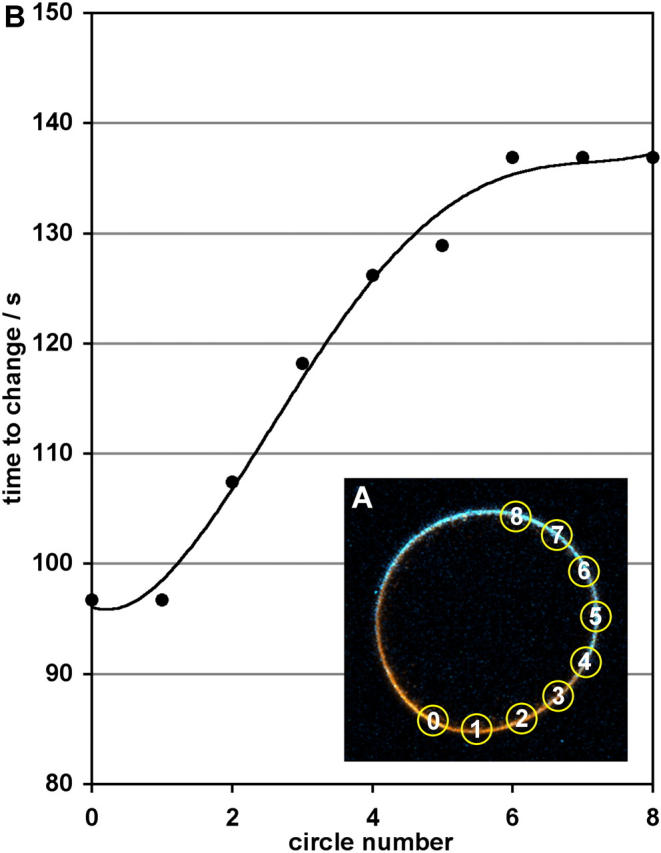
Fig. 1 shows a typical set of SHG and 2PF images using an excitation wavelength of 910 nm, with fluorescence detected below 750 nm. In this case, the wave initiates from between 6 and 7 o'clock, presumably the point of fertilization, and then propagates in both directions around the egg. (Movies showing this and other image series are available in the online Supplementary Material.) Fig. 2 shows that the wave front, i.e., the point of signal change, takes ∼40 s to propagate around the egg. Numerical data extracted from nine regions of interest in the images show that the average SHG change is (−38.7 ± 4.2)%, whereas the average 2PF change is (68.3 ± 11.4)%.
FIGURE 1.

This montage of overlaid SHG (blue) and 2PF (orange) images shows the propagation of signal changes associated with exocytosis. Every fourth image from the original series is shown, with each image recorded at the indicated time after the start of imaging. A movie of the full time course is available in the online Supplementary Material.
FIGURE 2.

(A) Inset image shows nine circles selected as regions of interest for extracting signals as a function of time. (B) The plot shows the time at which the signals begin to change for each circle.
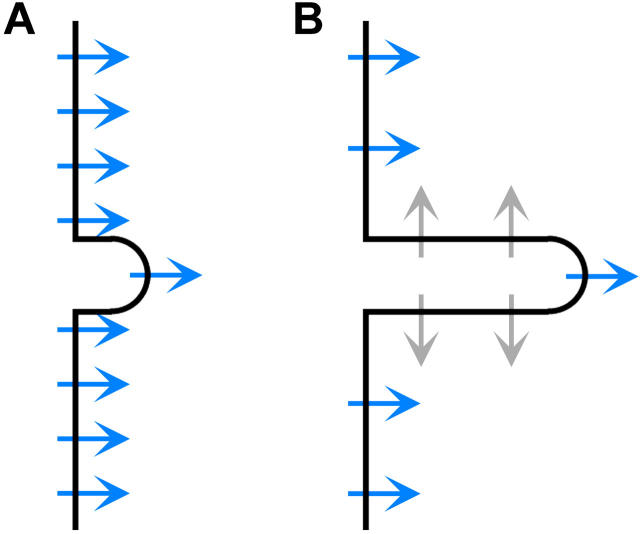
Possible mechanisms for these signal changes are implied by the physiological changes occurring during exocytosis. Unlike fluorescence, SHG requires an asymmetric array of harmonophores, a constraint that is readily satisfied by membranes with only one leaflet stained by dye. Fig. 3 shows that elongation of the microvilli would result in more dye molecules being oriented opposite to one another, reducing SHG by symmetry. Also, if the dye is initially present in sufficient concentration that 2PF is self-quenched, then the increased separation of the dye molecules reduces self-quenching (10), increasing the 2PF signal. Finally, since the dyes are sensitive to local electric fields (11), differences in lipid composition between the vesicles and the cellular membrane would affect both SHG and 2PF, either as the dye diffuses into the vesicle remnants or as the lipids in the vesicles and in the cellular membranes mix with one another.
FIGURE 3.
(A) Before fusion, most dye molecules (arrows) in the membrane are aligned and produce SHG (blue). The microvilli are short, being ∼0.2 μm in length and a little less in diameter. (B) After fusion, the microvilli are elongated to ∼0.7 μm and more dye molecules are oppositely aligned, reducing SHG by symmetry (gray).
Although the details of the mechanisms of signal change have yet to be firmly established, these observations further demonstrate the potential of optical methods such as SHG and 2PF microscopy for the study of physiological changes as alternatives to more invasive methods such as patch-clamping.
METHODS
We obtained eggs and sperm from L. pictus individuals by injecting them with 0.5 mM KCl solution. Eggs were collected and stored in artificial sea water (ASW), while sperm were collected without dilution and held on ice. For imaging, eggs were prestained with di-8-ANEPPS by adding them to a 6 μM solution of the dye, complexed with carboxyethyl-γ-cyclodextrin, in ASW. After 10 min, the liquid above the stained eggs was removed and replaced with fresh ASW. Prestaining in this way resulted in a uniform staining level of the eggs that, in the absence of fertilization, was constant over time. To image and fertilize the eggs, a coverslip was affixed to a microscope slide using double-sided adhesive tape, such that eggs were held in place under the edge of the coverslip. Sperm were placed at the side of the coverslip, sufficiently close that their swimming took some of them to the eggs. The eggs were imaged continuously with the nonlinear microscope used in our earlier work (5), recording one frame every ∼2.7 s.
SUPPLEMENTARY MATERIAL
An online supplement to this article can be found by visiting BJ Online at http://www.biophysj.org.
Supplementary Material
Acknowledgments
The authors thank David Boudreau, Paul Campagnola, Heather Clark, Laurinda Jaffe, Lei Jin, and Mei-de Wei for their suggestions and feedback.
This study was supported by the National Institutes of Health via grant No. EB001963.
References
- (1).Campagnola, P. J., A. C. Millard, M. Terasaki, P. E. Hoppe, C. J. Malone, and W. A. Mohler. 2002. Three-dimensional high resolution second harmonic generation imaging of endogenous structural proteins in biological tissues. Biophys. J. 82:493–508. [DOI] [PMC free article] [PubMed] [Google Scholar]
- (2).Brown Jr., R. M., A. C. Millard, and P. J. Campagnola. 2003. Macromolecular structure of cellulose studied by second harmonic generation imaging microscopy. Opt. Lett. 28:2207–2209. [DOI] [PubMed] [Google Scholar]
- (3).Campagnola, P. J., M.-D. Wei, A. Lewis, and L. M. Loew. 1999. High resolution non-linear optical microscopy of living cells by second harmonic generation. Biophys. J. 77:3341–3349. [DOI] [PMC free article] [PubMed] [Google Scholar]
- (4).Fluhler, E., V. G. Burnham, and L. M. Loew. 1985. Spectra, membrane binding and potentiometric responses of new charge-shift probes. Biochemistry. 24:5749–5755. [DOI] [PubMed] [Google Scholar]
- (5).Millard, A. C., L. Jin, M.-D. Wei, J. P. Wuskell, A. Lewis, and L. M. Loew. 2004. Sensitivity of second harmonic generation from styryl dyes to transmembrane potential. Biophys. J. 86:1169–1176. [DOI] [PMC free article] [PubMed] [Google Scholar]
- (6).Berg, L. K., and G. M. Wessel. 1997. Cortical granules of the sea urchin translocate early in oocyte maturation. Development. 124:1845–1850. [DOI] [PubMed] [Google Scholar]
- (7).Terasaki, M. 1995. Visualization of exocytosis during sea urchin egg fertilization using confocal microscopy. J. Cell Sci. 108:2293–2300. [DOI] [PubMed] [Google Scholar]
- (8).Jaffe, L. A., S. Hagiwara, and R. T. Kado. 1978. The time course of cortical vesicle fusion in sea urchin eggs observed as membrane capacitance changes. Dev. Biol. 67:243–248. [DOI] [PubMed] [Google Scholar]
- (9).Chandler, D. E., and J. Heuser. 1981. Post-fertilization growth of microvilli in the sea urchin egg. Dev. Biol. 82:393–400. [DOI] [PubMed] [Google Scholar]
- (10).MacDonald, R. I. 1990. Characteristics of self-quenching of the fluorescence of lipid-conjugated rhodamine in membranes. J. Biol. Chem. 265:13533–13539. [PubMed] [Google Scholar]
- (11).Gross, E., R. S. Bedlack, and L. M. Loew. 1994. Dual-wavelength ratiometric fluorescence measurement of the membrane dipole potential. Biophys. J. 67:208–216. [DOI] [PMC free article] [PubMed] [Google Scholar]
Associated Data
This section collects any data citations, data availability statements, or supplementary materials included in this article.


