Abstract
The nucleus accumbens is a brain region in which limbic and motor inputs converge. How these information modalities shape accumbens output is not clearly understood. Here, we report that synaptic inputs from the prefrontal cortex and limbic structures interact differently depending on their timing. Coincident inputs may result in enhancing information flow through the nucleus accumbens. Responses to asynchronous inputs are affected by their relative order of arrival, with limbic inputs allowing subsequent prefrontal responses, and prefrontal inputs dampening limbic responses. These mechanisms allow for both coincidence detection and input selection in this integrative brain region.
The nucleus accumbens (NAcc) has been described as the brain limbic–motor interface (1). Anatomical studies show that the NAcc receives synaptic inputs from the prefrontal cortex (PFC) and limbic structures, including the hippocampus (HPC) and basolateral amygdala (BLA) (2). With this arrangement, emotional and contextual cues could be integrated with frontal motor planning and determine response selection (3). Although these afferents converge in single accumbens neurons (4–6), the effects of their combined activation on NAcc neuronal output remain unclear. In this study, synaptic responses in NAcc neurons evoked by simultaneous and asynchronous PFC and limbic activation was evaluated to determine how this information is integrated in this brain region.
Methods
Recordings.
In vivo intracellular recordings were performed from 37 adult male Sprague–Dawley rats (265–440 g). All experimental procedures were performed according to the U.S. Public Health Service Guide for the Care and Use of Laboratory Animals and approved by the Albany Medical College Institutional Animal Care and Use Committee. Detailed methods for the recordings have been described (7). In brief, rats were anesthetized with chloral hydrate (400 mg/kg) and placed on a stereotaxic apparatus. Intracellular electrodes were made from glass micropipettes (37–98 MΩ) filled with 3 M potassium acetate and 2% Neurobiotin, and lowered into the lateral shell or medial core regions of the NAcc [anteroposterior (AP), +1.2 to +1.8 mm from bregma; lateral, 1.0–1.6 mm from midline; vertical, −5.8 to −8.0 mm from brain surface]. The results from shell or medial core neurons were similar, and therefore were pooled. Only cells showing at least −50 mV of resting membrane potential and overshooting action potentials were included in the analysis. Stimulation electrodes (concentric bipolar electrodes with 0.5 mm between tips) were placed in either the ventral subiculum/CA1 (AP, −5.8 mm; lateral, +4.2 mm; vertical, −8.3 mm), prelimbic cortex (AP, +3.5 mm; lateral, 0.5 mm; vertical, −4.0 mm), posterior BLA (AP, −2.8 mm; lateral, 4.8 mm; vertical, −8.6 mm), or paraventricular nucleus of thalamus (PV) (AP, −2.6 mm; lateral, 0.1 mm; vertical, −5.2 mm). Current pulses (0.5 ms; 0.2–1.5 mA) were delivered every 10 s at least ten times. After completion of recording, Neurobiotin was injected to identify recorded neurons, and stimulation sites were marked by passing current to electrodes. The animals were deeply anesthetized by a lethal dose of chloral hydrate and killed at the end of experiments. Brains were removed from the skull and further processed for histological analysis. All coordinates of recording and stimulation were based on the rat brain atlas by Paxinos and Watson (8).
Data Analysis.
Excitatory postsynaptic potential (EPSP) amplitude was defined as
 |
where Vp is the first membrane potential peak observed after stimulation, to exclude polysynaptic components. Vmp is the membrane potential 1 ms before stimulation onset. Expected combined EPSP amplitude (ΔVlinear) was calculated by post hoc algebraic summation of randomly shuffled individual EPSPs evoked by repetitive n time stimulation of two brain regions. Thus,
 |
where ΔV is EPSPs evoked by ith PFC stimulation, and ΔV
 is EPSPs evoked by jth stimulation of either HPC, BLA, or PV.
Coefficient of variation (Cv) was calculated by
 |
where σ and μ are standard deviation and mean of EPSP amplitude evoked with repeated stimulation. For ΔVlinear, standard deviation and mean were obtained by algebraic summation of randomly shuffled EPSPs evoked by repetitive stimulation of two brain regions.
Results
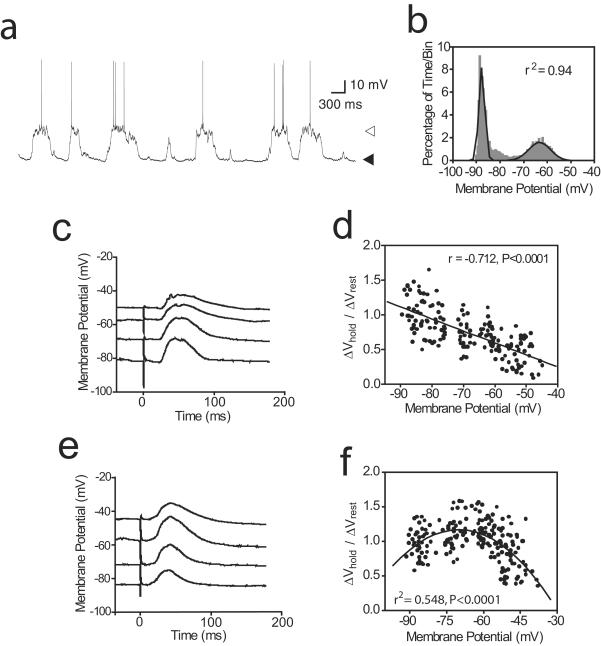
In vivo intracellular recordings were obtained from 67 neurons in the NAcc of anesthetized rats. As reported (4, 7), most NAcc neurons (n = 51/67; 76%) exhibited membrane potential fluctuations between a negative resting membrane potential (DOWN state, −78.5 ± 7.6 mV; mean ± SD) and plateau depolarizations (UP state, −67.4 ± 8.81 mV; Fig. 1a). Transitions to the UP state, defined as membrane potential crossing the midpoint between modes (Fig. 1b) and staying UP for at least 100 ms, occurred at 0.66 ± 0.27 Hz. Afferent stimulation was performed only in neurons showing such membrane potential activity. Stimulation of the PFC (prelimbic area), HPC (ventral subiculum/CA1), posterior BLA, and PV, which projects to the NAcc (9), evoked EPSPs in most neurons (Fig. 1 c and e). PFC stimulation evoked EPSPs in 91% of cells recorded (n = 40/44); HPC stimulation evoked EPSPs in 69% (n = 11/16); BLA stimulation evoked EPSPs in 80% (n = 12/15); PV stimulation evoked EPSPs in 54% (n = 7/13). Stimulation intensity was adjusted in all cases to evoke the largest subthreshold responses without spike firing.
Figure 1.
Membrane potential dependence of EPSPs evoked by PFC and limbic inputs. (a) Spontaneous membrane potential fluctuations in a representative NAcc neuron. Black and white arrows indicate resting DOWN (−88 mV) and UP (−62 mV) states, respectively. (b) Membrane potential distribution histogram fitted to a dual Gaussian function (black line; r2 = 0.94) obtained from the trace shown in a. (c) Averaged BLA-evoked EPSPs at different membrane potentials. (d) Scatter plot of BLA- and HPC-evoked EPSP amplitude in relation to membrane potential. Ratio was estimated from the amplitude of EPSPs evoked at different membrane potentials adjusted by intracellular current injection to cover a few steps in the −80 to −50 mV range (ΔVhold) divided by the average EPSP amplitude at resting membrane potential (ΔVrest). The solid line indicates the linear regression for all data points. (e) Average traces of PFC-evoked EPSPs at different membrane potentials in the same neurons shown in c. (f) Scatter plot of PFC-evoked EPSP amplitude in relation to membrane potential. Second-order polynomial regressions best fitted the plots, which display an inverted U shape. The solid line is the second-order polynomial regression for all data points.
PFC- and limbic-evoked EPSPs varied with membrane potential of the recorded neuron. When HPC (n = 2) or BLA (n = 3) were stimulated at successively depolarized membrane potentials set by intracellular current injection, EPSP amplitude was linearly reduced (Fig. 1 c and d). On the other hand, PFC-evoked EPSP amplitude varied nonlinearly with membrane depolarization (n = 5). PFC-evoked EPSPs became larger when the membrane potential was slightly depolarized (Fig. 1 e and f), with maximal amplitude at membrane potentials close to the UP state (i.e., −65 mV). With further depolarization, EPSPs became rapidly smaller. These results suggest that limbic-evoked EPSPs are most effective at resting (DOWN) membrane potentials, whereas PFC-evoked EPSPs are most effective at more depolarized (UP) membrane potentials
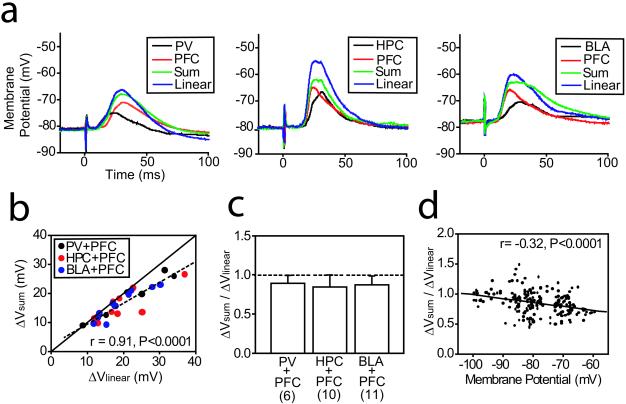
To examine the summation of EPSPs from these regions, stimulation was repeated with simultaneous activation of pairs of inputs: HPC+PFC (n = 10), BLA+PFC (n = 11), or PV+PFC (n = 6). The ratio between amplitudes of EPSPs evoked by simultaneous stimulation of two regions (ΔVsum) and post hoc algebraic summation of responses to each afferent (ΔVlinear) was calculated to determine whether simultaneous afferent activation resulted in evoked responses different from the simple addition of individual EPSPs. EPSPs evoked by simultaneous afferent activation were smaller than what was expected by algebraic summation. This finding was evidenced by the slope of linear regression (0.698; correlation coefficient r = 0.91) being statistically smaller than 1.0 (t test; t = −4.96, P < 0.001; Fig. 2 a–c). ΔVsum/ΔVlinear further departed from unity at depolarized values (Fig. 2d), suggesting that membrane potential is a factor affecting synaptic integration. This finding is surprising, given the inward rectification NAcc neurons show with membrane depolarization (10). Thus, the nonlinearity cannot be explained by input resistance changes. It is conceivable that availability of voltage-gated channels, evoked-EPSP reversal potentials, or some overlap in the afferent fibers producing an occlusion phenomenon may affect EPSP summation in NAcc neurons. Independently of the mechanism, the result is a certain degree of sublinearity in PFC-limbic input summation.
Figure 2.
Sublinear summation of EPSPs in NAcc neurons. (a) Evoked EPSPs are shown from three representative experiments, from left to right, for PV+PFC (n = 6), HPC+PFC (n = 10), and BLA+PFC stimulation (n = 11). The traces are averages of at least ten repetitions. “Linear” is the expected linear summation of EPSP calculated by post hoc algebraic summation of responses to each afferent stimulation. “Sum” is the actual EPSP evoked by combined activation. Different degrees of sublinear EPSP summation are illustrated in the traces: (Left) Summation is almost linear; (Center) the HPC+PFC EPSP summation shown is heavily sublinear; (Right) the BLA+PFC EPSP summation shown is moderately sublinear. (b) Scatter plot comparing observed (ΔVsum) and expected (ΔVlinear) combined EPSP amplitudes. The dashed line indicates the linear regression of the data observed, which deviates from unity (solid line) with larger responses. (c) Bar graph showing average ΔVsum/ΔVlinear ratios for all stimuli combinations tested. The dashed line indicates ΔVsum = ΔVlinear. (d) Scatter plot showing ΔVsum/ΔVlinear ratios at different membrane potentials. The solid line indicates the linear regression.
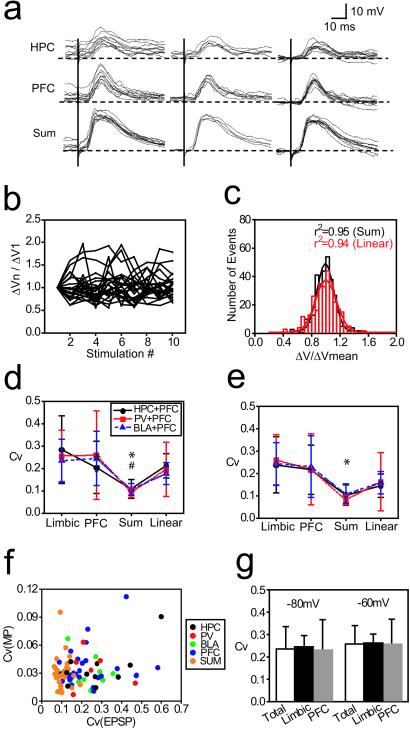
EPSPs evoked in NAcc neurons in vivo were very variable in amplitude (Fig. 3 a and b). Such trial-to-trial variability was quantified by Cv, which was significantly lower in EPSPs evoked by paired stimulation compared with post hoc summation of EPSPs evoked by separate stimulation of each region (Fig. 3d; one-way ANOVA; F(3, 36) = 5.11, P < 0.005 in HPC+PFC stimulation, n = 10; F(3, 20) = 7.48, P < 0.005 in PV+PFC stimulation, n = 6; F(3, 40) = 6.64, P < 0.001 in BLA+PFC stimulation, n = 11). Because EPSPs were evoked at different membrane potentials and their amplitude was voltage-dependent, Cv was also calculated for EPSPs evoked only during the DOWN state. Simultaneous stimulation still yielded lower Cv values than those of the linear summation expected for HPC+PFC and BLA+PFC, but not for PV+PFC (Fig. 3e; one-way ANOVA; F(3, 36) = 4.42, P < 0.01 in HPC+PFC stimulation, n = 10; F(3, 20) = 2.74, P = 0.07 in PV+PFC stimulation, n = 6; F(3, 80) = 4.33, P < 0.01 in BLA-PFC stimulation, n = 11). The absence of membrane potential dependence for trial-to-trial EPSP amplitude variability was further determined by the lack of correlation between prestimulus membrane potential Cv and EPSP amplitude Cv (Fig. 3f) and by the absence of statistical difference in Cv for EPSPs evoked at rest (−80 mV) and at −60 mV (Fig. 3g; paired t test for all: t = 0.91, P = 0.39; limbic: t = 1.16, P = 0.31; PFC: t = 0.53, P = 0.62). The reduced variability in the summated response could be caused by a ceiling effect in the depolarization. This ceiling effect is unlikely, however, because amplitudes of paired stimulation-evoked and algebraic summated EPSPs had Gaussian distributions (Fig. 3c; paired, r2 = 0.95; linear, r2 = 0.94). These results suggest that reduction of EPSP amplitude variability when inputs are simultaneous may be an effective way to integrate information from the PFC and limbic regions within the NAcc.
Figure 3.
Variability of EPSP amplitude is reduced by simultaneous PFC and limbic activation. (a) Overlay of representative responses evoked by HPC (Top), PFC (Middle), and combined (Bottom) stimulation showing EPSPs evoked at both UP and DOWN states (Left), EPSPs evoked only during the DOWN state (less than 5 mV from the most hyperpolarized membrane potential; Center), and EPSPs aligned at the membrane potential just before stimulation (Right). (b) Examples of amplitude variability. Amplitudes of successive EPSPs are normalized to the first EPSP amplitude. (c) Histogram showing Gaussian distribution of paired stimulation-evoked and linear summated EPSP amplitudes. EPSP amplitudes were normalized across recorded cells. (d) Coefficient of variation (Cv) calculated for all responses. *, P < 0.005 for HPC+PFC and PV+PFC; #, P < 0.001 for BLA+PFC. (e) Cv calculated for responses obtained during the DOWN state. *, P < 0.05 for HPC+PFC and BLA+PFC. (f) Scatter plot showing absence of correlation between membrane potential Cv and EPSP amplitude Cv. (g) Bar graph showing that variability of EPSP amplitude is not dependent on membrane potential. Cv was calculated for PFC and limbic EPSP evoked at membrane potentials held close to −80 mV and −60 mV. Samples used for this analysis were shown in Fig. 1 c–f. “Total” indicates combination of limbic and PFC responses.
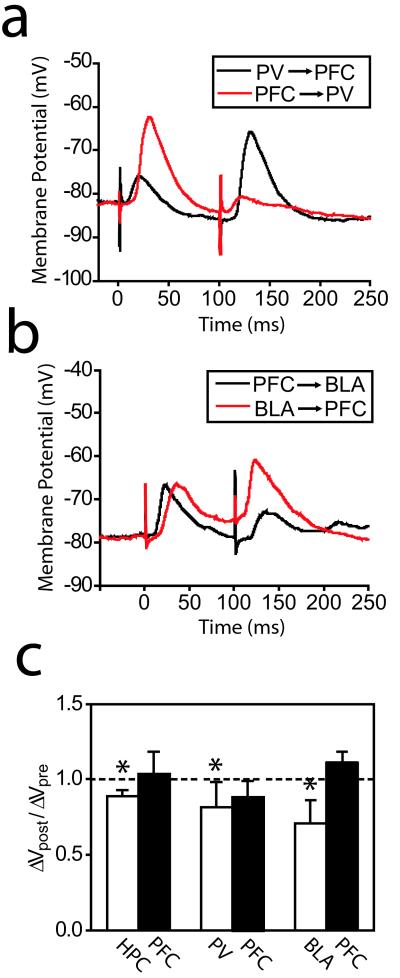
Asynchronous arrival of PFC and limbic inputs may also shape information processing in the NAcc. As reported in the dorsal striatum (11), most EPSPs evoked by PFC and PV stimulation were followed by long-duration (several hundred milliseconds) hyperpolarizations. Responses to HPC or BLA, on the other hand, exhibited prolonged depolarizations. We tested whether such long-duration membrane potential changes affected synaptic integration by adding 100-ms intervals between stimuli (Fig. 4). EPSPs evoked by PV, HPC, and BLA were significantly reduced in amplitude when they were evoked 100 ms after PFC stimulation [Fig. 4 a–c; paired t test, P < 0.05 in HPC (7.3 ± 1.3 to 6.5 ± 1.2 mV, n = 6), PV (8.0 ± 4.6 to 6.6 ± 4.8 mV, n = 4), and BLA (9.7 ± 3.5 to 6.9 ± 3.2 mV, n = 8)]. When the order of stimulation was reversed, PFC-evoked EPSPs were not reduced by the preceding response to HPC (9.0 ± 4.2 to 9.2 ± 3.9 mV, n = 6), BLA (11.6 ± 2.6 to 12.7 ± 2.7 mV, n = 8), or PV (13.7 ± 9.6 to 12.7 ± 10.6 mV, n = 4; Fig. 4 b and c). In some cases, EPSPs evoked by PFC stimulation were coincident with BLA- or HPC-evoked prolonged depolarizations, which caused PFC-evoked EPSPs to reach more depolarized values (Fig. 4b). It has been shown that membrane depolarization in striatal medium spiny neurons can alter subsequent synaptic responses (12). However, the fact that the interactions studied here were asymmetrical rules out any role of simple membrane depolarization on this phenomenon. These results suggest that asynchronous synaptic inputs from PFC and limbic structures have different interactions depending on the order of their arrival. If limbic inputs follow PFC activation, they are dampened. Conversely, limbic afferents maintain the gate for subsequent inputs.
Figure 4.
EPSP integration in NAcc neurons by asynchronous stimulation of PFC and limbic afferents. (a) Traces obtained with PFC and PV stimulation at 100 ms intervals in different orders. (b) Traces obtained with PFC and BLA stimulation at 100-ms intervals in different orders. (c) Bar graph showing the ratios between EPSPs evoked following the other afferent stimulation (ΔVpost) and EPSPs evoked before stimulating the other structure (ΔVpre). *, P < 0.05, paired t test.
Discussion
The present study shows that coincident PFC and limbic inputs reduce EPSP amplitude variability, suggesting that correlated activity between the PFC and limbic structures results in stable electrical activity in the NAcc. On the other hand, asynchronous inputs affect each other differently, depending on the order of arrival; limbic inputs may enhance subsequent PFC inputs, and PFC inputs dampen subsequent limbic-evoked EPSPs.
EPSP amplitudes were affected by membrane potential states. This voltage dependence was different for limbic and PFC afferents. Limbic inputs exhibited a linear decrease in EPSP amplitude at more depolarized membrane potentials. PFC inputs, on the other hand, had a nonlinear membrane potential dependence, with largest EPSPs at about −60 mV. Nonlinearity in EPSP amplitude has also been reported in dorsal striatal medium spiny neurons, both in vivo (13) and in vitro (14). Thus, PFC inputs are most effective (effectiveness defined as larger EPSP amplitudes) in the NAcc at depolarized membrane potentials (UP state), whereas limbic inputs are effective primarily during the DOWN state. It is possible that this difference is due to afferents targeting regions within medium spiny neurons with different ion channel or glutamate receptor composition, or to different connectivity patterns for each afferent system, including differences in feed-forward inhibition (15). The enhanced response to PFC activation in the UP state could involve N-methyl-D-aspartate receptors, which exhibit similar voltage dependence. This difference between PFC and limbic inputs may have several functional consequences. Because PFC inputs are effective near the UP state and spike firing occurs during this period, PFC inputs may determine spike firing in NAcc neurons, which is consistent with reports in which spike firing of NAcc neurons was correlated with cortical activity (16). Activation of HPC inputs can elicit a transition from the DOWN to the UP state (4), thereby bringing NAcc neurons into the range of maximal response to PFC inputs. Thus, near-coincident PFC and limbic activation may be required for action potential firing in NAcc neurons.
The interaction between asynchronous PFC and limbic inputs depends on their timing. We have previously shown that HPC inputs can gate PFC responses in the NAcc (4). Thus, a strong barrage of limbic inputs would depolarize NAcc neurons, bringing them to the membrane potential range in which PFC-evoked EPSPs will have maximal amplitude, increasing the probability of spike firing. This finding may reflect some extent of active dendritic integration in the NAcc; limbic-evoked UP states may involve persistent activation of ionic currents that facilitate both simultaneous and subsequent PFC inputs. On the other hand, PFC stimulation reduced the amplitude of subsequent limbic EPSPs. This reduction occurs at an interval at which PFC stimulation has been shown to evoke prolonged hyperpolarization in both the dorsal striatum (11) and NAcc (4) after EPSPs. It is possible that, after PFC activation, a γ-aminobutyric acid-mediated current shunts limbic-evoked EPSPs. Limbic EPSPs are linearly related to membrane potential; therefore, larger limbic EPSPs should be expected if they were evoked during a PFC stimulation-induced prolonged hyperpolarization. In vitro slice recordings in NAcc neurons have shown that slow γ-aminobutyric acid-mediated responses follow glutamatergic excitatory components (17). Thus, feed-forward inhibition by interneurons (15) or axon collaterals of projection neurons (18) may mediate this cortical-induced attenuation of limbic inputs.
The effectiveness of coincident PFC-limbic activation is enhanced by the increased response reproducibility (or decreased variability) of the combined synaptic responses. Information processing in the NAcc has been proposed to rely on ensembles of neurons in their UP states (19). Because UP states depend at least on HPC inputs, the increased consistency of evoked responses when inputs are synchronous may result in a more stable ensemble formation. The PFC and limbic structures are reciprocally connected (20), and synchronous activity has been observed in rats with simultaneous recordings from the PFC and HPC (21). It has indeed been suggested that correlated limbic-cortical activity is important for cognitive functions (22, 23), and their coincidence in the NAcc may be a means for the selection of appropriate behavioral responses. In addition, this coincidence detection mechanism may have an effective time window after the arrival of limbic inputs. In this way, hippocampal and amygdaloid activity can gate prefrontal cortical inputs and the summation of both will determine the outcome of this system. Conversely, once PFC inputs arrive, the gate may close allowing for a reset of the system. It is worth noting that the PFC is essential for switching strategies (24). Although speculative, hypofrontality may result in insufficient “reset” of NAcc information integration, yielding the perseverative responses typical of this condition (25). In conclusion, we presented evidence for two simultaneous mechanisms by which input (and response) selection can take place in the NAcc, depending on the state of the neurons and the timing of inputs. In this way, attention, contextual, emotional, or motivational factors may affect responses to stimuli in this region with an important role in cognitive functions (26, 27).
Acknowledgments
We thank Ms. B. Lewis for her excellent technical assistance and Mr. B. Lowry for providing software for data acquisition. This work was supported by National Institutes of Health Grants MH60131 and DA14020, and a National Alliance for Research on Schizophrenia and Depression Independent Investigator Award (to P.O.). P.O. is a Wodecroft Investigator.
Abbreviations
- NAcc
nucleus accumbens
- PFC
prefrontal cortex
- BLA
basolateral amygdala
- PV
paraventricular nucleus of thalamus
- EPSP
excitatory postsynaptic potential
- Cv
coefficient of variation
Footnotes
This paper was submitted directly (Track II) to the PNAS office.
References
- 1.Mogenson G J, Jones D L, Yim C Y. Prog Neurobiol. 1980;14:69–97. doi: 10.1016/0301-0082(80)90018-0. [DOI] [PubMed] [Google Scholar]
- 2.Groenewegen H J, Wright C I, Beijer A V, Voorn P. Ann NY Acad Sci. 1999;877:49–63. doi: 10.1111/j.1749-6632.1999.tb09260.x. [DOI] [PubMed] [Google Scholar]
- 3.Grace A A. Brain Res Rev. 2000;31:330–341. doi: 10.1016/s0165-0173(99)00049-1. [DOI] [PubMed] [Google Scholar]
- 4.O'Donnell P, Grace A A. J Neurosci. 1995;15:3622–3639. doi: 10.1523/JNEUROSCI.15-05-03622.1995. [DOI] [PMC free article] [PubMed] [Google Scholar]
- 5.Finch D M. Hippocampus. 1996;6:495–512. doi: 10.1002/(SICI)1098-1063(1996)6:5<495::AID-HIPO3>3.0.CO;2-I. [DOI] [PubMed] [Google Scholar]
- 6.French S J, Totterdell S. J Comp Neurol. 2002;446:151–165. doi: 10.1002/cne.10191. [DOI] [PubMed] [Google Scholar]
- 7.Goto Y, O'Donnell P. J Neurosci. 2001;21:1–5. [Google Scholar]
- 8.Paxinos G, Watson C. The Rat Brain in Stereotaxic Coordinates. San Diego: Academic; 1998. [DOI] [PubMed] [Google Scholar]
- 9.Berendse H W, Groenewegen H J. J Comp Neurol. 1990;299:187–228. doi: 10.1002/cne.902990206. [DOI] [PubMed] [Google Scholar]
- 10.O'Donnell P, Grace A A. Synapse. 1993;13:135–160. doi: 10.1002/syn.890130206. [DOI] [PubMed] [Google Scholar]
- 11.Wilson C J, Chang H T, Kitai S T. Exp Brain Res. 1983;51:227–235. doi: 10.1007/BF00237198. [DOI] [PubMed] [Google Scholar]
- 12.Mahon S, Delord B, Deniau J M, Charpier S. J Physiol. 2000;527:345–354. doi: 10.1111/j.1469-7793.2000.t01-1-00345.x. [DOI] [PMC free article] [PubMed] [Google Scholar]
- 13.Calabresi P, Mercuri N B, Stefani A, Bernardi G. J Neurophysiol. 1990;63:651–662. doi: 10.1152/jn.1990.63.4.651. [DOI] [PubMed] [Google Scholar]
- 14.Kawaguchi Y, Wilson C J, Emson P C. J Neurophysiol. 1989;62:1052–1068. doi: 10.1152/jn.1989.62.5.1052. [DOI] [PubMed] [Google Scholar]
- 15.Pennartz C M A, Kitai S T. J Neurosci. 1991;11:2838–2847. doi: 10.1523/JNEUROSCI.11-09-02838.1991. [DOI] [PMC free article] [PubMed] [Google Scholar]
- 16.Callaway C W, Henriksen S J. Neuroscience. 1992;51:547–553. doi: 10.1016/0306-4522(92)90294-c. [DOI] [PubMed] [Google Scholar]
- 17.Chang H T, Kitai S T. Brain Res. 1986;366:392–396. doi: 10.1016/0006-8993(86)91326-0. [DOI] [PubMed] [Google Scholar]
- 18.Lighthall J W, Kitai S T. Brain Res Bull. 1983;11:103–110. doi: 10.1016/0361-9230(83)90058-8. [DOI] [PubMed] [Google Scholar]
- 19.O'Donnell P. Psychobiology. 1999;27:187–197. [Google Scholar]
- 20.Fuster J M. The Prefrontal Cortex: Anatomy, Physiology, and Neuropsychology of the Frontal Lobe. Philadelphia: Lippincott-Raven; 1997. [Google Scholar]
- 21.Siapas A G, Wilson M A. Neuron. 1998;21:1123–1128. doi: 10.1016/s0896-6273(00)80629-7. [DOI] [PubMed] [Google Scholar]
- 22.Buzsaki G. Cereb Cortex. 1996;6:81–92. doi: 10.1093/cercor/6.2.81. [DOI] [PubMed] [Google Scholar]
- 23.Eichenbaum H. Nat Rev Neurosci. 2000;1:41–50. doi: 10.1038/35036213. [DOI] [PubMed] [Google Scholar]
- 24.Miller E K. Nat Rev Neurosci. 2000;1:59–65. doi: 10.1038/35036228. [DOI] [PubMed] [Google Scholar]
- 25.Milner B. Arch Neurol. 1963;9:90–100. [Google Scholar]
- 26.Kalivas P W, Nakamura M. Curr Opin Neurobiol. 1999;9:223–227. doi: 10.1016/s0959-4388(99)80031-2. [DOI] [PubMed] [Google Scholar]
- 27.Robbins T W, Everitt B J. Curr Opin Neurobiol. 1996;6:228–236. doi: 10.1016/s0959-4388(96)80077-8. [DOI] [PubMed] [Google Scholar]


