

Abstract
The Na+-pumping V-ATPase complex of the thermophilic bacterium Caloramator fervidus was purified and dissociated under controlled conditions. The structure of purified V1-ATPase subcomplexes differing in subunit composition was analyzed by electron microscopy and single particle analysis of 50 000 projections. Difference mapping of subcomplex projections revealed the presence and position of two subunits in the central stalk. A density with an elongated shape similar to the γ subunit of F-ATPases is partly located within V1 and corresponds, most likely, to subunit E. Subunit E is connected to the membrane-bound part V0 via subunit C, a spherical density that is connected to the center of V0. The presence of subunit C makes the central stalk substantially longer in comparison to the F-ATPases, in which the γ subunit connects directly to F0.
Introduction
V-ATPases are membrane-bound rotary motor proteins. They function as proton- or sodium-pumps to build up ion gradients at the expense of ATP and are widely distributed in different types of eukaryotic cells and some eubacteria. The overall structure of the V-ATPases (Boekema et al., 1999; Wilkens et al., 1999; Domgall et al., 2002) is similar to that of the well-characterized F-ATPases (Stock et al., 1999). Both consist of an extramembranous catalytic domain, called the headpiece V1 or F1, that is linked by means of a stalk region to a membrane-bound ion-translocating domain called V0 or F0. Because of the structural similarity, it is believed that the energy coupling mechanism between ATP hydrolysis and ion translocation in V-ATPases is similar to that in F-ATPases (Stock et al., 1999). Conformational changes in the headpiece during ATP hydrolysis trigger rotation of the main component of the stalk region, the central stalk, with respect to the A and B subunits of V1. Rotation of the central stalk would lead to rotation of the rotor part in V0 against the static part of V0, resulting in the pumping of protons or sodium ions over the membrane. Rotation of the headpiece relative to the static part of V0 is prevented by additional stalks that connect the V1 and V0 part in the periphery of the complex.
In spite of the overall structural similarity of V-ATPases and F-ATPases, significant differences are observed especially in the stalk region. Most prominently, the stator structure that prevents idle rotation of F1 relative to F0 consists of a single peripheral stalk formed by the b subunit, while electron microscopy images of V-ATPases reveal a more complex stator structure involving two or three peripheral stalks that seem to contact the central stalk (Boekema et al., 1999; Domgall et al., 2002). Furthermore, the length of the central stalk is considerably longer in V-ATPases than in F-ATPases. The differences in the stalk regions of V-ATPases and F-ATPases are also reflected in the subunit composition of the complexes. While the homology between the subunits that make up the headpiece and the membrane bound parts is evident from the available amino acid sequences, no such relation is apparent for the other subunits. Moreover, while the stalk region of the bacterial F-ATPase consists of only three subunits, γ, ε and b, up to eight subunits have been considered to be part of the stalk region in V-ATPases (Forgac, 2000), none of which has been convincingly positioned in the structure of the complexes.
The Na+-pumping V-ATPase of the anaerobic thermophile Caloramator fervidus is one of a few described bacterial V-ATPases (Höner zu Bentrup et al., 1997). In a previous study, we demonstrated temperature-driven disassembly of the complex resulting in V1 complexes containing different numbers of subunits (Ubbink-Kok et al., 2000). Here we present the purification of these subcomplexes and their analysis by electron microscopy. It follows that the central stalk of the V-ATPase of C. fervidus consists of two different subunits.
Results
Isolation and characterization of partial V1-ATPase complexes
The V-ATPase complex of C. fervidus consists of nine subunits (Figure 1, lanes 1): the V1 subunits A, B, C, D, E, F and G, and the V0 subunits I and K (Ubbink-Kok et al., 2000). Heating the purified complex at 68°C for 2.5 h resulted in the formation of a precipitate that could be removed by centrifugation. Analysis of the supernatant revealed that the two V0 subunits were quantitatively removed by the procedure, while the V1 subunits seemed to be present in the same relative quantities as observed in the intact complex (Figure 1 lanes 2). The supernatant was loaded on an anion exchange column and the column was eluted with a KCl gradient (Figure 2). ATPase activity was observed only in the second half of the gradient (data not shown), where the absorption spectrum revealed three peaks centered around fractions 74, 87 and 96. Native gel electrophoresis of the fractions showed the presence of at least two different V1 complexes. The complex corresponding to the peak centered on fraction 74 had a slightly lower mobility than the complexes in the peaks around fractions 87 and 96 (Figure 2, inset bottom, right). In between the peaks around fractions 74 and 87, both complexes were visible in the same fractions as demonstrated for fraction 84. In a parallel experiment the native gel was stained for ATPase activity, which allows for a comparison of the specific activity of the complexes (Figure 2, inset top, left). Clearly, the complex with the lower mobility (74) had a much lower specific activity than that observed for the complex with the higher mobility (96). The complexes with the two different mobilities seem to correspond to Complexes II and III observed previously (Ubbink-Kok et al., 2000).
Figure 1.
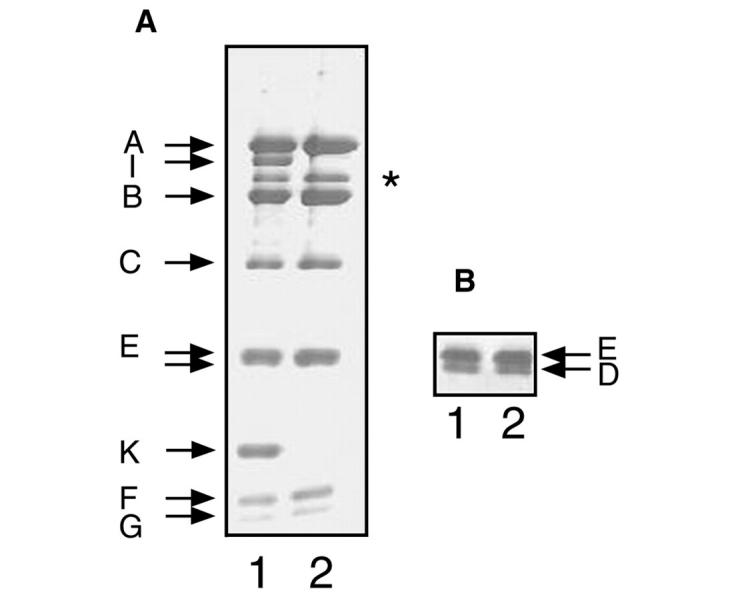
Dissociation of the V-ATPase. SDS–PAGE of the purified V-ATPase (lanes 1) and of a sample that was obtained by heating the purified complex followed by removal of the precipitate (lanes 2). (A) Twelve percent polyacrylamide gel. (B) Part of a 10% polyacrylamide gel that was run for a longer time to allow for a better separation of the D and E subunits. The band indicated by the asterisk is an impurity that is present to a variable extent in different V-ATPase preparations.
Figure 2.
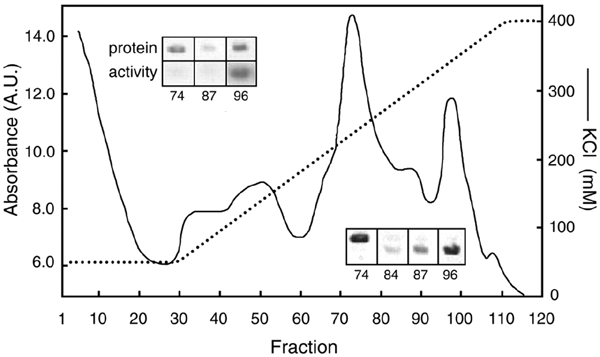
Separation of V1 subcomplexes. Elution profile of the Resource Q anion exchange column loaded with the sample containing the V1 subunits obtained by heating and spinning of the purified complex. The dotted line indicates the KCl gradient and the solid line the absorbance at 280 nm. Inset, bottom right: native gel electrophoresis of the indicated fractions showing two V1 complexes. The gel was stained with Coomassie Blue. Inset, top left: specific ATPase activity of the indicated fractions. Top row, Coomassie Blue staining; bottom row, activity staining.
The elution profile of the column suggested the presence of three different V1-ATPase complexes. SDS–PAGE of fraction 74 revealed the presence of four V1 subunits: A, B, C and E (Figure 3). The complex in fraction 87 consisted of one subunit less, containing subunits A, B and E. In addition, fraction 87 contained a small amount of subunit G. However, the elution profile of subunit G revealed the highest intensity around fraction 81, suggesting that the subunit was not part of the complex responsible for the ATPase activity in fraction 87. The complex in fraction 96 contained only subunits A and B. The band with the apparent molecular mass of ∼25 kDa in fractions 74 and 87 was assigned to subunit E by comparison with the ATPase complex (Figure 3B). Because of the low protein content of the fractions, the presence of a low amount of subunit D could not be excluded. Subunit D (and F) were not recovered elsewhere in the column fractions. The protein bands indicated by an asterisk in Figure 3A represent impurities that appeared in all fractions. The lower molecular weight band was only observed after silver staining. The complexes in fractions 74 and 87 seem to differ with the previously described Complexes II and III (Ubbink-Kok et al., 2000) in that they miss the two small subunits F and G.
Figure 3.
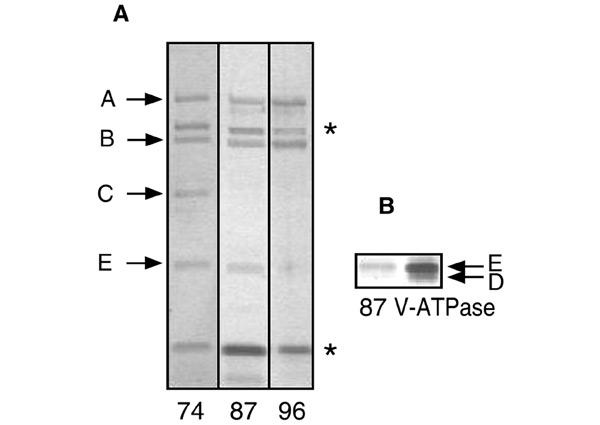
Subunit composition of V1-ATPase subcomplexes. (A) SDS–PAGE (12% polyacrylamide gel) of fractions 74, 87 and 96 of the Resource Q column (Figure 2). Bands indicated with an asterisk represent impurities. (B) Part of a 10% polyacrylamide gel that was run for a longer time to allow for a better separation of the D and E subunits.
Electron microscopy and image analysis
Inspection of electron microscopy images of the complexes in fractions 74, 87 and 96 showed particles that were attached to the carbon support film in mainly two preferential orientations: top- and side-view projections. A total of ∼33 000 top- and 17 000 side-view projections were extracted and classified after multi-reference alignments. A classification of the complete set of side-view projections showed class-sum images with a resolution of 16–18 Å. The features of the headpiece in side-view projection indicated similar orientations of the V1 subcomplexes on the grid as observed for the native complex (bilobed and trilobed views; Ubbink-Kok et al., 2000). The variation is readily seen from the position of knob-like extensions, on the left or right side of the projections (Figure 4). These extensions are composed of N-terminal inserts in the A subunit polypeptide chain (Domgall et al., 2002). More importantly, the averaged images could be divided into three groups with different central stalk regions: (i) projections containing a long central stalk (Figure 4A–H); (ii) projections with a smaller stalk (Figure 4I–L); and (iii) projections without any extending density in the stalk region (Figure 4M–P). For each of the subsets from fractions 74, 87 and 96, the relative numbers of V1 projections belonging to the three groups were determined by classification (Table 1). Approximately half of the images obtained from fraction 74, containing the subcomplex with subunits A, B, C and E, showed the long central stalk, while the images with the short stalk and no stalk were represented by ∼25% each. The majority of the subcomplex with subunits A, B and E (fraction 87) showed the short central stalk and very few long stalks. Finally, the majority of the subcomplexes in fraction 96 consisting of only subunits A and B belonged to the group with no central stalk. When the electron microscopy samples of the same column fraction were prepared after leaving the fractions on ice for a longer period of time, the distribution of the images over the three groups shifted in the order of 'long stalk' to 'short stalk' to 'no stalk', strongly suggesting that originally the extinction peaks around fractions 74, 87 and 96 correspond to the 'long stalk', 'short stalk' and 'no stalk' images, respectively (Table 1).
Figure 4.
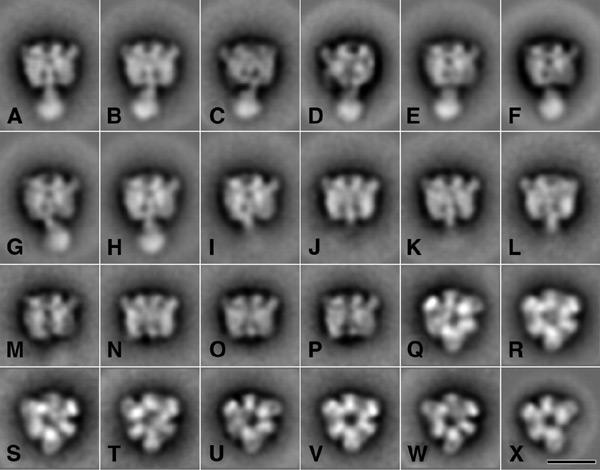
Averaging of single particle projections. A gallery of selected classes from a-periodic averaging of 17 000 side-view projections (A–P) and 33 000 top-view projections (Q–X). On average, each class-sum comprised about 400 projections. The bar is 100 Å.
Table 1.
Relative occurrence of V1-ATPase subcomplexes obtained after anion exchange chromatography
| Fraction | Preparation | Total no. of projections | Total no. of side-view projections | No. of side-view projections (%) containing | ||
|---|---|---|---|---|---|---|
| long stalk |
short stalk |
no stalk |
||||
| 74 |
I |
7207 |
1818 |
46 |
29 |
25 |
| II | 5166 | 954 | 23 | 40 | 37 | |
| 87 | I | 5778 | 1259 | 5 | 56 | 39 |
| II | 5350 | 1225 | – | 50 | 50 | |
| 96 | I | 5827 | 1274 | – | 24 | 76 |
| II | 7015 | 823 | – | 10 | 90 |
Numbers were derived by classifying sets of single particle projections from electron microscopy specimens prepared at 1.5 h after purification (preparation I) and 5 h after purification (preparation II).
Nearly all class-sums obtained from the analysis of 33 000 top views showed a hexagonal-shaped projection, in which three larger A subunits alternate with three smaller B subunits (Figure 4Q–X). Deviations from the expected 3-fold symmetry appear to be caused mostly by slight tilting. The strongest difference among the top views concerns the central region, which is weakly (Figure 4Q–U) or strongly stain-filled (Figure 4V and W). The images of Figure Q–U dominated in the projection obtained from fractions 74 and 87, whereas those of Figure 4V and W were almost exclusively observed in fraction 96. Figure 4X shows a breakdown fragment in which one B subunit is lacking. This fragment was not found in fractions 74 and 87, but ∼14% of the top views of fraction 96 belonged to this type of fragment.
Difference mapping
Difference mapping was performed to clarify the precise positions of specific stalk elements within the subcomplexes. Difference maps were constructed of class-sum images representing similar headpiece views from the complete V1V0 complex, the 'long stalk', the 'short stalk' and 'no stalk' groups. Comparisons of side-view projections of the 'long stalk' V1 subcomplexes and side-view projections of the complete complex indicated that the tip of the stalk is in close contact with the center of V0 (Figure 5A–F, arrows). The difference images also indicated the loss of the peripheral stator stalks and of densities at the top region of V1 upon fractionation. Comparison of V1 subcomplexes from the 'long stalk' and 'short stalk' groups (Figure 5G–O) indicated the loss of a spherical density in the lower part of the central stalk with a maximal width of ∼65 Å (Figure 5I, L and O). This density would correspond to subunit C. The difference map of the V1 subcomplexes from the 'short stalk' and the 'no stalk' groups revealed the position of a conicalshaped density (Figure 5P–R) corresponding to subunit E. It has a maximal length and width of ∼85 and 50 Å, respectively. Comparisons of the two main groups of top views (Figure 5S–X) showed only a strong density located in the center (Figure 5U and X). This density can be interpreted as being subunit E, but seen from the top.
Figure 5.
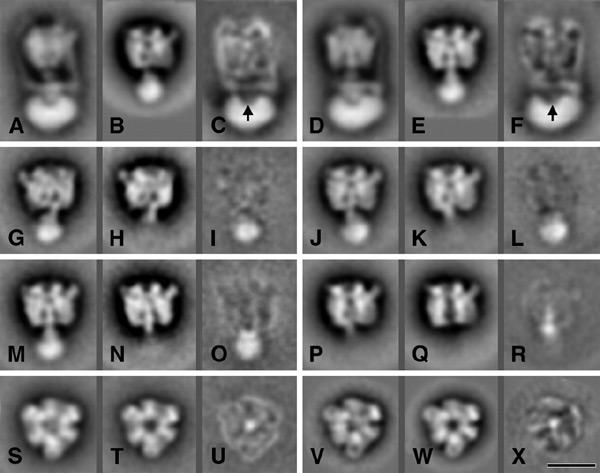
Difference mapping between compatible projection averages of V1V0 and V1 subcomplexes from Figure 4. The difference images (C, F, I, L, O, R, U and X) were obtained by subtracting the two preceding images. Arrows indicate differences in the stalk region. The bar is 100 Å.
Discussion
Three subcomplexes of the V-ATPase of C. fervidus were isolated after temperature-driven dissociation (Figure 2), which all contained the major V1 subunits A and B, but differed in the presence of the two subunits C and E with masses on SDS–PAGE of 37 and 26 kDa, respectively (Figure 3). The different subunit composition of the V1 subcomplexes corresponded with images in the electron microscopy analysis that differed in the stalk region (Figure 4). Averaged projections of the subcomplex that in addition to the A and B subunits contained subunit E revealed an extended density in the central cavity formed by the alternating A and B subunits, similar to the γ subunit in F-ATPases. The subcomplex that in addition contained subunit C revealed a spherical density attached to the E subunit at the V0 side. Difference mapping showed that the shape and position of subunit C in the complete enzyme is the same (Figure 5, arrows).
The subunit composition of the central stalk and stator region of V-ATPases is a matter of debate and the position of subunits is often assigned tentatively (Arata et al., 2002; Domgall et al., 2002). In this study, subunits C and E of the C. fervidus enzyme are assigned to the central stalk. The assignment of subunit C to the lower stalk density is unambiguous, but the assignment of subunit E to the upper density is tentative. First, because involvement of subunit D cannot be completely excluded due to the low protein content of the isolated subcomplex fractions (Figure 3), and, secondly, because of the following discussion. The structural genes coding for the complex of C. fervidus are not known and the nomenclature of the subunits is based only on a comparison with the complex from Enterococcus hirae. The 37 kDa C subunit, present in the lower part of the central stalk, corresponds to the 38 kDa subunit C in E. hirae. The E. hirae subunit is homologous to the VMA6 (or d subunit) of yeast (Murata et al., 2001). The assignment of C. fervidus subunit E to the other V-ATPases is more cumbersome because, other than in the E. hirae complex, subunits E and D have almost the same molecular mass on SDS–PAGE (26 and 25.5 kDa, respectively). The assignment of the C. fervidus subunits is based on a difference in staining intensity bands after SDS–PAGE between E and D. The 26 kDa subunit of C. fervidus, like the 24 kDa subunit E of E. hirae, shows a higher staining intensity than the 25.5 kDa subunit of C. fervidus and the 27 kDa subunit D of E. hirae, respectively (Ubbink-Kok et al., 2000). From this we conclude that the upper stalk mass corresponds to subunit E in the E. hirae enzyme. Based on limited sequence identity, subunits E and D of E. hirae would correspond to the VMA4 (E) and VMA8 (D) subunits of the yeast enzyme, respectively. The position and elongated form of subunit E suggests that it should be similar to the γ subunit of F-ATPase. However, no subunit of the V-ATPase complex shows significant homology to the γ subunit. Our assignment would be at variance with the suggestion that subunit VMA4 in yeast exists as an extended conformation on the outer surface of the A3B3 hexamer of the vacuolar H+-ATPase (Arata et al., 2002). Also, the previously reported copy number of 2–3 of subunit E of the C. fervidus enzyme is difficult to interpret. This issue remains to be resolved.
By exclusion, the stator structure of the C. fervidus V-ATPase is composed of subunits D, F, G and the hydrophilic part of subunit I. Subunits D, F and G were lost during the isolation of the subcomplexes, but, occasionally, low amounts of subunit D copurified with the subcomplex that contained both the E and C subunits. Possibly, subunit D is loosely associated with subunit C. The small subunits F and G correspond to the yeast subunits VMA10 and VMA7, respectively. Subunit I (subunit a in yeast) may be involved in one of the peripheral stalks (Domgal et al., 2000). In their 3D model, the a subunit extends from the membrane to the top of V1. The model shows a prominent 'spike' at this position and a similar feature is present in projections of bovine brain V-ATPase (Wilkens et al., 1999). This spike is less evident in the side views of C. fervidus complex (Ubbink-Kok et al., 2000; Figure 5A and D). Interestingly, the I subunit of C. fervidus has a substantially lower mass (61 versus 100 kDa) than its counterparts in yeast and bovine brain.
Our current model of the Na+-pumping V-ATPase of C. fervidus is depicted in Figure 6. The C subunit connects the E subunit, corresponding to the γ subunit in F-ATPases, to the membrane-bound V0 part. The C subunit does not have a counterpart in F-ATPases, which explains why the central stalk of V-ATPase is substantially longer than the central stalk of F-ATPase. The results emphasize the difference in the stalk regions of V-ATPases and F-ATPases. The difference may be related to the regulation of activity by in vivo disassembly of V1 and V0, which has been suggested for the V-ATPase of yeast (Kane and Parra, 2000).
Figure 6.
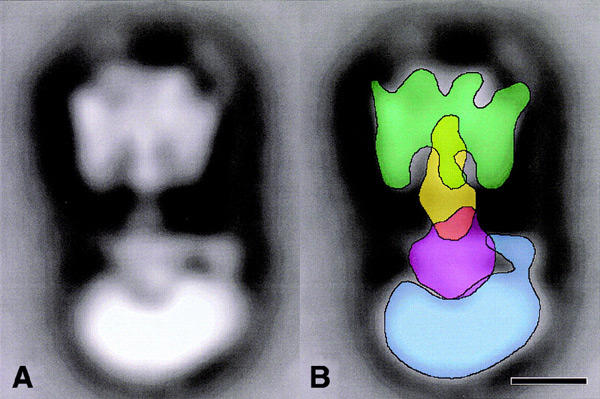
Positioning of central stalk subunits in V-ATPase as obtained from difference mapping. Overlaid contours, imposed on the side-view projection of V1V0-ATPase (from Boekema et al., 1999), mark the position of the A3B3 headpiece in V1 (green), the E subunit (yellow), the C subunit (purple) and the membrane-bound V0 part (blue). The bar is 50 Å.
Methods
Purification of V-ATPase.
The V-ATPase complex from C. fervidus was purified as described previously (Ubbink-Kok et al., 2000) with modifications. The procedure was scaled up to use 300 mg of membrane protein as the starting material. The membranes were resuspended in a final volume of 30 ml of buffer A (50 mM MOPS pH 7, 5 mM MgCl2, 2 mM DTT) containing 50 mM KCl and 3% glycerol. The Triton X-100 solubilized proteins were loaded on a DEAE column, washed with 90 ml of the same buffer containing 1% Triton X-100 and 60 ml of buffer containing 0.1% of the detergent. Subsequently, the column was eluted with a gradient of 50–300 mM KCl in buffer A containing 0.1% Triton X-100. The fractions were assayed for ATPase activity (Ubbink-Kok et al., 2000) and active fractions were pooled and concentrated by ultrafiltration to a final volume of 3 ml, using Vivaspin-20 (100 000 D cut-of; Depex). The concentrated sample was loaded on a HiLoad 26/60 Sephacryl S-400 size exclusion column equilibrated in buffer A containing 50 mM KCl and 0.05% Triton X-100. The column was run in a cold room at 0.25 ml/min and fractions of 1.0 ml were collected and assayed for ATPase activity. Fractions with ATPase activity were pooled and stored in liquid nitrogen. Protein concentration was measured according to Bradford using bovine serum albumin as a standard.
Isolation of V1 fragments and sample preparation.
A total of 4 mg of purified ATPase complex was concentrated to 0.24 ml using ultrafiltration. The concentrated enzyme was heated for 2.5 h at 68°C in a closed 1.5 ml reaction tube. A precipitate, which was formed during incubation, was removed by centrifugation for 10 min in a tabletop centrifuge operated at maximum speed and at room temperature. The supernatant was removed, diluted to 1 ml with buffer A containing 50 mM KCl and loaded on a 1 ml bed volume anion exchange column (Resource Q) equilibrated in the same buffer at 4°C. The column was eluted with a 50–400 mM KCl gradient in buffer A. Each fraction was prepared for electron microscopy analysis by diluting ∼5-fold with 5 mM MOPS buffer and by contrasting with 2% uranyl acetate as negative stain. Fractions were assayed for ATPase activity and analyzed by native PAGE followed by activity and protein staining, as well as by denaturing SDS–PAGE.
PAGE.
Native gel electrophoresis was based on a method described by Schägger and von Jagow (1991). The gel consisted of three parts containing 3, 4 and 8% of acrylamide at a ratio of 2:2:3. The anode buffer contained 50 mM Bis–Tris-propane, adjusted to pH 7 with concentrated HCl, and the cathode buffer contained 50 mM MES, adjusted to pH 7 using Bis–Tris-propane and 0.1% Triton X-100. The samples were gently mixed 4:1 with sample buffer (5% Triton X-100, 50% glycerol, 0.5 M MES pH 7, 0.5% bromphenol blue). The gel was run at a constant current of 25 mA for 4 h. For ATPase activity staining, the top part of the gel (3% acrylamide) was removed, after which the gel was incubated for 20 min at 45°C in ATPase assay buffer supplemented with 50 mM NaCl and 3 mM Tris–ATP. Liberated Pi was made visible by staining the gel for 5 min with malachite green molybdate reagent before fixation in 34% citric acid.
Electron microscopy and processing.
Images were recorded with a Philips CM10 TEM at 100 kV and 52 000× magnification. Micrographs were digitized with a Kodak Eikonix 1412 scanner at 4.6 Å/pixel at the specimen level. Single particle projections were extracted from negatives and analyzed with IMAGIC and GRIP software. Images were subsequently subjected to multireference alignment, multivariate statistical analysis and hierarchical ascendant classification. Resolution of the averaged projections was determined according to van Heel (1987).
Acknowledgments
We thank Klaas Gilissen for expert help and support from the Dutch Scientific foundation NWO/CW to E.J.B. is gratefully acknowledged.
References
- Arata Y., Baleja J.D. and Forgac M. (2002) Cysteine-directed cross-linking to subunit B suggests that subunit E forms part of the peripheral stalk of the vacuolar H+-ATPase. J. Biol. Chem., 277, 3357–3363. [DOI] [PubMed] [Google Scholar]
- Boekema E.J., van Breemen J.F.L., Brisson A., Ubbink-Kok T., Konings W.N. and Lolkema J. (1999) Connecting stalks in V-type ATPase. Nature, 401, 37–38. [DOI] [PubMed] [Google Scholar]
- Domgall I., Venzke D., Lüttge U., Ratajczak R. and Böttcher B. (2002) Three-dimensional map of a plant V-ATPase based on electron microscopy. J. Biol. Chem., 277, 13115–13121 [DOI] [PubMed] [Google Scholar]
- Forgac M. (2000) Structure, mechanism and regulation of the clathrin-coated vesicle and yeast vacuolar H+-ATPases. J. Exp. Biol., 203, 71–80. [DOI] [PubMed] [Google Scholar]
- Höner zu Bentrup K., Ubbink-Kok T., Lolkema J.S. and Konings W.N. (1997) An Na+-pumping V1V0-ATPase complex in the thermophilic bacterium Clostridium fervidus. J. Bacteriol., 179, 1274–1279. [DOI] [PMC free article] [PubMed] [Google Scholar]
- Kane P.M. and Parra K.J. (2000) Assembly and regulation of the yeast vacuolar H+-ATPase. J. Exp. Biol., 203, 81–87. [DOI] [PubMed] [Google Scholar]
- Murata T., Kawano M., Igarashi K., Yamoto I. and Kakinuma Y. (2001) Catalytic properties of Na+-translocating V-ATPase in Enterococcus hirae. Biochim. Biophys. Acta, 1505, 75–81. [DOI] [PubMed] [Google Scholar]
- Schägger H. and von Jagow G. (1991) Blue native electrophoresis for isolation of membrane protein complexes in enzymatically active form. Anal. Biochem., 199, 223–231. [DOI] [PubMed] [Google Scholar]
- Stock D., Leslie A.G.W. and Walker J.E. (1999) Molecular architecture of the rotary motor in ATP synthase. Science, 286, 1700–1705. [DOI] [PubMed] [Google Scholar]
- Ubbink-Kok T., Boekema E.J., van Breemen J.F.L., Brisson A., Konings W.N. and Lolkema J. (2000) Stator structure and subunit composition of the V1/V0 Na+-ATPase of the thermophilic bacterium Caloramator fervidus. J. Mol. Biol., 296, 311–321. [DOI] [PubMed] [Google Scholar]
- van Heel M. (1987) Similarity measures between images. Ultramicroscopy, 21, 95–100. [Google Scholar]
- Wilkens S., Vasilyeva E. and Forgac M. (1999) Structure of the vacuolar ATPase by electron microscopy. J. Biol. Chem., 274, 31804–31810. [DOI] [PubMed] [Google Scholar]