Abstract
Mutations in the gene encoding for the K+ channel α-subunit KCNQ1 have been associated with long QT syndrome and deafness. Besides heart and inner ear epithelial cells, KCNQ1 is expressed in a variety of epithelial cells including renal proximal tubule and gastrointestinal tract epithelial cells. At these sites, cellular K+ ions exit through KCNQ1 channel complexes, which may serve to recycle K+ or to maintain cell membrane potential and thus the driving force for electrogenic transepithelial transport, e.g., Na+/glucose cotransport. Employing pharmacologic inhibition and gene knockout, the present study demonstrates the importance of KCNQ1 K+ channel complexes for the maintenance of the driving force for proximal tubular and intestinal Na+ absorption, gastric acid secretion, and cAMP-induced jejunal Cl- secretion. In the kidney, KCNQ1 appears dispensable under basal conditions because of limited substrate delivery for electrogenic Na+ reabsorption to KCNQ1-expressing mid to late proximal tubule. During conditions of increased substrate load, however, luminal KCNQ1 serves to repolarize the proximal tubule and stabilize the driving force for Na+ reabsorption. In mice lacking functional KCNQ1, impaired intestinal absorption is associated with reduced serum vitamin B12 concentrations, mild macrocytic anemia, and fecal loss of Na+ and K+, the latter affecting K+ homeostasis.
Keywords: K+ channels, H+ secretion, Cl- secretion, glucose transport, amino acid transport
The pore-forming K+ channel α-subunit KCNQ1 (formerly KvLQT1) is expressed in the mid to late proximal tubule (PT) of the kidney (1, 2) and along the entire gastrointestinal tract (GIT) (3). Hence, KCNQ1 is likely to fulfill a variety of divergent tasks in the kidney and GIT. In humans, mutations in the gene encoding KCNQ1 are associated with long QT syndrome, a familial disorder predisposing those with the syndrome to sudden cardiac death, and can be associated with deafness (4-6). Likewise, mutations of kcnq1 in mice are associated with long QT syndrome and congenital deafness (7, 8). Whether mutations in KCNQ1 also affect kidney and GIT function is unknown.
In PT, reabsorption of glucose and amino acids is coupled to Na+ influx, thereby depolarizing the luminal membrane. This depolarization activates a slow K+ conductance across the luminal membrane that repolarizes the cell membrane (9, 10), which is important to maintaining the electrical driving force for Na+ reabsorption. The β-subunit KCNE1 (formerly IsK), which interacts with KCNQ1 in the heart (4, 5), is expressed in the luminal membranes of rat and mouse PT (1, 2). Studies of mice lacking KCNE1 indicated that the protein contributes to K+ fluxes into the lumen of PT that prevent membrane depolarization during electrogenic reabsorption of Na+ with glucose or amino acids. Moreover, absence of KCNE1 leads to increased renal excretion of Na+ and glucose and signs of volume depletion (1). The pore-forming partner(s) of KCNE1 in the kidney have not been established, but coexpression of KCNQ1 in mid to late PT (KCNE1 also expresses in early PT) (1) and activation of KCNE1/KCNQ1 currents by depolarization (2) suggest a potential role for KCNQ1.
In gastric parietal cells, KCNQ1 colocalizes with the β-subunit KCNE2 (3, 11, 12). Pharmacological blockade of KCNQ1 by chromanol 293B provided evidence for a role of KCNQ1/KCNE2 channel complexes in gastric acid secretion (12). Moreover, some of the characteristics of the putative native K+ conductance in the luminal membrane of gastric parietal cells are inherent to KCNQ1/KCNE2 channel complexes (3, 11). Because gastric acid secretion is mediated primarily by luminal H+/K+-ATPase, it was postulated that KCNQ1/KCNE2 channel complexes recycle K+ from the cell to the lumen to provide K+ for the H+/K+ exchange mechanism. Moreover, mice lacking KCNQ1 or the β-subunit of H+/K+-ATPase develop gastric hyperplasia at maturity and are achlorhydric (7, 13). Although H+/K+-ATPase was still expressed at considerable levels, the number of normal-appearing parietal cells was also significantly reduced in mice lacking KCNQ1 (7). Thus, the contribution of a reduced parietal cell number and the impairment of acid secretion of remaining parietal cells to the observed achlorhydria remained unclear, indicating the necessity to assess on the cellular level gastric acid secretion of mice lacking KCNQ1.
KCNQ1 is expressed along the entire GIT with the strongest expression in the jejunum, followed by the distal colon, and with only little expression in the ileum and the proximal colon (3). As in the PT, glucose and amino acid reabsorption in the small intestine is coupled to Na+ uptake and, thus, is electrogenic. Whether KCNQ1 contributes to stabilizing cell membrane potential and therefore to substrate reabsorption at this site is not known.
Both enhanced and reduced intestinal Cl- secretion through the cystic fibrosis transmembrane conductance regulator (CFTR) are of pathophysiological importance as evidenced by infection with Vibrio cholerae or by cystic fibrosis (14). KCNQ1/KCNE3 channel complexes reside in the basolateral membrane of the colon (15, 16) and may recycle K+ to create the driving force for luminal Cl- exit by repolarizing the cell membrane. Acute pharmacological inhibition of KCNQ1 channel complexes by chromanol 293B leads to nearly complete blockade of forskolin-induced Cl- secretion in rabbit and rat colons (16), indicating that inhibition of KCNQ1 may be a therapeutic option for the treatment of secretory diarrhea. The effect of chronic inhibition of KCNQ1 on intestinal Cl- secretion is unknown.
The aim of the present study was to explore the contribution of KCNQ1 to transport processes in the kidney and GIT in vivo. To this end, we further assessed the response to pharmacological blockade of KCNQ1 channel complexes and also compared mice lacking functional KCNQ1 (kcnq1-/-) with their wild-type littermates (kcnq1+/+).
Methods
All animal experimentation was conducted in accordance with the National Institutes of Health Guide for the Care and Use of Laboratory Animals and was approved by local authorities. Experiments were performed with male Munich-Wistar-Froemter rats and kcnq1-knockout mice (-/-) and littermate wild-type mice (+/+), the generation of which has been reported in ref. 17.
Metabolic Cage Experiments and Blood Analysis in kcnq1-/- Mice. Pairs of female mice were placed in metabolic cages (Tecniplast, Hohenpeissenberg, Germany) with free access to tap water and a control diet (0.44% Na+, 0.97% K+), and 24-h urine and feces collections were performed (18). While the mice were under isoflurane anesthesia, 80 μl of blood was drawn from the retrobulbar plexus to determine hematocrit and plasma concentrations of Na+, K+, and aldosterone (Diagnostic Systems Laboratories, Webster, TX; cross-reactivity with corticosterone is 0.02%). Concentrations of Na+ and K+ in urine and feces (the latter being determined after grinding dried feces and overnight extraction in 0.75 M HNO3) were determined by using a flame photometer (ELEX 6361, Eppendorf). Mice were switched to a low-K+ diet (<0.01% K+), and metabolic cage experiments were repeated after 7 days. In another set of female mice, the metabolic cage experiment was performed first after 1 week of high-K+ diet (5% K+) and after a subsequent week of low-NaCl diet (0.07% Na+). Blood was drawn again to determine hematocrit and plasma concentrations of Na+, K+, and aldosterone after completion of each series of metabolic cage experiments. In other mice on the control diet, blood was drawn to determine hematocrit, mean erythrocyte volume, and hemoglobin and vitamin B12 concentrations.
Whole-Kidney and Single-Nephron Function in Anesthetized kcnq1-/- Mice. Male mice were anesthetized with thiobutabarbital (100 mg/kg i.p.) and ketamine (100 mg/kg i.m.) and prepared for renal micropuncture (1). To assess two-kidney and single-nephron filtration rates, [3H]inulin was added to the infusion to deliver 20 μCi/h (1 Ci = 37 GBq). Urine was quantitatively collected by using a bladder catheter.
Free-flow collections. To determine reabsorption along the nephron, fluid was quantitatively collected from random PT sites, last PT, or first distal tubular loops on the kidney surface. Tubular fluid volume was determined from transfer to a constant-bore capillary. The concentrations of K+ and glucose in tubular fluid were determined by microflame photometer (1) and enzymatically (Infinity, Thermo Electron, Melbourne, Australia) in a flow-through microfluorometer (NanoFlo, World Precision Instruments, Sarasota, FL), respectively.
Controlled perfusion with 5 mM glucose. To enhance glucose load, the loop of Henle was perfused from the midproximal convoluted tubule (three or four superficial PT segments upstream from the last PT surface loop) with artificial tubular fluid (ATF) (130 mM NaCl/10 mM NaHCO3/4 mM KCl/2 mM CaCl2/7.5 mM urea/0.075% FD&C green, pH 7.4) containing 5 mM glucose at 7 nl/min downstream from an obstructing wax block, while tubular fluid was quantitatively collected from the first superficial distal tubular loop. Tubular samples were assayed for Na+ and K+ by microflame photometer, and glucose was assayed as described above.
Potential Difference Across the Basolateral Cell Membrane (PDbl) in Isolated Perfused Mid to Late PT of kcnq1-/- Mice. PDbl was determined with and without glucose in the perfusate to stimulate electrogenic absorption as described in ref. 1. Bath and luminal perfusates were composed of 120 mM NaCl, 5 mM KCl, 20 mM NaHCO3, 1.3 mM CaCl2, 1 mM MgCl2, and 2 mM Na2HPO4. In the bath, 1 mM glucose, 2 mM glutamine, and 1 mM sodium lactate were added, and 5 mM mannitol was added to the lumen. Where indicated, 5 mM mannitol was replaced by 5 mM glucose in the luminal perfusate. Entry of positive charge by electrogenic transport is expected to depolarize the basolateral cell membrane.
Effect of HMR1556, an Inhibitor of KCNQ1, on Glucose and Na+ Absorption in Renal Micropuncture Experiments in Rats. Rats were anesthetized and prepared for renal micropuncture. Loops of Henle were perfused from midproximal convoluted tubule sites (three or four superficial PT segments upstream from the last PT loop on the kidney surface) with ATF (see composition above) at 16 nl/min downstream from an obstructing wax block. Tubular fluid was quantitatively collected from the first superficial distal tubular loop first during perfusion with ATF containing 0, 5, or 20 mM glucose. Tubular absorption was reassessed in a paired fashion with the same solution (time control) or with the addition of HMR1556 (10 μM, Aventis, Frankfurt), an inhibitor of KCNQ1 (19), to the perfusate.
pH Recovery in Isolated Gastric Glands of kcnq1-/- Mice. Individual gastric glands were isolated by using a hand dissection technique and attached to a glass coverslip precoated with Cell-Tak adhesive (BD Biosciences, Franklin Lakes, NJ). After incubation in a hepes-buffered Ringer's solution containing 7.5 μM 2′7′-bis(carboxyethyl)-5(6)-carboxyfluorescein pentaacetoxymethyl ester (Molecular Probes) for 5 min, the chamber was flushed for 5 min with Ringer's solution to remove any deesterified dye. The perfusion chamber was mounted on the stage of an inverted microscope (Axiovert 135, Zeiss), which was used in the epifluorescence mode with a ×40 oil-immersion objective (Zeiss). 2′,7′-Bis(carboxyethyl)-5(6)-carboxyfluorescein was successively excited at 490 ± 10 and 440 ± 10 nm, and the emission signal was monitored at 535 ± 10 nm by using an intensified charge-coupled device camera (Proxitronic, Bensheim, Germany). Parietal cells were identified by their morphologic appearance and their rapid uptake of the fluorescent dye in contrast with gastric chief cells. Intensity ratio data (490/440) were converted to pH values using the high-K+/nigericin calibration technique.
Solutions, flow lines, and the perfusion chamber were maintained at 37°C. H+ secretion was stimulated by adding 100 μM histamine or 100 μM carbachol (both Sigma) to the incubation solution (20). Cells were acidified by using the NH4Cl technique (21). pH recovery was assessed from the dynamics of pH changes back to neutral. To remove Na+ from the perfusion chamber and prevent Na+/H+-exchanger-mediated realkalinization, NaCl-containing solution was replaced by N-methyl-d-glucamine solution 90 s before the application of the  pulse.
Jejunal and Colonic Transport of kcnq1-/- Mice. For analysis of electrogenic intestinal amino acid and glucose transport, proximal jejunal segments (5-10 cm after the pylorus) were mounted into a custom-made miniUssing chamber (22). Under control conditions, the serosal and luminal perfusate contained the following: 100 mM NaCl, 2 mM KCl, 1 mM MgCl2, 1.25 mM CaCl2, 0.4 mM KH2PO4, 1.6 mM K2HPO4, 5 mM sodium pyruvate, 25 mM NaHCO3, 20 mM mannitol (pH 7.4), and 1 μM indomethacin (Sigma) to prevent prostaglandin E2-stimulated Cl- secretion. Where indicated, 20 mM phenylalanine or 20 mM glucose was added to the luminal perfusate at the expense of mannitol.
To assess jejunal chloride secretion, jejunual tissue was mounted into a miniUssing chamber. Under control conditions, serosal and luminal perfusates contained the following: 145 mM NaCl, 1 mM MgCl2, 2.6 mM calcium gluconate, 0.4 mM KH2PO4, 1.6 mM K2HPO4, and 5 mM glucose. One micromolar indomethacin (Sigma) and 10 nM tetrodotoxin (Molecular Probes) were added. cAMP-stimulated Cl- secretion was activated by adding 2.5 μM forskolin to the basolateral solution. The resultant short circuit current was calculated as described in ref. 16. Current mediated by the colonic epithelial Na+ channel (ENaC) was analyzed using the same setup and control solution as for the assessment of jejunal chloride secretion, and 50 μM amiloride (Sigma) was added to the luminal perfusate. Experiments were performed in a permutated fashion in the afternoon.
Statistical Analysis. Data are presented as means ± SEM. Unpaired Student's t tests have been performed to analyze for statistical differences in kcnq1-/- as compared with kcnq1+/+ mice. P < 0.05 was considered statistically significant.
Results
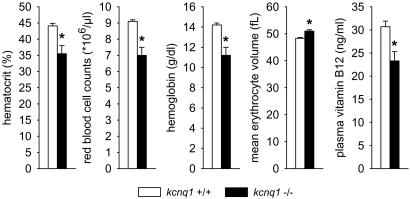
Blood Analysis and Systemic Na+ and K+ Balance. kcnq1-/- mice present mild macrocytic anemia. Body weights were similar in kcnq1-/- and kcnq1+/+ (male, 31 ± 1 versus 32 ± 2 g; female, 24 ± 1 versus 23 ± 1 g; n = 9 per group). Both male and female kcnq1-/- presented lower arterial hematocrit versus kcnq1+/+ (44 ± 1% versus 48 ± 1% and 40 ± 2% versus 48 ± 1%, P < 0.05 for each comparison). The lowest hematocrit value of these female kcnq1+/+ was 46.5%, whereas four of nine kcnq1-/- had values below 37.5%. A second set of female mice revealed lower red blood cell counts and hemoglobin concentrations as well as greater mean erythrocyte volume in kcnq1-/-, findings pointing to macrocytic anemia. Thus, serum vitamin B12 levels were determined and found significantly lower in kcnq1-/- (Fig. 1).
Fig. 1.
kcnq1-/- mice present signs of macrocytic anemia. kcnq1-/- presented lower hematocrit, red blood cell counts, and hemoglobin concentrations but greater mean erythrocyte volume, which is associated with lower serum vitamin B12 levels. n = 9 mice per genotype. *, P < 0.05 versus kcnq1+/+.
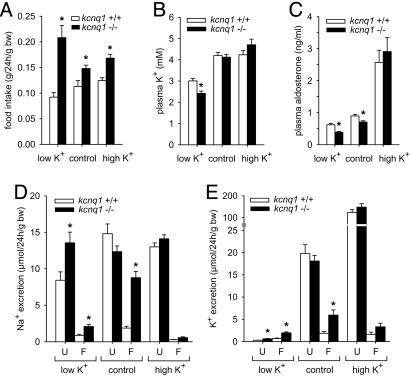
kcnq1-/- mice present normal urinary excretion but fecal loss of Na+ and K+. Food intake was greater in kcnq1-/- than in kcnq1+/+ irrespective of diet (Fig. 2A), probably reflecting, at least in part, their greater physical activity due to the Shaker-Waltzer behavior (7, 17). Under the control diet, no significant differences were observed between kcnq1-/- and kcnq1+/+ with regard to plasma concentrations of Na+ (152 ± 1 versus 153 ± 1 mM, not significant) and K+ (Fig. 2B), urinary flow rate (68 ± 5 versus 62 ± 7 μl/24 h per g of body weight, not significant), urinary excretion of Na+ (Fig. 2D) and K+ (Fig. 2E), or glucose (0.48 ± 0.05 versus 0.41 ± 0.04 μmol/24 h per g of body weight, not significant).
Fig. 2.
kcnq1-/- mice present normal urinary excretion but fecal loss of Na+ and K+ and tend toward hypokalemia. Mice were kept on low-K+, high-K+, and control diets. (A) Food intake was greater in kcnq1-/- on all three diets. bw, Body weight. (B and C) On a low-K+ diet, kcnq1-/- presented lower plasma K+ concentrations despite lower plasma aldosterone concentrations. (D and E) In contrast with normal urinary excretion (U), kcnq1-/- lost Na+ and K+ through feces (F) out of proportion with food intake when on the control diet. Under the high-K+ diet, both genotypes showed similar plasma K+ and aldosterone concentrations associated with pronounced increases in urinary K+ excretion. n = 6-9 pairs of mice per genotype for metabolic cages and n = 12-18 mice for plasma parameters. *, P < 0.05 versus kcnq1+/+.
In contrast, kcnq1-/- on the control diet lost Na+ and K+ through the feces out of proportion with food intake (Fig. 2 D and E). Despite significant fecal Na+ loss, plasma concentrations of aldosterone were lower in kcnq1-/- than in kcnq1+/+ on the control diet (Fig. 2C). A low-K+ diet for 1 week revealed persistent fecal K+ loss and lower plasma K+ concentrations in kcnq1-/- than in kcnq1+/+ (Fig. 2 E and B), despite a further reduction in plasma aldosterone concentration (Fig. 2C). In comparison, under a high-K+ diet, kcnq1-/- and kcnq1+/+ showed similar plasma K+ and aldosterone concentrations and similarly pronounced increases in urinary K+ excretion, making the tendency for greater fecal K+ excretion of kcnq1-/- negligible. These results suggest that suppressed basal plasma aldosterone concentrations serve to stabilize plasma K+ in kcnq1-/-.
After a low-NaCl diet for 1 week, food intake (0.18 ± 0.01 versus 0.13 ± 0.01 g/24 h per g of body weight, n = 8 pairs per group, P < 0.05) and fecal Na+ excretion (0.84 ± 0.13 versus 0.32 ± 0.09 μmol/24 h per g of body weight, P < 0.05) were significantly greater in kcnq1-/- than in kcnq1+/+. However, the absolute difference in fecal Na+ excretion between genotypes was significantly reduced as compared with genotypes on the control diet. Fecal K+ excretion was not different between kcnq1-/- and kcnq1+/+ (0.79 ± 0.25 versus 0.68 ± 0.2 μmol/24 h per g of body weight, not significant) during the low-NaCl diet, indicating a role of intestinal Na+ loading in the pathophysiology of fecal K+ loss of kcnq1-/-. Plasma K+ concentrations were not different between kcnq1-/- and kcnq1+/+ mice (3.3 ± 0.1 versus 3.5 ± 0.1 mM, not significant) and, although a tendency was still apparent, plasma aldosterone concentrations were not significantly different between genotypes on the low-NaCl diet (0.87 ± 0.07 versus 1.06 ± 0.10 ng/ml, not significant), further supporting a link between fecal K+ loss and lower basal plasma aldosterone concentrations in kcnq1-/-.
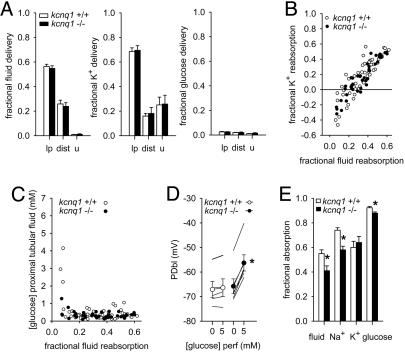
Renal Function. PT cell membrane potential and reabsorption is unaltered under basal conditions but impaired in response to increasing luminal glucose load in kcnq1-/- mice. Mean arterial blood pressure was modestly lower, and heart rate was modestly greater in kcnq1-/- compared with kcnq1+/+ [106 ± 5 versus 122 ± 3 mmHg (1 mmHg = 133 Pa); 591 ± 21 versus 522 ± 13 1/min; n = 6 per group, both P < 0.05], which may relate to fecal loss of Na+ and modestly lower plasma aldosterone concentrations. Glomerular filtration rate (9.0 ± 1.1 versus 8.5 ± 0.9 μl/min per g of body weight) and fractional urinary excretion of fluid (0.9 ± 0.1% versus 0.8 ± 0.3%), Na+ (1.1 ± 0.4% versus 0.9 ± 0.3%), K+ (26 ± 7% versus 25 ± 6%) (Fig. 3A), and glucose (1.5 ± 0.4% versus 1.1 ± 0.1%) (Fig. 3A) were similar in kcnq1-/- and +/+.
Fig. 3.
PT cell membrane potential and reabsorption is unaltered under basal conditions but impaired in response to increasing luminal glucose in kcnq1-/- mice. (A) Basal delivery of fluid, K+, and glucose to last proximal (lp) and first distal (dist) surface loop and urine (u) were normal in kcnq1-/-. n = 8 or 9 distal and 22-29 PT in six mice per genotype. (B) Evidence for net fluxes of K+ into early PT in both genotypes. Individual collections are shown. (C) Glucose concentrations rapidly dropped along PT irrespective of genotype, indicating low basal loads to KCNQ1-expressing mid and late PT. Individual collections are shown. (D) Basal potential differences across basolateral cell membrane of mid to late PT (PDbl) were not different between genotypes. Adding 5 mM luminal glucose elicited depolarization only in kcnq1-/-. n = 5 or 6 tubules in four mice per genotype. (E) Loading mid PTs with ATF containing 5 mM glucose revealed lower reabsorption of Na+, fluid, and glucose up to the distal tubule in kcnq1-/-. n = 12 or 13 nephrons in three mice per genotype. *, P < 0.05 versus kcnq1+/+.
Single-nephron glomerular filtration rates were similar in kcnq1-/- and kcnq1+/+ from distal (6.8 ± 0.8 versus 6.4 ± 0.9 nl/min, 8 or 9 nephrons in six mice per group) and late PT collections (6.4 ± 0.5 versus 6.6 ± 0.4 nl/min, n = 22-29 nephrons in six mice per group). Fractional delivery of fluid, K+, and glucose to late PT and distal tubule were not different between genotypes (Fig. 3A).
In both genotypes, fractional K+ reabsorption in early PT was negative (Fig. 3B), indicating KCNQ1-independent K+ fluxes into early PT. Moreover, glucose concentrations very rapidly decreased along PT with mean concentrations below 0.5 mM after reabsorption of ≈10% of filtered fluid irrespective of genotype (Fig. 3C).
In isolated perfused mid to late PT segments, the PDbl was not different between kcnq1-/- and kcnq1+/+ in the absence of luminal glucose (Fig. 3D). Addition of 5 mM glucose to the luminal fluid did not significantly alter PDbl in kcnq1+/+ but elicited a significant depolarization in kcnq1-/- as a consequence of depolarization of the luminal membrane (Fig. 3D).
To study consequences of glucose-induced depolarization in kcnq1-/-, nephrons were perfused from midproximal to distal tubule with a perfusate containing 5 mM glucose. Consistent with the lowering of the electrochemical driving force for Na+ reabsorption in kcnq1-/-, this maneuver revealed lower absorption of Na+, fluid, and glucose in the perfused nephron segment in kcnq1-/- compared with kcnq1+/+, whereas the absorption of K+ was not different (Fig. 3E).
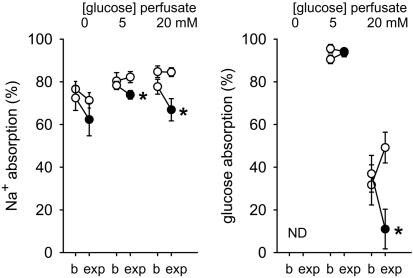
PT Na+ reabsorption is unaltered in the absence of glucose but reduced during increased luminal glucose load in response to pharmacological inhibition of KCNQ1 in the rat. During loop of Henle perfusion from mid PT downstream of an obstructing wax block, fluid was collected from the first superficial distal tubular loop. As described in ref. 23, time control experiments with glucose-free ATF revealed a small reduction in Na+ absorption during recollection (Fig. 4). This reduction was absent in time controls with 5 or 20 mM glucose. Compared with the time controls, HMR1556, a blocker of KCNQ1 (19), reduced Na+ absorption only in the presence of luminal glucose.
Fig. 4.
Pharmacological inhibition of KCNQ1 reduces PT Na+ reabsorption in the presence of luminal glucose. During loop of Henle perfusion from mid PT, fluid was collected from the first superficial distal tubular loop in rats. Collections were performed first during perfusion with ATF containing 0, 5, or 20 mM glucose (basal, b). Tubular absorption was reassessed in a paired fashion (experimental, exp) with the same solution (open circles) or the addition of 10 μM HMR1556 to inhibit KCNQ1 (filled circles). n = 5-8 nephrons per perfusion in eight rats. *, P < 0.05 versus time control. ND, not determined.
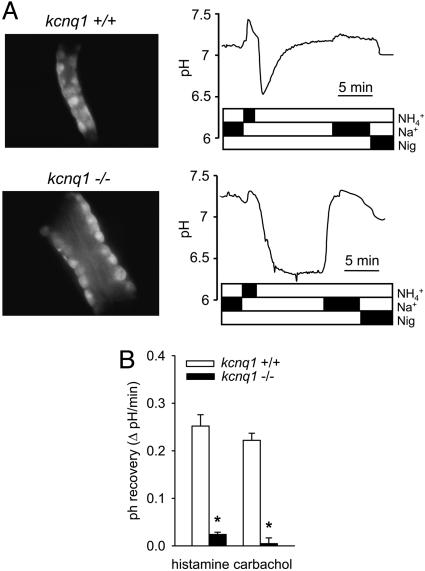
Gastric Function: pH Recovery in Parietal Cells Is Drastically Reduced in kcnq1-/- Mice. Microdissected gastric glands of kcnq1-/- were considerably longer and wider, as described in ref. 7 (Fig. 5A). Parietal cells of kcnq1-/- were not appreciably smaller and did not take up less fluorescent dye than kcnq1+/+. To identify a role of KCNQ1 in gastric acid secretion, we determined pH recovery after activation of histamine H2 receptors or muscarinic M3 receptors and acidification of parietal cells by a  pulse. pH recovery mediated by Na+/H+-exchangers (NHE) or
  transporters was prevented by using Na+- and
  -free perfusates. Resting pH (before
  pulse) was not different between genotypes: In the presence of histamine, pH amounted to 7.14 ± 0.01 (n = 124) and 7.10 ± 0.01 (n = 98) in kcnq1-/- and kcnq1+/+, and with the muscarinic agonist carbachol, pH was 7.22 ± 0.02 (n = 81) and 7.23 ± 0.02 (n = 83), respectively. However, the recovery rate to neutral pH after an
  pulse was reduced by ≈90% in kcnq1-/- compared with kcnq1+/+ prestimulated with histamine or carbachol (Fig. 5). These results indicate on a cellular level an essential role of KCNQ1 for gastric acid secretion.
Fig. 5.
Loss of gastric pH recovery in kcnq1-/- mice. (A) Representative original photographs (oil immersion ×40) and pH recovery tracings after an  pulse in histamine-prestimulated gastric glands of kcnq1+/+ (Upper) and kcnq1-/- (Lower). Gastric glands of kcnq1-/- appear wider and show impaired realkalinization under Na+-free conditions (H+/K+-ATPase-mediated) but readily normalize their intracellular pH after the readdition of Na+. Nig, nigericin (for calibration). (B) Realkalinization is blunted with both histamine and carbachol (each 100 μM) prestimulation in kcnq1-/-. n = 81-124 cells in six or seven glands of five or six mice per genotype. *, P < 0.05 versus kcnq1+/+.
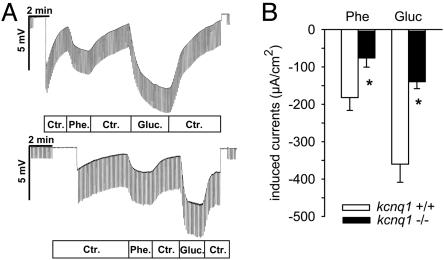
Intestinal Function. Phenylalanine- and glucose-stimulated jejunal currents are reduced in kcnq1-/- mice and by pharmacological inhibition of KCNQ1. Basic electrophysiological properties of jejunal mucosa were not significantly different between genotypes. Transepithelial potential difference, transepithelial resistance, and short circuit current amounted to -1.24 ± 0.17 mV, 21 ± 3 Ω·cm2, and -60 ± 9 μA/cm2 in kcnq1-/- and amounted to -0.78 ± 0.21 mV, 18 ± 1 Ω·cm2, and -44 ± 11 μA/cm2 in kcnq1+/+ (each n = 6, not significant). However, both phenylalanine- and glucose-induced currents were smaller in kcnq1-/- (Fig. 6). Moreover, bilateral blockade of KCNQ1 in kcnq1+/+ with chromanol 293B (10 μM) (16) decreased electrogenic glucose-induced currents (-343 ± 39 to -228 ± 31 μA/cm2) and phenylalanine-induced currents (-342 ± 45 to -217 ± 30 μA/cm2, n = 13-15, P < 0.05 for each comparison).
Fig. 6.
Reduced glucose (Gluc)- and phenylalanine (Phe)-induced currents in jejunum of kcnq1-/- mice. (A) Representative original miniUssing-chamber recordings in response to phenylalanine or glucuse (each 20 mM) of kcnq1+/+ (Upper) and kcnq1-/- (Lower). Ctr, control. (B) For both phenylalanine and glucose, the resultant change in equivalent short circuit current is reduced by half in kcnq1-/- versus kcnq1+/+. n = 6 mice per genotype. *, P < 0.05 versus kcnq1+/+.
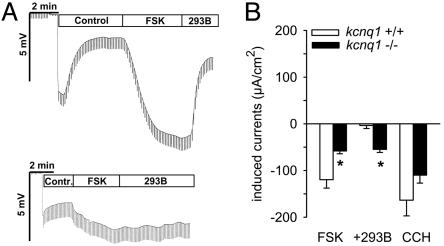
In kcnq1-/- mice, forskolin-stimulated jejunal Cl- secretion is decreased. Forskolin-activated jejunal Cl- secretion was ≈50% less in kcnq1-/- than in kcnq1+/+ (Fig. 7). Bilateral chromanol 293B blunted forskolin-stimulated currents in kcnq1+/+ but was ineffective in kcnq1-/- (Fig. 7). In comparison, activation of Ca2+-activated Cl- secretion by carbachol under these conditions was not significantly different between genotypes (Fig. 7B).
Fig. 7.
Forskolin-induced jejunal Cl- secretion is reduced but not abolished in kcnq1-/- mice. (A) Representative original tracings from jejunal Cl- secretion experiments with basolateral application of 2.5 μM forskolin (FSK) and 10 μM chromanol 293B (293B) in kcnq1+/+ (Upper) and kcnq1-/- (Lower). (B) Forskolin-induced Cl- secretion was reduced by 50% in kcnq1-/- versus kcnq1+/+. Adding chromanol 293B (293B) blunted the effect of forskolin in kcnq1+/+ but was ineffective in kcnq1-/-. Activation of Ca2+-activated Cl- secretion by 100 μM carbachol (CCH) was not different between genotypes. n = 9 mice per genotype. *, P < 0.05 versus kcnq1+/+.
Amiloride-sensitive currents in the distal colon tend to be enhanced in kcnq1-/- mice. Amiloride (50 μM) was added to the luminal perfusate to evaluate short circuit current attributable to the epithelial Na+ channel in mice on the control diet. As a result of high variance in the animals tested, amiloride-inhibitable short circuit currents were not significantly different between kcnq1-/- and kcnq1+/+ (286 ± 95 versus 114 ± 18 μA/cm2; n = 8 or 9, not significant). Although lower plasma concentrations of aldosterone in kcnq1-/- may have reduced intestinal Na+ reabsorption, the tendency for increased amiloride-inhibitable currents in kcnq1-/- and the observation that forskolin-stimulated colonic NaCl secretion depends highly on KCNQ1/KCNE3 (15, 16, 24) argue against this segment as the site of primary Na+ loss.
Discussion
Mice lacking KCNQ1 provide no signs of renal Na+ or glucose loss. This finding is in contrast with mice lacking KCNE1 (1). The latter colocalizes with KCNQ1 in mid to late PT and therefore may act as a β-subunit for KCNQ1 at these sites (1). The different whole kidney phenotype and the observation that in the absence of luminal glucose, the basolateral membrane of late PT is depolarized in mice lacking KCNE1 (1) but, not as shown here, in mice lacking KCNQ1 suggest that KCNE1 may interact with additional K+ channels in PT. This interaction may be particularly important in early proximal segments, where KCNE1 but not KCNQ1 is expressed (1). Direct micropuncture, in fact, revealed KCNQ1-independent K+ fluxes into early PT, which are proposed to counteract the depolarizing effects of electrogenic Na+ reabsorption. Moreover, luminal glucose concentrations rapidly declined along the early PT, leaving little glucose for electrogenic reabsorption in KCNQ1-expressing mid to late PT. A role for KCNQ1 in PT repolarization and maintenance of the driving force for Na+ reabsorption, however, was uncovered by increasing the glucose load to mid PT, indicating that repolarizing K+ fluxes through KCNQ1 can become important under conditions of enhanced electrogenic reabsorption (which could include conditions of hyperglycemia that overwhelm the glucose transport capacity of the early PT).
In contrast with the apparently normal basal reabsorption of the kidney, mice lacking KCNQ1 lose Na+ and K+ in their feces. Despite fecal Na+ loss, kcnq1-/- mice have lower plasma aldosterone concentrations, which may contribute to the observed modestly lower arterial blood pressure in these mice. The latter would be appropriate to limiting renal Na+ excretion under conditions of reduced circulating aldosterone. Modestly reduced plasma aldosterone concentrations in mice lacking KCNQ1 may serve to stabilize plasma K+ concentrations by lowering urinary K+ excretion (relative to the increased dietary K+ intake) to compensate for the fecal K+ loss. In accordance, a low-K+ diet unmasked hypokalemia in kcnq1-/- compared with kcnq1+/+ mice. Moreover, feeding the mice a high-K+ diet or preventing fecal K+ loss in kcnq1-/- mice (by applying a low-NaCl diet) prevented significant differences in plasma aldosterone between genotypes. On the other hand, the normal response to a high-K+ diet in knockout mice indicated that KCNQ1 is not required for K+-dependent upregulation of aldosterone and renal K+ excretion. This finding is in contrast with mice lacking KCNE1, which show a marked increase of plasma aldosterone levels in response to a high-K+ diet despite lower plasma K+ concentrations (25). Because KCNE1 and KCNQ1 mRNAs are coexpressed in the zona glomerulosa of the adrenal glands, it was suggested that the KCNQ1/KCNE1 channel itself may directly participate in the control of aldosterone secretion by plasma K+ (25). Additional pore-forming partners of KCNE1 might explain the observed differences between the two animal models.
Glucose- and phenylalanine-induced jejunal currents were significantly reduced in kcnq1-/- mice. The substrate-induced currents were similarly decreased in wild-type mice by pharmacological blockade of KCNQ1. Thus, KCNQ1 plays an important role in electrogenic transport mechanisms in the jejunum. KCNQ1 is presumably effective by repolarizing the cell membrane, which is critical to stabilizing the driving force for electrogenic Na+-coupled transport. A reduced jejunal Na+ uptake is expected to result in kcnq1-/- mice, and this defect is likely to explain, at least in part, the fecal Na+ loss. The increase of Na+ delivery to the colon may result in intestinal K+ loss. Accordingly, intestinal K+ loss was prevented in kcnq1-/- mice by feeding them a low-NaCl diet, which reduces the amount of Na+ delivered to the distal colon.
In jejunum, forskolin-stimulated Cl- secretion is reduced by ≈50% in kcnq1-/- mice. This finding was rather surprising, given the fact that pharmacological blockade of KCNQ1 almost completely prevented forskolin-induced Cl- secretion in rabbit and rat colon (16). On the other hand, mice lacking cystic fibrosis transmembrane conductance regulator (CFTR)-dependent Cl- secretion develop intestinal obstruction secondary to reduced intestinal fluid secretion (26). This is apparently not the case in kcnq1-/- mice, in which background K+ channels other than KCNQ1/KCNE3, which are not active in wild-type mice, may become active in the absence of KCNQ1. Alternatively, activation of luminal CFTR by cAMP on the basis of basal K+ currents may partly restore Cl- secretion. Together with impaired Na+ reabsorption (see above), the residual jejunal Cl- secretion appears sufficient to avoid luminal obliterations in kcnq1-/- mice. Nonetheless, complete pharmacological blockade of forskolin-induced Cl- secretion by chromanol 293B in wild-type mice shows that at least short-term inhibition of KCNQ1/KCNE3 complexes could be therapeutically effective in secretory diarrhea, assuming that the benefits of the inhibitory effect on intestinal Cl- secretion prevail over the inhibitory effect on jejunal Na+ absorption.
Two major pathways stimulate gastric acid secretion through H+/K+-ATPase, namely histamine H2 receptor-induced increases in cAMP and muscarinic M3 receptor-induced increases of intracellular Ca2+ (27). During activation of these pathways, Na+-independent realkalinization of gastric glands, which requires H+ secretion, is virtually absent in kcnq1-/- mice, demonstrating on a functional genomic and cellular basis a role of KCNQ1 in gastric acid secretion.
The present study provides the seemingly unrelated observation that hematocrit is lower in kcnq1-/- mice. This property contrasts with mice lacking KCNE1, which show increased arterial hematocrits reflecting volume depletion (25). In humans, gastric parietal cells secrete intrinsic factor, which is needed to reabsorb vitamin B12 in the intestine. Vitamin B12 is essential for normal development of red blood cells, and impaired intestinal vitamin B12 absorption can cause pernicious macrocytic anemia. In rats and mice, intrinsic factor is mostly secreted by gastric chief cells, and only 4-10% of parietal cells stain positive for intrinsic factor (28, 29). Notably, KCNQ1 is expressed in both gastric parietal and chief cells of the mouse (7). Moreover, intrinsic factor-expressing chief cells are smaller and present in decreased numbers in mice lacking KCNQ1 (7). The present study revealed that the lower hematocrit in kcnq1-/- mice was associated with signs resembling aspects of pernicious anemia, including macrocytic anemia and reduced vitamin B12 levels in serum. These results are consistent with the notion that a lack of KCNQ1 impairs intestinal vitamin B12 absorption.
In summary, employing pharmacologic inhibition and gene knockout, the present study demonstrates the importance of KCNQ1 for renal and gastrointestinal epithelial function and K+ homeostasis. Whether humans with mutations in KCNQ1 have impaired functions in these epithelia and altered K+ homeostasis, which may affect the heart or inner ear phenotype, remains to be determined.
Acknowledgments
This work was supported by grants provided by the Deutsche Forschungsgemeinschaft and the Bundesministerium für Bildung und Forschung (to V.V. and F.L.), by National Institutes of Health Grants DK56248 and DK28602 (to V.V.), and intramural funds of the National Institute of Child Health and Human Development (to K.P.).
Author contributions: V.V., F.G., H.V., and F.L. designed research; V.V., F.G., H.V., C.D.S., K.R., and R.R. performed research; V.V., F.G., H.V., and K.R. analyzed data; U.G., Q.R., and K.P. contributed new reagents/analytic tools; and V.V., F.G., and F.L. wrote the paper.
Conflict of interest statement: No conflicts declared.
This paper was submitted directly (Track II) to the PNAS office.
Abbreviations: ATF, artificial tubular fluid; GIT, gastrointestinal tract; PDbl, potential difference across basolateral cell membrane; PT, proximal tubule.
References
- 1.Vallon, V., Grahammer, F., Richter, K., Bleich, M., Lang, F., Barhanin, J., Volkl, H. & Warth, R. (2001) J. Am. Soc. Nephrol. 12, 2003-2011. [DOI] [PubMed] [Google Scholar]
- 2.Sugimoto, T., Tanabe, Y., Shigemoto, R., Iwai, M., Takumi, T., Ohkubo, H. & Nakanishi, S. (1990) J. Membr. Biol. 113, 39-47. [DOI] [PubMed] [Google Scholar]
- 3.Dedek, K. & Waldegger, S. (2001) Pflügers Arch. 442, 896-902. [DOI] [PubMed] [Google Scholar]
- 4.Barhanin, J., Lesage, F., Guillemare, E., Fink, M., Lazdunski, M. & Romey, G. (1996) Nature 384, 78-80. [DOI] [PubMed] [Google Scholar]
- 5.Sanguinetti, M. C., Curran, M. E., Zou, A., Shen, J., Spector, P. S., Atkinson, D. L. & Keating, M. (1996) Nature 384, 80-83. [DOI] [PubMed] [Google Scholar]
- 6.Neyroud, N., Tesson, F., Denjoy, I., Leibovici, M., Donger, C., Barhanin, J., Faure, S., Gary, F., Coumel, P., Petit, C.,, et al. (1997) Nat. Genet. 15, 186-189. [DOI] [PubMed] [Google Scholar]
- 7.Lee, M. P., Ravenel, J. D., Hu, R. J., Lustig, L. R., Tomaselli, G., Berger, R. D., Brandenburg, S. A., Litzi, T. J., Bunton, T. E., Limb, C., et al. (2000) J. Clin. Invest. 106, 1447-1455. [DOI] [PMC free article] [PubMed] [Google Scholar]
- 8.Casimiro, M. C., Knollman, B. C., Yamoah, E. N., Nie, L., Vary, J. C., Sirenko, S. G., Greene, A. E., Grinberg, A., Huang, S. P., Ebert, S. N., et al. (2004) Genomics 84, 555-564. [DOI] [PubMed] [Google Scholar]
- 9.Lang, F., Messner, G. & Rehwald, W. (1986) Am. J. Physiol. 250, F953-F962. [DOI] [PubMed] [Google Scholar]
- 10.Lang, F. & Rehwald, W. (1992) Physiol. Rev. 72, 1-32. [DOI] [PubMed] [Google Scholar]
- 11.Heitzmann, D., Grahammer, F., von Hahn, T., Schmitt-Graff, A., Romeo, E., Nitschke, R., Gerlach, U., Lang, H. J., Verrey, F., Barhanin, J., et al. (2004) J. Physiol. (London) 561, 547-557. [DOI] [PMC free article] [PubMed] [Google Scholar]
- 12.Grahammer, F., Herling, A. W., Lang, H. J., Schmitt-Gräff, A., Wittekindt, O., Nitschke, R., Bleich, M., Barhanin, J. & Warth, R. (2001) Gastroenterology 120, 1363-1371. [DOI] [PubMed] [Google Scholar]
- 13.Scarff, K. L., Judd, L. M., Toh, B. H., Gleeson, P. A. & Van Driel, I. R. (1999) Gastroenterology 117, 605-618. [DOI] [PubMed] [Google Scholar]
- 14.Greger, R., Schreiber, R., Mall, M., Wissner, A., Hopf, A., Briel, M., Bleich, M., Warth, R. & Kunzelmann, K. (2001) Pflügers Arch. 443, S3-S7. [DOI] [PubMed] [Google Scholar]
- 15.Schroeder, B. C., Waldegger, S., Fehr, S., Bleich, M., Warth, R., Greger, R. & Jentsch, T. J. (2000) Nature 403, 196-199. [DOI] [PubMed] [Google Scholar]
- 16.Lohrmann, E., Burhoff, I., Nitschke, R. B., Lang, H. J., Mania, D., Englert, H. C., Hropot, M., Warth, R., Rohm, W., Bleich, M., et al. (1995) Pflügers Arch. 429, 517-530. [DOI] [PubMed] [Google Scholar]
- 17.Casimiro, M. C., Knollmann, B. C., Ebert, S. N., Vary, J. C., Jr., Greene, A. E., Franz, M. R., Grinberg, A., Huang, S. P. & Pfeifer, K. (2001) Proc. Natl. Acad. Sci. USA 98, 2526-2531. [DOI] [PMC free article] [PubMed] [Google Scholar]
- 18.Vallon, V. (2003) Nephron Physiol. 94, 1-5. [DOI] [PubMed] [Google Scholar]
- 19.Gerlach, U., Brendel, J., Lang, H. J., Paulus, E. F., Weidmann, K., Bruggemann, A., Busch, A. E., Suessbrich, H., Bleich, M. & Greger, R. (2001) J. Med. Chem. 44, 3831-3837. [DOI] [PubMed] [Google Scholar]
- 20.Kirchhoff, P., Wagner, C. A., Gaetzschmann, F., Radebold, K. & Geibel, J. P. (2003) Am. J. Physiol. 285, G1242-G1248. [DOI] [PubMed] [Google Scholar]
- 21.Roos, A. & Boron, W. F. (1981) Physiol. Rev. 61, 296-434. [DOI] [PubMed] [Google Scholar]
- 22.Grahammer, F., Warth, R., Barhanin, J., Bleich, M. & Hug, M. J. (2001) J. Biol. Chem. 276, 42268-42276. [DOI] [PubMed] [Google Scholar]
- 23.Vallon, V., Richter, K., Heyne, N. & Osswald, H. (1997) Kidney Blood Press. Res. 20, 233-239. [DOI] [PubMed] [Google Scholar]
- 24.Warth, R., Riedemann, N., Bleich, M., Van Driessche, W., Busch, A. E. & Greger, R. (1996) Pflügers Arch. 432, 81-88. [DOI] [PubMed] [Google Scholar]
- 25.Arrighi, I., Bloch-Faure, M., Grahammer, F., Bleich, M., Warth, R., Mengual, R., Drici, M. D., Barhanin, J. & Meneton, P. (2001) Proc. Natl. Acad. Sci. USA 98, 8792-8797. [DOI] [PMC free article] [PubMed] [Google Scholar]
- 26.Ratcliff, R., Evans, M. J., Cuthbert, A. W., MacVinish, L. J., Foster, D., Anderson, J. R. & Colledge, W. H. (1993) Nat. Genet. 4, 35-41. [DOI] [PubMed] [Google Scholar]
- 27.Hamada, E., Nakajima, T., Ota, S., Terano, A., Omata, M., Nakade, S., Mikoshiba, K. & Kurachi, Y. (1993) J. Gen. Physiol. 102, 667-692. [DOI] [PMC free article] [PubMed] [Google Scholar]
- 28.Shao, J. S., Schepp, W. & Alpers, D. H. (1998) Am. J. Physiol. 274, G62-G70. [DOI] [PubMed] [Google Scholar]
- 29.Shao, J., Sartor, R. B., Dial, E., Lichtenberger, L. M., Schepp, W. & Alpers, D. H. (2000) Am. J. Pathol. 157, 1197-1205. [DOI] [PMC free article] [PubMed] [Google Scholar]


