

Abstract
The authors describe the development of a four-dimensional atlas and reference system that includes both macroscopic and microscopic information on structure and function of the human brain in persons between the ages of 18 and 90 years. Given the presumed large but previously unquantified degree of structural and functional variance among normal persons in the human population, the basis for this atlas and reference system is probabilistic. Through the efforts of the International Consortium for Brain Mapping (ICBM), 7,000 subjects will be included in the initial phase of database and atlas development. For each subject, detailed demographic, clinical, behavioral, and imaging information is being collected. In addition, 5,800 subjects will contribute DNA for the purpose of determining genotype– phenotype–behavioral correlations. The process of developing the strategies, algorithms, data collection methods, validation approaches, database structures, and distribution of results is described in this report. Examples of applications of the approach are described for the normal brain in both adults and children as well as in patients with schizophrenia. This project should provide new insights into the relationship between microscopic and macroscopic structure and function in the human brain and should have important implications in basic neuroscience, clinical diagnostics, and cerebral disorders.
Classic atlases of the human brain or the brain of other species have each been derived from a single brain or brains from a very small number of subjects and have employed simple scaling factors to stretch or constrict a given subject's brain to match the atlas. The result has been a rigid and often inflexible system that disregards useful information about morphometric (i.e., dimensionality) and densitometric (i.e., intensity) variability among subjects. This article reviews the rationale for and development of a probabilistic atlas and reference system of the human brain derived from a large population of subjects, representative of the entire species, with retention of information about variability.
The nervous system is unique among human body systems in its spatial and temporal organization. The central nervous system is divided into highly specialized regions that have unique properties in terms of molecules, cell types, connections, and functional systems. The functions of these units vary with time, spanning the gamut from the millennia of evolution to the millisecond choreography of neurophysiologic events. This temporal and spatial specialization is well suited to the application of informatics techniques. In fact, such methods will be required as the basis for beginning to understand and organize the ever-increasing amount of neuroscientific information that is accumulating about this, the most complicated system known. What is ultimately required is a multidimensional database organized with three dimensions in space and one in time along with a seemingly infinite number of attributes referable to these four physical dimensions.
Like geography, neuroscience requires accepted maps, terminologies, coordinate systems, and reference spaces to allow accurate and effective communication within the field and with allied discips. Geographic atlases of the earth have advantages over anatomic atlases. Earth atlases can assume a relatively constant physical reality over thousands of years. On that single, stable construct, an infinite number of abstract representations of features can be overlaid. For earth maps, such features might include rainfall, temperature, population density, or crime rates.
Unlike geographic atlases, anatomic atlases cannot assume a single, constant physical reality. Developers of anatomic atlases must first deal with the fact that a potentially infinite number of physical realities must be modeled to obtain an accurate, probabilistic representation of the entire population. On this anatomic representation, features can then be overlaid in much the same way as for earth atlases.1 In the brain, such features might include, among many others, cytoarchitecture, chemoarchitecture, blood flow distributions, metabolic rates, ligand binding, and behavioral and pathologic correlates. Like earth maps, brain maps can vary in time frames ranging from milliseconds (e.g., electrophysiologic events) to minutes (e.g., skill acquisition), years (e.g., development, maturation, aging), or millennia (i.e., evolution).
Motivation for Developing a Probabilistic Human Brain Atlas
Overall Concept
The goal of the International Consortium for Brain Mapping (ICBM) is to develop a voxel-based, probabilistic atlas of the human brain from a large sample (7,000 subjects total; 5,300 subjects have been collected thus far) of normal persons, aged 18 to 90 years, with a wide ethnic and racial distribution. The data set is designed to contain a substantial amount of demographic information describing the subjects' background, family history, habits, diet, and many other features. The ethnic composition of the final data set will be approximately 2 percent Hispanic/ Latino, 3 percent black, 16 percent Asian, and 79 percent Caucasian. Clinical and behavioral evaluations include neurologic examinations, psychiatric screening, handedness testing, and neuropsychological tasks. Subjects are excluded if they have any history of neuropsychiatric disorders or abnormal findings on physical examination. One cubic millimeter multispectral MRI studies including T1-, T2-, and proton density-weighted pulse sequences are obtained consistently. Functional imaging is also performed on a subset of subjects, using a standardized battery of tasks and employing functional MRI (fMRI), positron emission tomography (PET), and event-related potentials. Samples of DNA will be acquired from 5,800 subjects and made available for genotyping.
From an organizational point of view, eight laboratories in seven countries on three continents participate in the core data collection and analysis. These sites were selected because of their expertise in brain imaging and their capacity to perform a large number of studies in a consistent fashion. In addition, most sites had different imaging devices and computer platforms, thereby requiring the consortium to solve problems of interoperability and differences in data obtained from different acquisition devices.
It was decided early in the planning for the program that, in situations where the optimal solution to a given problem (e.g., data analysis pathway, visualization scheme) was not known, each laboratory would independently try to solve these problems. Once a laboratory-specific solution was obtained, appropriate algorithms would be distributed to consortium participants and evaluated. Ultimately, these algorithms were sent to outside laboratories for independent evaluation and comparison with methods developed by non-consortium groups. In each case, the optimal strategy was then incorporated into the final approach used by the consortium.
This was a “real-world” situation designed to produce the optimal result through competition. As each successful component of these competitions emerged, it was incorporated into the overall ICBM strategy for data analysis, visualization, and distribution. Thus, while each laboratory developed an independent strategy for processing data, the consortium as a whole made the commitment to a unified, centralized strategy for the pooled results, thereby developing a single atlas rather than a federation of atlases. The latter would, in the long run, result in inconsistencies in data analysis and confounding factors for users.
The principles, practices, and tools developed through the ICBM have also spawned a series of other atlas projects on different populations. Probabilistic atlases for children (from birth to age 18 years) and for patients with particular diseases (e.g., Alzheimer's disease, traumatic brain injury, multiple sclerosis, autism, schizophrenia, stuttering, cerebral infarction) are under development. These population- and disease-specific atlases have been developed for different reasons but employ similar principles and many of the same tools as the atlas for the normal adult brain described here.
We also consider a part of this project to be the development of a reference system. The atlas will describe brain structure and function in three spatial domains and a temporal one referenced to the age of the subjects. Attributes (e.g., blood flow, receptor density, behaviors inducing blood flow changes at specific sites, signs and symptoms associated with lesions at specific sites, literature references) are then superimposed on the basic atlas. As such, the atlas becomes the architectural framework for the reference system, the former being grounded in the four physical dimensions and the latter being extensible, depending on the interests of and the data sets available to consortium participants and future users.
We make few assumptions about the relationships between structure and function in the human brain at either a macroscopic or microscopic level, except to state the obvious—that these relationships are complex and poorly understood. Furthermore, we are not proposing that we will be able to unravel this complexity with the data collected in the context of building this atlas. Rather, we will continue to develop a probabilistic framework in which appropriate data sets can be entered, across an ever-increasing number of modalities, between subjects, laboratories, and experiments. This will be done in such a way that, over time, the aggregate data from populations will provide greater insights, in both quality and quantity, into these important relationships.
Our perspective on brain function is typically equated with the methods available to measure it. Tomographic techniques can provide a macroscopic estimate of where gross functional changes (typically of a hemodynamic nature) are occurring. Electromagnetic techniques can provide direct information about when these events occur and indirect information about where. The development of a probabilistic reference system and atlas for the human brain simply provides the framework in which to place these ever-accumulating data sets.
Growth of Neuroscience and Lost Opportunities
The growth of neuroscience in the last 25 years has been extraordinary. Annually, more than 20,000 persons attend the meeting of the Society for Neuroscience in the United States. At that meeting, more than 40,000 papers have been presented in the last 3 years.
Brain mapping and neuroimaging have witnessed a similarly exponential rise in interest, output, and productivity, although at a smaller scale (Figure 1▶). Throughout the neuroscience community, there is a general frustration with the volume of data that are generated and their relative inaccessibility in forms other than narrative text. Consider, for example, that more than 13,000 Society for Neuroscience abstracts are published in hard copy and electronically each year. Faced with such a staggering volume of information, the individual neuroscientist typically retreats to his or her small scientific niche, which results in ever-increasing specialization and isolation within the field. At the same time, funding for neuroscience research has a limited return on its investment, in that only a small fraction of the raw data collected by use of such funds is analyzed fully, and far less is interpreted and published. Even when published, such data are typically in a narrative form that requires arduous comparisons across experiments, methods, and species.
Figure 1.
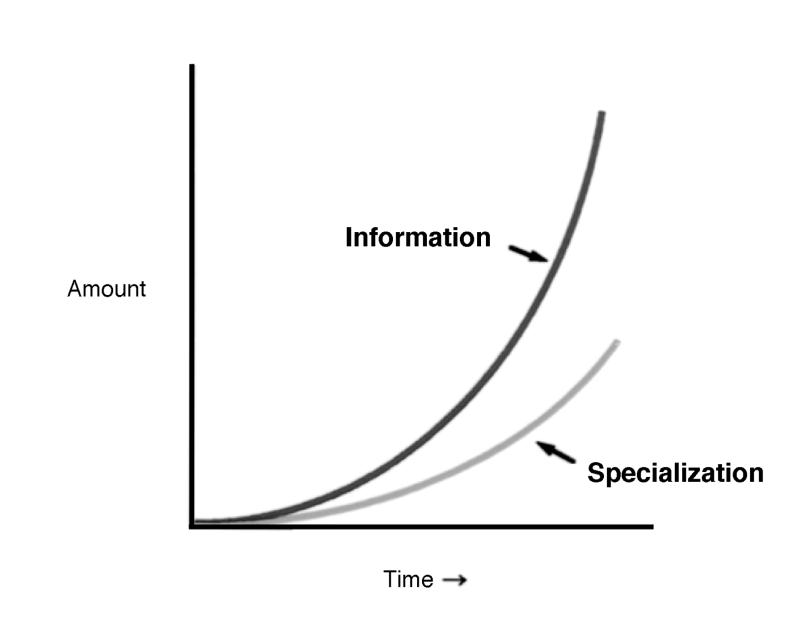
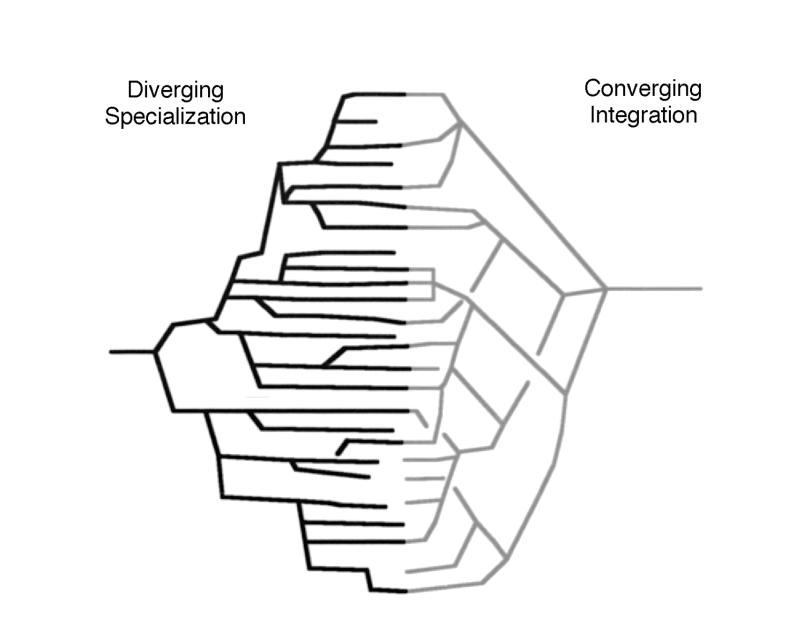
The effect of the rapid growth in neuroscience information on the field. Left, As the amount of information generated by neuroscientists, and human neuroimaging data in particular, increases at exponential rates, so does specialization within the field. Right, Concomitant with specialization is a divergent and isolating trend that generates sub-subspecialty journals, meetings, and opportunities for information exchange. The goal of informatics projects, with the probabilistic human brain atlas as an example, is to integrate information across isolated niches and to provide a convergence of these data sets in a form that allows easy, practical, automated, and quantifiable cross-correlations between information sets using the brain itself as the spatial reference point for location and the age of an individual subject as the time reference. Crosscorrelations between species would require appropriate anatomic homologs to be developed among different species.
To increase the efficiency of neuroscience research, a system is needed to provide a logical and organized means to maintain and distribute data. This requires sophisticated neuroinformatics tools, dedicated scientists committed to the successful completion of such projects in a practical fashion, and a paradigm shift in the sociology of neuroscientists with regard to information sharing.2 Nevertheless, the benefits of such an approach are enormous in themselves and will increase when extrapolated from the current situation to the even greater number of neuroscientists and data sets in the future.
Data Richness
As the quality of neuroscientific data improves, so does its magnitude. As spatial resolution in imaging data changes by one order of magnitude in one dimension, the volume of data points increases by a factor of 1,000. In vivo imaging instruments are now routinely capable of producing 1 mm3 resolution elements, whereas microscopic and ultrastructural studies achieve spatial resolutions 1,000 to 100,000 times better. Given that 50,000 to 75,000 genes code for proteins of relevance to the human nervous system at some point during the life span, the impact of assaying and storing information across a range of spatial resolutions is apparent (Figure 2▶).
Figure 2.
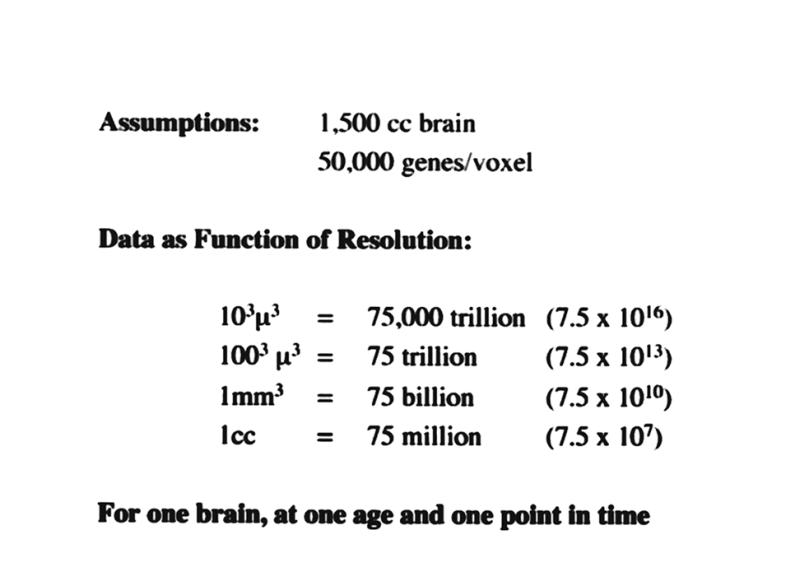
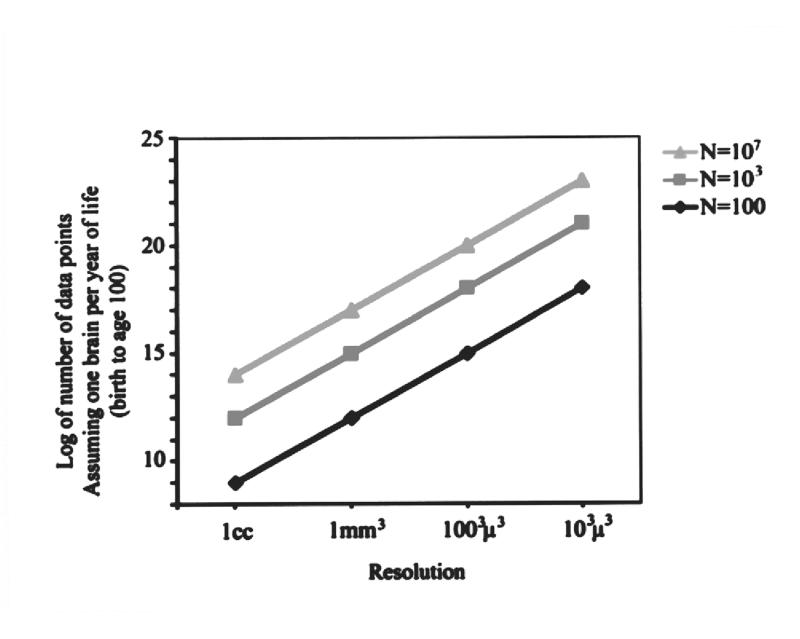
The magnitude of neuroinformatics data for the human brain. Although this illustration is based on a number of assumptions, the orders of magnitude are realistic and enormous. They depict what would be involved in developing an organized data structure that combines location in the human brain with gene expression maps. Left, This example assumes that approximately 50,000 genes may be expressed in any three-dimensional region (voxel) of the brain at any given time during development. The volume of the typical human male brain is 1,500 cc. Depending on the spatial resolution used to determine gene expression (ranging from 1 cc to 103μ3), the number of data points ranges from 75 million to 75 thousand trillion. Keep in mind that this is what is required to do just one brain at a given point in time. Right, If the same assumptions and range of resolutions are used, the range of data magnitudes for a series of brains collected across a population,with a representation of each age from birth to age 100 years, results in data set magnitudes that range from 109 to 1023. These truly astronomic orders of magnitude will require innovative, practical neuroinformatic data structures that allow the referencing of such information as a function of both location and time.
Current and future genomic technology make feasible the ability to generate vast amounts of genetic information (Figure 2▶). All these data are in search of an organizational home referenced to the location of the sample in neuroanatomic terms and the time frame of the sample as a function of the development of the organism. The brain's architecture becomes the most appropriate and intuitively sensitive structure in which to organize such data.
Data Integration
To demonstrate the practical uses of the probabilistic reference system, an example is taken from actual experience, namely, the experiment performed by Watson et al.3 to identify the visual motion area of the human brain (i.e., V5 or MT)4 using relative cerebral blood flow (CBF)5,6 measured with positron emission tomography (PET) (Figure 3▶). In this experiment, multiple PET-CBF studies were performed on each subject in two states—while the subject viewed, first, a stationary pattern of targets and, second, moving targets. The significant difference between the data sets collected in these two states10 was then superimposed on MRI data using the automated image registration algorithm for within- and between-subject data set registration.11,12
Figure 3 .
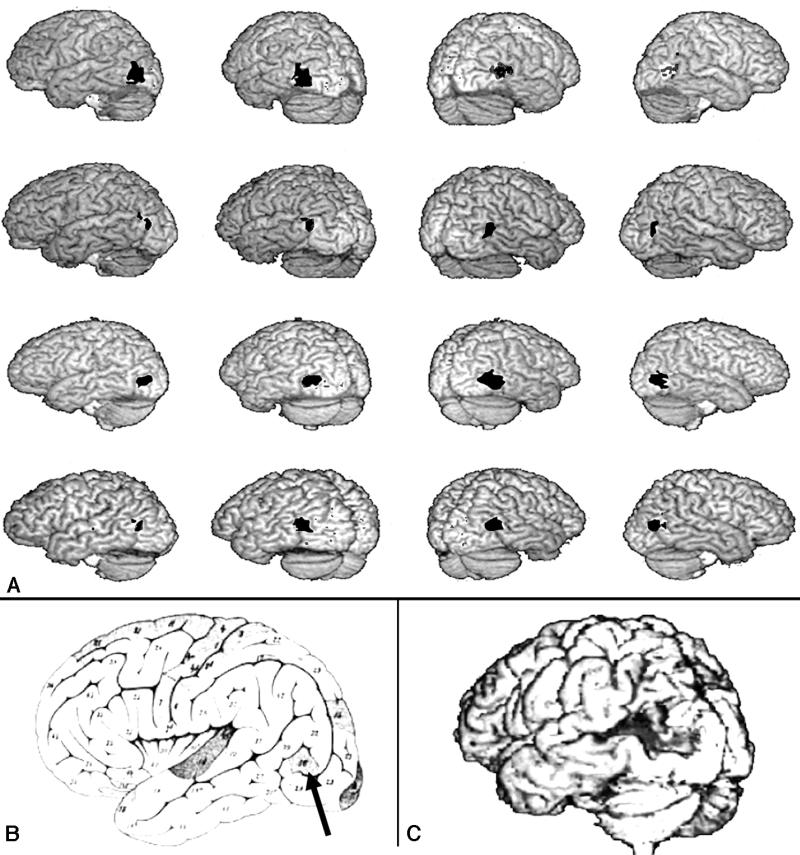
Human visual area V5. A, Bilateral PET-CBF (positron emission tomography–cerebral blood flow) images showing activation of V5 in four separate subjects. The V5 images are superimposed on the subjects' structural MRI studies.3 Notice the consistent relationship between the activated site and the ascending limb of the inferior temporal sulcus. (The activated sites are shown here in black, for visibility, but are apparent as shades of red on the original published images.) B, This area also coincides with the cortical region (arrow) identified by Flechsig in 19207 as being myelinated at birth. (A and B are reprinted, with permission, from Watson JD, Myers R, Frackowiak RS, et al. Area V5 of the human brain from a combined study using positron emission tomography and magnetic resonance imaging. Cereb Cortex. 1993;3:79–94. Copyright © 1993 Oxford University Press.) C, Brain of patient studied by Zihl et al.,8,9 with damage to the V5 area resulting in a selective disturbance of visual motion perception.
This experiment demonstrated the consistent bilateral activations of the dorsolateral inferior occipital cortex in each subject. Furthermore, a consistent relationship between the site of increased blood flow and the frequently occurring ascending limb of the inferior temporal sulcus was found (Figure 3▶A).13 Because the investigators were knowledgeable about occipito-temporal anatomy and physiology, they recognized that this location had also been identified by Flechsig7 as a portion of the human cerebral cortex (Flechsig Feld 16) that is myelinated at birth (Figure 3▶B).14 These observations have been repeatedly confirmed by independent laboratories, demonstrating the human V5 areas as a consistent and robust functional landmark in the occipito-temporal junction.15
A more efficient approach could be taken using neuroinformatics tools previously developed or proposed for the probabilistic reference system. Prior to performing the V5 PET experiment, each subject would perform a functional reference battery of tasks, thereby providing functional landmarks throughout the brain. This is a standardized set of tasks that subjects perform and that provide functional landmarks for cortical, subcortical, and cerebellar sites obtained with functional MRI or PET imaging.
Following the experiment, anatomic warping and segmentation tools would be used to automatically segment and label the anatomic regions of the brain for each subject. Alignment and registration by functional landmarks would show the effects of functional registration on macroscopic anatomy. Functional alignment and registration using the V5 activation sites would automatically demonstrate the frequently occurring relationship between that functional region and the ascending limb of the inferior temporal gyrus.
Furthermore, it would quantitate, in probabilistic terms, the spatial relationships between the sulcal/gyral anatomy and the functionally activated zone across subjects. Differences in responses could be related to demographic, clinical, and genotypic16,17 information, if this were collected as part of the experiment, and related to population data already available in the four-dimensional database. Cyto- and chemoarchitectural data, as they begin to populate the database, would be available for automated reference with regard to this cortical zone.18,19 Time-series data from EEG or MEG studies would show the temporal relationships between this region and others.20,21 Lesion data could also be accessed if such data sets had been added as an attribute (Figure 3▶C).8 This is in contrast to the current situation, in which, for a given neuroscientific question, activated cortical regions are identified and the literature must be laboriously searched to identify qualitatively—in experiments with different characteristics, qualities, and attributes—the regions of the brain that are of experimental interest.
Historical Development of Methods for Human Brain Mapping
The first true localization of brain function was Pierre Paul Broca's identification of the language area in a patient with damage to the left anterior sylvian cortex, which represents the most celebrated example of ascribing a behavioral function, namely, language output, to a cerebral site.22 Localizationism flourished throughout the late 19th century through the study of patients with selective lesions, and continues to this day.23–25 Concomitantly, anatomists produced maps of ever-increasing complexity and detail about brain structure.26–28 Modern localization is now expressed in terms of distributed large-scale neural networks rather than isolated brain regions.29,30
The application of Kety-Schmidt tracer kinetic techniques31 to externally detected distributions of radioactive xenon, pioneered by Scandinavian workers in the late 1950s and 1960s, provided the first glimpse of cortical responses of cerebral blood flow in normal subjects and patients performing a wide variety of tasks.32,33 The regional, and largely cortical, application of tracer kinetic techniques from these studies was quickly applied, by use of a broad range of radiopharmaceuticals, to the emission computed tomographic methods of SPECT (single photon emission computed tomography)34 and PET,35 revealing for the first time the complex macroscopic neuronal networks associated with normal behavior and disease states.36
In the early 1990s, the exquisite structural anatomy and high spatial resolution of magnetic resonance imaging (MRI) was extended to the measurement of physiologic events with both high spatial and temporal resolution.37 Furthermore, the related technique of magnetic resonance spectroscopy (MRS) provides information about the chemical state of the human brain, although with much lower spatial and temporal resolution.38 The potential scope of methods based on the principle of nuclear magnetic resonance is still largely unexplored.39
The realization that the integration of information from a variety of methods would provide the most comprehensive data set, with complementary features optimizing spatial and temporal resolution as well as sampling, resulted in the development of methods to combine different data sets.12 The need for a common means of communication within the subdiscips of neuroscience40 and the lack of a standardized coordinate system and population atlas emerged as major limitations in comparisons of these complex data sets between subjects, populations, and laboratories.
Strategy and Rationale
Probabilistic Framework
Since no single, unique physical representation for the human brain is representative of the entire species, the variance must be captured in an appropriate framework. The framework that we have chosen is a probabilistic one in which the inter-subject variability is captured as a multidimensional distribution. Accessing data from the resulting atlas will produce a probability estimate of structure and function based on the distribution of samples obtained. These probabilities can change if subpopulations are sampled because of the shifting distributions.
The probabilistic approach was relatively new to neuroanatomic thinking when we first proposed it in 1992. Previous strategies dealt with postmortem analyses that reporting distributions for structure sizes and dimensions for select brain regions.41 In recent years, the probabilistic strategy has been more widely used.42–45
Neuroanatomy as the Language of Neuroscience
Many Nomenclatures
The basic language of neuroscience is neuroanatomy. However, as with any global topic, many languages and dialects exist. The ultimate solution to the development of a useable brain atlas requires, like air traffic control systems, location references expressed as coordinates and a common language in which to express them. (For air traffic control, the common language is English.) In developing the probabilistic atlas, it was our intention to accommodate multiple languages and meanings. It was, therefore, important to build a hierarchic nomenclature system in which aliases could be referenced and the boundaries to which they referred adjusted on the basis of the language selected. This required a nomenclature editing system (BrainTree, as discussed below) and an approach that ultimately allows translation from one neuroanatomic language to another without the requirement that all investigators use a single, arbitrarily chosen language. The solution clearly requires a coordinate-based approach devoid of many of the ambiguities associated with qualitative naming of structures.
BrainTree
BrainTree is a system we developed that provides a graphic relationship between anatomic nomenclature and the structures or systems to which named items belong.46 BrainTree relies on a two-coordinate bounding box for each node, producing a defined region of three-dimensional space that entirely encompasses the named structure. The user can select a structure on the basis of its standard nomenclature and have its coordinates passed to a standard display or to measurement tools. Hence, the BrainTree program provides a facile interface between an editable hierarchic nomenclature system and the indexable three-dimensional coordinate space. Furthermore, the nomenclature can easily be extended to include the myriad aliases that are common in neuroanatomy and can even relate the structural names that provide associations between species.46
Use of a Large Population
Critical in the development of this project was the need for much larger populations of subjects than had previously been available. The current program is now intended to include 7,000 normal subjects from geographic locations as disparate as Japan and Scandinavia, whose ages range from 18 to 90 years. Special efforts have been made to obtain broad racial and ethnic diversity. In addition, 342 twin pairs (half monozygotic and half dizygotic) are also part of this sample. The data set for each subject includes a detailed description of medical, developmental, psychological, educational, and other demographic features. In addition, behavioral data including findings from neurologic, neuropsychological, and neuropsychiatric examinations are part of the base data set. Samples of DNA from 5,800 subjects are being collected, stored, and made available for genotyping. (Samples of DNA could not be collected from the remaining 1,200 subjects because of Institutional Review Board regulations in their home countries.) The large sample size also increases statistical power in making inferences about the population and in using the atlas as a comparison sample for investigations involving other groups, be they normal or pathologic.
Genetics
The inclusion of genetic information about the individual subjects studied to produce the probabilistic atlas was essential and fundamental to the rationale of the program. It would have been narrow-minded to collect such a vast amount of costly imaging and behavioral information from such a large number of subjects without the concomitant ability to reference such information to individual genotypes. In fact, an early goal of the program was to have a robust means of linking the macroscopic, in vivo imaging data to information obtained at a molecular level, thereby allowing true phenotype–genotype relationships to be explored. The organization of the data, particularly the segmented neuroanatomic information, also provides a very efficient and cost-effective way of exploring the effect of candidate genes on the phenotypic organization of the adult human brain.
Alzheimer's disease is a major looming public health problem in the United States and other developed countries and serves as a good example of how the phenotype–genotype reference system can be used. Evidence47–52 supports the notion that hippocampal atrophy can be used as a preclinical surrogate for Alzheimer's disease. The genotype Apo E ɛ4 is associated with a higher risk (relative to persons with the genotype Apo E ɛ2 or ɛ3) for developing Alzheimer's disease, and incidence varies with race (Table 1▶).47 Existing studies do not, however, provide sufficiently conclusive or detailed results to serve in the design of clinical trials using this surrogate to evaluate the efficacy of preclinical interventions.
Table 1 ▪ .
Distribution of the Apolipoprotein E ɛ4 Allele as a Function of Race in the U.S. Population, for Normal Subjects (Controls) and Patients with Alzheimer's Disease47
| ɛ4 Homozygotes (%) | ɛ4 Heterozygotes (%) | ɛ4 Allele Frequency (%) | |
|---|---|---|---|
| Caucasian: | |||
| Controls | 1.8 | 23.9 | 13.7 |
| Alzheimer's | 14.8 | 43.7 | 36.7 |
| African American: | |||
| Controls | 2.1 | 33.94 | 19 |
| Alzheimer's | 12.3 | 40 | 32.2 |
| Hispanic: | |||
| Controls | 1.9 | 18.4 | 11 |
| Alzheimer's | 2.7 | 33 | 19.2 |
| Japanese: | |||
| Controls | 0.8 | 16.3 | 8.9 |
| Alzheimer's | 8.9 | 37.8 | 27.8 |
An efficient way of addressing this issue can be envisioned using the probabilistic atlas. With more than 4,200 subjects in the seventh and eighth decades of life, the probabilistic database should include at least 800 Apo E ɛ4 carriers among whom preclinical hippocampal atrophy due to Alzheimer's disease might be expected to be prevalent. Similar evaluation of the nearly 1,700 subjects under 50 years of age would provide an important cross-check to verify that Apo E ɛ4 is not associated with subjects' having constitutively smaller hippocampi throughout life. With this strategy, even a random subsample of the database population would probably suffice to clarify the discrepant published results.
The second strategy, made uniquely possible by the existence of the proposed data base, would be to limit Apo E typing to those persons with the smallest hippocampal volumes and to a group of appropriately matched controls with hippocampal volumes near the mean. This strategy is made possible by the fact that the MRI scans will already have been performed and automatically segmented (Figure 4▶). If it is true that reduced hippocampal volumes reflect presymptomatic Alzheimer's disease, then the frequency of Apo E ɛ4 should be higher among subjects with small hippocampi, just as it is higher among those with Alzheimer's disease. Indeed, in one scenario, all subjects with adjusted hippocampal volumes below a certain percentile might be developing symptomatic Alzheimer's disease, so that the frequency of Apo E ɛ4 in this population might approach the frequency in symptomatic Alzheimer 's disease populations. By starting with subjects who have the smallest hippocampal volumes and using appropriate statistical procedures to evaluate the number of excess Apo E ɛ4 alleles as testing proceeded, the amount of required Apo E testing could be minimized (Figure 4▶). In addition to being highly cost effective, such an approach directly addresses the issue of importance for future clinical trials—namely, for a given range of reduced hippocampal volumes, what is the extent to which the reduction can be attributed to preclinical Alzheimer's disease as a function of age?
Figure 4 .
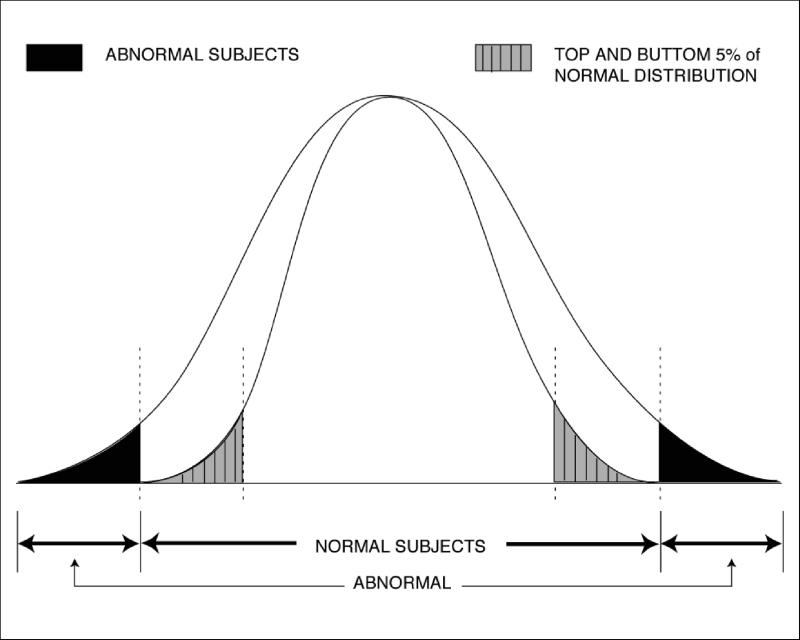
Strategy for use of morphometric data in a phenotype–genotype experiment. If this distribution were for hippocampal volume, for example, candidate genes for hippocampal size (e.g., Apo E ɛ2, ɛ3, and ɛ4 alleles) could be tested against human imaging data. Human heritability can be evaluated with human twin data collected in this project. Then, extremes (e.g., the top and bottom 5 percent) of hippocampal volumes could be assessed against the candidate genes for the effect they exert on human hippocampal volume. For example, hippocampal atrophy is invariably found in Alzheimer's disease. Patients with Alzheimer's disease also have a higher probability of the genotype Apo E ɛ4 (vs. ɛ2 or ɛ3). Whether 20- to 40-year-olds have a correlation between hippocampal volume and the Apo E genotype could be determined by use of atlas data in this fashion.
The third strategy involves the use of twins. Since previous studies employed case-controlled approaches, there is no control for the possible confounding effect of population stratification. The inclusion in the database of dizygotic twins (and other family members) should make it possible to explore whether this association can be observed within families (e.g., in discordant sibling pairs), thereby excluding the possibility of population stratification.
Target and Reference Brains
A fundamental concept of our consortium's project was to distinguish between target and reference brains. We have defined the target brain to be the data set, derived from one or, at best, a few individual subjects, that has the richest collection of data available. Theoretically, this would be the brain of a normal subject studied with in vivo, high-resolution, structural and functional imaging and then, after death, with detailed postmortem analysis including cyto- and chemoarchitecture studies. If a series of such brains could be studied, then a probabilistic target brain would emerge. Given the high resolution of the postmortem data, target brains would be the most informative with regard to anatomic and chemical localizations. Although we have studied a few subjects (all elderly) for whom data from both in vivo macroscopic brain imaging and, through the UCLA Willed Body Program, postmortem cryosectioning were available, we typically do not have both in vivo and postmortem data sets for the same subject. Because of this, synthesis of this information, from different subjects, into an optimized target brain has been the practical solution to date.
In contrast to the target brain, reference brains are derived from large populations, typically through in vivo imaging of structure and function. These data sets provide information about variance in the population for both structure and function but at a three-dimensional spatial resolution that is three orders of magnitude lower than that of the target brains.
Target and reference brains are used for different purposes. Target brains provide, as the name implies, the target to which an unlabeled data set can be warped. The unlabeled data set then picks up the anatomic, functional, or other attributes of each voxel. Once it is back-transformed to its original shape, the new data set has the appropriate anatomic and functional labels for all brain regions. A certain percentage of these labels will be erroneous because of imperfections of the warping system, incomplete understanding of the anatomy of homologous brain regions among subjects, and errors in the primary labeling of the target brain.
Reference brains provide data about distributions of brain regions and can be divided into subpopulations for specific purposes. Reference brains give estimates of anatomic and functional regions in a population of subjects and can thus be used to determine confidence limits when a new data set falls outside the range of normality or expected variance for a given population. Taken together, these two tools provide important but very different vehicles for analyzing existing and new data sets with regard to brain structure and function.
Database
Four Dimensions
There is currently no comprehensive database for the storage of complete individual-subject neuroimaging data sets for the human brain, that can be accessed electronically and in an interactive, efficient, and simple manner. Such a system would increase the value of both clinical and research dollars spent on the acquisition of these important and costly studies. The physical world is organized in four dimensions and thus forms a logical and comprehensive organizational framework for the ICBM database. Plans anticipate the future inclusion of time-series data from dynamic, functional data acquisition methods such as fMRI, EEG, and MEG, requiring the fourth dimension.
With this data structure, query-by-content tools and strategies are being developed. These tools will allow users of the database to submit queries in the form of actual data (e.g., a two-dimensional image of a portion of the brain or a three-dimensional block of data) and ask the database to search for matches using wavelet-based techniques that have been shown to be successful for two-dimensional Internet searches of graphic material.53 The expansion of these approaches to three and, eventually, four dimensions will be an important neuroinformatics milestone, and their use will extend far beyond the applications of this consortium.
A system organized in this fashion and the tools associated with it will also allow for efficient, convenient, and comprehensive access by neuroscience clients to the ever-growing data in the ICBM probabilistic reference system. The goal is not to develop physiologic models of brain function, neural connectivity, and other important neurobiological questions. But these exciting opportunities will be more easily achieved by providing a system of database interactions and structure for modelers, neuroimagers, and neuroscientists in general. Such a system will allow “electronic” hypothesis generation and experimentation using previously collected, well-described, and effectively organized data.
Attributes
The database architecture, while organized in four dimensions to match the organization of the nervous system, can have a very high number of attributes referenced to these four dimensions. Additional attributes need not be specified at the time a data sample or the data set is established. Some can be derived, and others can be added later by further examination of the original subjects (e.g., longitudinal studies or other methodologies) or by further analysis of existing data (e.g., genotyping of stored DNA samples).
The most difficult challenge in the actual organization of such a database is the scaling and referencing of data across major spatial or temporal domains. Although the data set was originally developed to have a fundamental spatial unit of resolution of 1 mm3, there is no reason why microscopic and ultrastructural information cannot appropriately populate the individual 1 mm3 voxels of the macroscopic data set. The same can be said of temporal information, but the exact manner of binning time-series information will require judicious attention to the types of queries anticipated of such data sets.
Real-world Environment
The ICBM consortium has always maintained a “real- world” environment in that the participating sites use different equipment, software, and protocols. This reflects, in microcosm, the larger neuroscience, neuroimaging, and neuroinformatics communities and motivates the members of the consortium to develop solutions to problems through flexible, compatible systems rather than rigid standards, protocols, and equipment requirements. The significance of this feature is that the products are not platform-, institution-, or protocol-specific.
Interoperability
Interoperability was an important concern early in the development of the ICBM atlas. So important was the requirement to develop interoperable tools and data sets that a conscious decision was made for participating sites to use different imaging instruments, computing hardware, and file formats. This decision forced certain principles and rules to be used in the development of software and the exchange of data, the goal being the accessibility of all these products by any end user.
Given the behavior of and limitations on investigators in any advanced research field, the inclination is to develop homemade tools and maintain intralaboratory file structures. The experience in the ICBM consortium was no different. Thus, translators were developed that would allow data sets to be transferred between sites in an agreed-on file format (MINC)54 that was, in turn, translated into the “home” file format on receipt at any participating site. A similar strategy was used for algorithms. This simplistic approach has actually worked quite well, allowing a relatively seamless exchange of information.
Quality Control
If the ICBM atlas is to be a growing resource, tools that have been developed thus far will ultimately be open to the entire neuroscientific community for the future additions of data sets. How then will we ensure the quality of data received from investigators?
Having pondered and debated this question for many years and having examined the approaches used in other fields, we find the simple answer is that we cannot ensure a certain level of quality control in a completely open data exchange program. Not only is this impractical, but it may lead to the erroneous exclusion of data that might someday be deemed valuable. If there were some filter on the input of data, what would the review process be? How can we predict how tomorrow's observations will be judged by today's standards? We cannot. Furthermore, in a practical sense, such an approach would immediately become backlogged with data sets awaiting “review” by some “panel of experts” whose opinions might change as time and experience progresses.
What we can provide, however, is a system by which users of such data sets can select their own level of confidence about the populations or results that they sample. For example, a user might request all information about a certain region of the brain for a given demographic population of subjects. Most of this data would be of high quality and reliably collected, but some of it would undoubtedly include experimental, methodological, and other errors. Nevertheless, it would give the user a complete picture of all the information available about their query.
At the other end of the spectrum, consider a user who is interested in only the most accurate information about a given site in the brain for a certain population. That user could request data that were obtained only from the results of peer-reviewed, published, and independently reproduced studies. Thus, just as the data sets can be filtered using demographic, anatomic, and clinical criteria, they can also be filtered and queried by confidence level. “Let the user beware” is the only rational approach to developing such a system.
Methods
At the outset of this project, it was unclear what the optimal analysis strategy would be for both the structural and functional aspect of the program. Given the large number of subjects, each with multispectral MRI data sets and many with functional imaging studies as well, it was clear that the tools to be developed would have to function in an automated, or at least semi-automated, fashion to be feasible. Furthermore, reliable automaticity would be a general benefit to the brain imaging field, given the labor-intensive aspects of manual image editing.
It was also clear that certain steps would be required to process data in what we have called an ICBM “analysis pipe.” These steps include:
Screening of data for obviously incomplete or artifact-laden studies, and rejection of such studies
Intensity normalization in three dimensions for each pulse sequence
Alignment and registration across pulse sequences and studies within a given subject
Tissue classification—e.g., matter (GM), white matter (WM), and cerebrospinal fluid (CSF)
“Scalping,” whereby extracerebral structures (i.e., scalp, skull, meninges) are removed
Spatial normalization of each subject to a target whereby anatomic labels can be obtained automatically
Surface feature extraction
Visualization
Given this sequence of tasks, it was unclear, in most cases, what the optimal solution for each would be. Rather than making an a priori decision and having all consortium members work to achieve it, an alternative approach was chosen. It was decided that each primary laboratory in the consortium would work to solve each step in the analysis pipe independently and in parallel. These laboratory-specific algorithms would then be locally optimized. Once a given laboratory was satisfied with the performance and documentation of their approach, it would be distributed to the other participating laboratories for alpha testing. If an algorithm failed to perform adequately or was awkward to use because of hardware platform incompatibilities or other factors, it was rejected.
Those algorithms that performed well across consortium laboratories were ultimately sent to an independent group (David Rottenberg, MD, Stephen Strother, PhD, and colleagues at the University of Minnesota) for beta testing. This independent testing included not only the ICBM algorithms for a given module in the analysis pipe but also any other algorithms identified worldwide that were purported to perform the same functions.
During beta testing, algorithms were evaluated with simulated as well as real data sets selected by the beta test laboratory and evaluated for documentation, ease of installation, computation time, accuracy, and precision. The results of these evaluations were then published.55,56 The winners of this competition were then selected for the ICBM analysis pipe and will be the basis for the mass data analysis of all data sets.
Although it was important to analyze all 7,000 studies in a consistent manner so that users would know the methodology, algorithms, and versions of the algorithms from which the results were derived, this in no way precluded individual laboratories in the ICBM consortium or elsewhere from using their own strategies for data analysis on the original data sets, which are provided through digital libraries (see below). This strategy has been successful in that it established an internal competition whereby the best solution emerged, rather than an a priori and hypothetical prediction that might have fallen far short of the optimal outcome.
Magnetic Resonance Imaging
Multispectral anatomic MRI data for the ICBM project were acquired using optimized protocols matched as closely as possible across the different scanner manufacturers and field strengths (3.0 T GE, 1.5 T Philips, and 2 T Elscint). The protocol design goals were to achieve whole-head 1 mm isotropic T1-weighted image volumes and whole-head 1 x 1 x 2 mm T2- and PD-weighted volumes. This strategy was chosen to optimize automated tissue classification and segmentation approaches using high-resolution, multispectral data. In addition, selected studies were subjected to intrasubject registration for post hoc magnetic resonance signal averaging57 to increase signal-to-noise ratio.
Postmortem Cryosectioned Material
Data Acquisition
Any effort to map the human brain and its functions requires a comprehensive anatomic framework. The full representation of brain structure has presented a challenge since the early efforts of Vesalius.58 Recent advances in anatomic digital imaging techniques now permit unrestricted visualization in multiple cut planes and three-dimensional regional or subregional analyses when appropriate primary data sets are available.59,60 Digital representations also provide the opportunity for morphometric comparisons and sophisticated mapping between anatomic and metabolic imaging modalities.61,62
The convergence of digital techniques and quantitative atlasing is only now beginning to occur. The absence of very high resolution, morphologically detailed source data has impeded realization of the full potential of the many rapid improvements in digital human brain representation and visualization. The primary source data for human brain atlasing must include not only very fine spatial detail but also image color and texture to convey the subtle characteristics that make it possible to distinguish subnuclear and laminar differences. In addition, the incorporation of an appropriate spatial coordinate system is critical as a framework for inter-subject morphometrics. High-resolution anatomic data sets serve as references for the accurate interpretation of clinical data from the PET, CT, and MRI modalities as well as for the mapping of transmitters, their receptors (Figure 5▶), and other regional biological characteristics.
Figure 5.
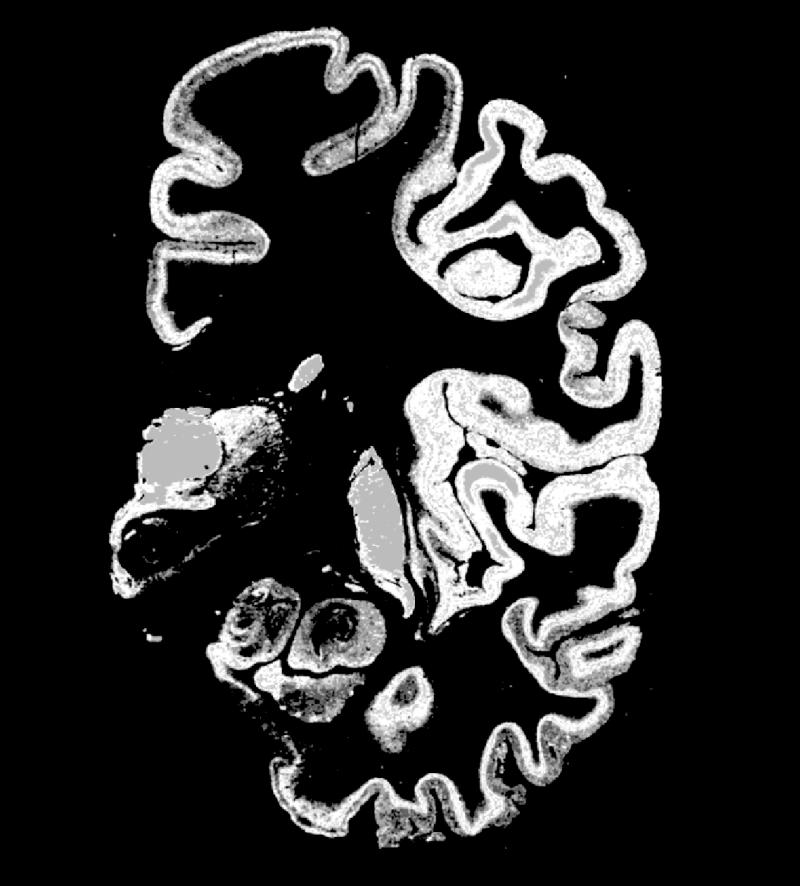
Coronal image showing muscarinic receptors labeled with a tritiated ligand from one hemisphere of a cryosectioned brain and showing the anatomic detail that such chemoarchitectural maps can provide. When serial sections are obtained and stained for a wide range of receptors, anatomic features, and gene expression maps, a tremendous wealth of information is available for comparison with sites of functional activation obtained using in vivo techniques and macroscopic brain structure (gyri, sulci, deep nuclei, white matter tracts). Having a probabilistic strategy for relating these different types of anatomic features will provide new insights into the relationship of structure and function on both microscopic and macroscopic levels for the human brain and, by analogy, the brains of other species. The analysis of the regional and laminar distribution patterns of transmitter receptors is a powerful tool for revealing the architectonic organization of the human cerebral cortex.
The authors succeeded in preparing extra-large serial cryostat sections through an unfixed and deep-frozen human hemisphere. Neighboring sections were incubated with tritiated ligands for the demonstration of 15 different receptors of all classical transmitter systems; this image shows, as an example, the distribution of [3H]oxotremorine-M binding to chorgic muscarinic M2 receptors. Receptor autoradiographs permit the distinction of numerous borders of cortical areas and subcortical nuclei by localized changes in receptor density and regional/laminar patterns. For example, the M2 receptor subtype clearly labels the primary sensory cortices (at the level of the section shown in the figure, e.g., the primary somatosensory area BA3b and the primary auditory area BA41) by very high receptor densities sharply restricted to both areas. The different receptors allow the multimodal molecular characterization of each area or nucleus by the so-called receptor fingerprint typing. A receptor fingerprint of a brain region consists of a polar plot based on the mean density of each receptor in the same architectonic unit (area, nucleus, layer, module, striosome, etc.). The following areas and nuclei can be delineated in the present example—cingulate cortex, motor cortex, primary somatosensory cortex, inferior parietal cortex, insular cortex, primary auditory cortex (BA41), non-primary auditory cortex, inferior temporal association cortex, entorhinal cortex, mediodorsal thalamic nucleus, and putamen. (K. Zilles , A. Toga, N. Palomero-Gallagher, and J. Mazziotta, unpublished observation.)
We designed a system of histologic and digital processing protocols for the acquisition of high-resolution digital imagery from postmortem cryosectioned whole human brain and head, for computer-based, three-dimensional representation and visualization.63,64 Collection of 1,0242 images from whole brains results in a spatial resolution of 200 μ/pixel in a 1- to 3-gigabyte data space. Even higher three-dimensional spatial resolution is possible by primary image capture of selected regions, such as hippocampus or brainstem, or by use of higher resolution cameras. Discrete registration errors can be corrected using image processing strategies such as cross-correlative and other algorithmic approaches. Data sets are amenable to resampling in multiple planes as well as scaling and transpositioning into standard coordinate systems. These methods enable quantitative measurements for comparison between subjects or for the atlasing of data at resolutions far higher than those available through in vivo imaging technologies.
The use of cryosectioned anatomic images as a gold standard for mapping the human brain requires a complete understanding of the assumptions and errors introduced by this method. Although the use of these data as a reference for other tomographic and in vivo mappings has several obvious advantages, their collection requires sophisticated instrumentation and representative postmortem material. Spatial resolution, the inclusion of bony anatomic features, full color, blockface reference for histologically stained sections, and the resulting registered three-dimensional volumetric data sets are important features of this method. Nevertheless, cryosectioning approaches, like all others, introduce distortion during acquisition and processing. The major source of error is related to specimen preparation prior to sectioning. Removal of the cranium and subsequent brain deformation, perfusion protocols, and freezing may alter the spatial configuration of the data set.
Although three-dimensional data at this resolution are difficult to acquire, they are necessary for careful studies of morphometric variability and for the generation of comprehensive digital neuroanatomic atlases. Ultimately, what is needed is the use of data acquired from cryosectioned material, as the source of higher-resolution raw and stained anatomic images, spatially referenced to an in vivo, electronically acquired data set like that provided by MR images.
Cytoarchitecture and Chemoarchitecture
A major effort in this project is to obtain cyto- and chemoarchitectural data from postmortem brains to enter into the probabilistic database for comparison with findings from in vivo studies. An example of this approach is described for Broca's area. The putative anatomic correlates of Broca's speech region, i.e., Brodmann's areas 44 and 45,27 are of considerable interest in functional imaging studies of language. A long-standing matter for discussion is whether anatomic features are associated with the functional lateralization of speech.65–70 Furthermore, the precise position and extent of both areas in stereotaxic space and their inter-subject variability remain to be analyzed, since Brodmann's deation is highly schematic, has not been documented in sufficient detail, and does not contain any statement about inter-subject variability.
We studied the cytoarchitecture of Brodmann's areas 44 and 45 in 10 human postmortem brains using cell body–stained71 20-μm-thick serial sections through complete brains.72 Cytoarchitectonic borders of both areas were defined using an observer-independent approach, which is based on the automated high-resolution analysis of the packing density of cell bodies (grey level index, or GLI) from the border between layers I and II to the cortex–WM border.73 These profiles are perpendicular to the cortical surface and define the laminar pattern of cell bodies. Thus, the profiles are a quantitative expression of the most important cytoarchitectonic feature. Multivariate statistical analysis was used for locating significant differences between the shapes of adjacent GLI profiles along the cortical extent. Those locations represent cytoarchitectonic borders. The GLI profiles were also used to investigate inter-hemispheric differences in cytoarchitecture. Significant inter-hemispheric differences in cytoarchitecture (i.e., differences in GLI profiles between right and left areas) were found in both areas 44 and 45. Profiles obtained as internal controls from the neighboring ventral premotor cortex did not show any lateralization.
The position of the borders of areas 44 and 45 with respect to sulci and gyri showed a high degree of inter-subject variability (Plate 1▶). This concerned the sulcal pattern, specifically, the presence, course, and depths of sulci as well as the spatial relation of areal borders with these sulci. The position of a cytoarchitectonic border could vary up to 1.5cm with respect to the bottom of one and the same sulcus in different brains. Thus, sulci and gyri are not reliable and precise markers of cytoarchitectonic borders.
Plate 1 .
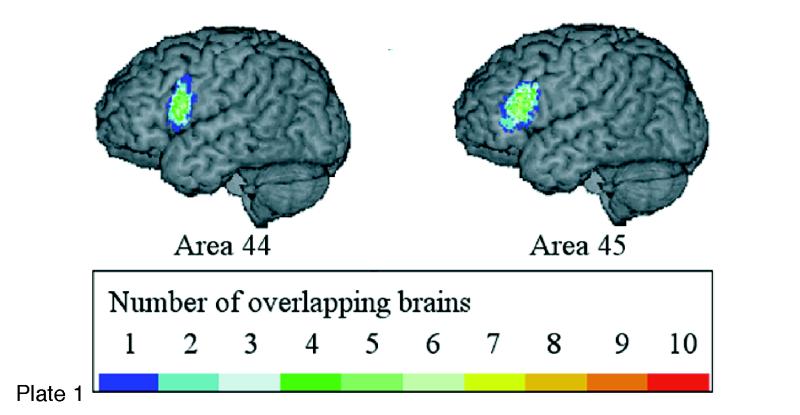
(Opposite, top) Location and extent of Broca's region (Brodmann's areas 44 and 45), as defined in serial coronal sections of an individual brain after three-dimensional reconstruction; lateral views of the left hemisphere are shown. Probability maps of Broca's region, based on microscopic analysis of ten human brains, can be referenced, also in a probabilistic fashion, to functional activation sites associated with the functions of Broca's area, using the multimodality probabilistic atlas strategy. The overlap of individual postmortem brains is color-coded for each voxel of the reference brain (color bar); for example, seven of ten brains overlapped in the yellow-marked voxels.
Although there was a considerable inter-subject variability in volume of areas 44 and 45 (n = 10), area 44 was larger on the left side than on the right in all cases of our sample. We could not find any significant left–right differences in the volume of area 45.
The extent and position of areas 44 and 45 were analyzed in the three-dimensional space of the standard reference brain of the European Computerized Human Brain Database42 after the microstructural definition of the areal borders. Magnetic resonance imaging (3-D FLASH-scan, Siemens 1.5 T Magnet) was performed on postmortem brains prior to histologic studies. Corrections of deformations inevitably caused by the histologic technique were performed by matching MRI and corresponding histologic volumes.74,75 Brain volumes were finally transformed to the spatial format of the reference brain. For both steps, a movement model for large deformations was applied.76–78 The superimposition of individual cytoarchitectonic areas in the standard reference format resulted in probability maps (Plate 1▶). These maps quantitatively describe the degree of inter-subject variability in extent and position of both areas. They serve as a basis for topographic interpretations of functional imaging data obtained in PET and fMRI experiments.79 The observed inter-subject variability in the extent and cytoarchitecture of Broca's region has to be considered when data of functional imaging studies are correlated with the underlying cortical structures. Inter-hemispheric differences in the volume of area 44 and in the cytoarchitecture of both areas may contribute to functional lateralization, which is associated with Broca's region.
Segmentation
Correction for Non-uniformity of Three-dimensional Intensity—N3
A major problem for automated MRI image segmentation is the slowly varying change in signal intensity over the image, caused principally by non-uniformities in the radiofrequency field. Apparent signal from any one tissue type is therefore different from one brain area to another, confusing automated segmentation algorithms that assume constant signal for one tissue type. We have developed a fully automated three-dimensional technique for the correction of inhomogeneity. The method maximizes the entropy of the intensity histogram to maximize its structure. The method is applicable to any pulse sequence, field strength, and scanner.80,81
Tissue Classification—INSECT
We have developed a series of algorithms for tissue classification.82–84 These have been implemented as part of a pipe for automatic processing of multi-spectral (T1-, T2-, proton density (PD)–weighted) data sets from large numbers of subjects, known as INSECT (intensity-normalized stereotaxic environment for classification of tissues). All data are corrected for field inhomogeneity,81 inter-slice normalization, and inter-subject intensity normalization. Stereotaxic transformation is then performed,85 and an artificial neural network classifier identifies GM, WM, and CSF tissue types.84,86
Regional Parcellation—ANIMAL
Manual labeling of brain voxels is both time-consuming and subjective. We have developed an automated algorithm to perform this labeling in three-dimensions87 (Figure 6▶). The ANIMAL algorithm (automated non-ar image matching and anatomic labeling) deforms one MRI volume to match another, previously labeled MRI volume. It builds up the three-dimensional nonlinear deformation field in a piecewise linear fashion, fitting cubic neighborhoods in sequence. The algorithm is applied iteratively in a multiscale hierarchy. At each step, image volumes are convolved with a three-dimensional Gaussian blurring kernel of successively smaller width (32, 16, 8, 4, and 2 mm full-width at half maximum). Anatomic labels are defined in the new volume by interpolation from the original labels via the spatial mapping of the three-dimensional deformation field (Plate 2▶).
Figure 6 .
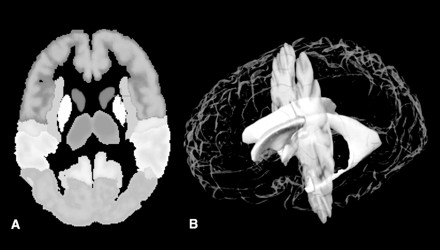
A, Autosegmentation of structures. This image illustrates the first stage of autosegmentation once the brain has been spatially normalized. Lobes, gyri, and some subcortical nuclei are labeled. This iterative process continues with increasing refinement. B, Three-dimensional model with autosegmented ventricular system. This model shows an autosegmented ventricular system converted to a surface model, enabling morphometric statistics to be calculated. This segmentation was the result of a combination of tissue classification approaches and template matching following spatial normalization.
Plate 2.
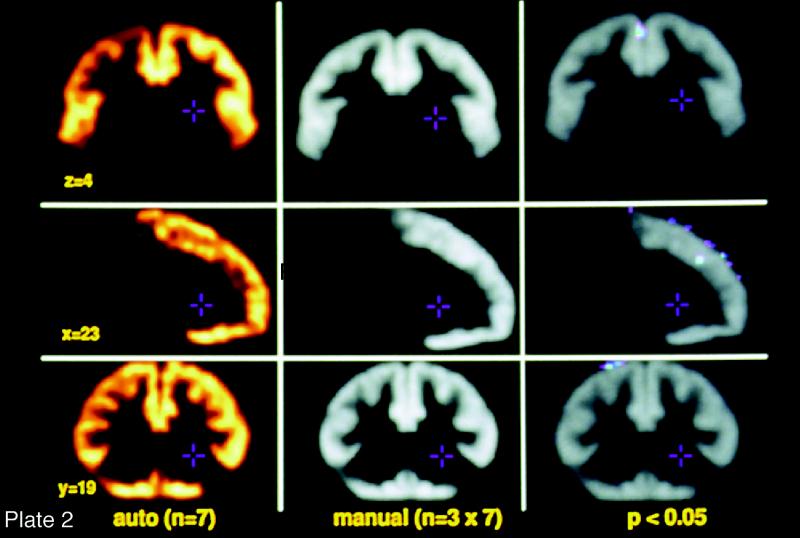
(Opposite, middle) Frontal matter: automated vs. manual image segmentation. A group of expert neuroanatomists labeled a template brain using a rigorously developed set of rules and manual segmentation methods and using in vivo MRI studies and postmortem cryomacrotome data sets. Linear and nonar warping algorithms were then used to match brains obtained in this program to the template in such a way that each voxel acquires the template brain's label for that brain region. The brain is then reverse-transformed back to its native shape and entered into the probabilistic database. To test the relative accuracy of this process, in vivo MRI studies obtained in this project from 10 individual brains were distributed to three of the participating institutions. Neuroanatomists at each site used the rules that were employed to prepare the template brain to manually segment the 10 newly acquired studies. The composite accuracy of these manually segmented data sets, performed independently in triplicate at the three institutions, were compared with the performance of the automated process. Significant differences in the labeling of voxels is indicated in the panel on the right. As you can see, the automated process performs comparably with the very labor-intensive strategy required to manually segment the brains. Also notice that the region of the brain chosen for this validation was the frontal cortex, a portion of the brain known to have significant variability among human beings. This strategy thus allows for the automated segmentation of brains, thereby making possible detailed data analysis in populations large enough to develop probabilistic information about human brain structure on a macroscopic scale.
Warping Strategies
Atlases can be greatly improved if they are elastically deformable and can fit new image sets from incoming subjects. Local warping transformations (including local dilations, contractions, and shearing) can adapt the shape of a digital atlas to reflect the anatomic features of an individual subject, producing an individualized brain atlas. Introduced by Bajcsy et al., at the University of Pennsylvania,88–91 this approach was adopted by the Karolinska Brain Atlas Program,92–94 where warping transformations were applied to a digital cryosectioned atlas to adapt it to individual CT or MR data and co-registered functional scans.
Warping algorithms calculate a three-dimensional deformation field that can be used to nonarly register one brain with another (or with a neuroanatomic atlas). The resultant deformation fields can subsequently be used to transfer physiologic data from different individual subjects to a single anatomic template.95–100 This enables functional data from different subjects to be compared and integrated in a context in which confounding effects of anatomic shape differences are factored out. Nonlinear registration algorithms, therefore, support the integration of multi-subject brain data in a stereotaxic framework and are increasingly used in functional image analysis packages.92,101
Image warping algorithms, specifically designed to handle three-dimensional neuroanatomic data,76–79,85,87,102–110 can transfer all the information in a three-dimensional digital brain atlas onto the scan of any given subject while respecting the intricate patterns of structural variation in their anatomic features. These transformations must allow any segment of the atlas anatomy to grow, shrink, twist, and rotate to produce a transformation that encodes local differences in topography from one individual to another. Deformable atlases90,92,102,111–115 resulting from these transformations can carry three-dimensional maps of functional and vascular territories into the coordinate system of different subjects. The transformations also can be used to equate information on different tissue types, boundaries of cytoarchitectonic fields, and their neurochemical composition.72,79,95,116–119
Any successful warping transform for cross-subject registration of brain data must be high-dimensional, to accommodate fine anatomic variations.103,120 This warping is required to bring the anatomic features in the atlas into structural correspondence with the target scan at a very local level. Another difficulty arises from the fact that the topology and connectivity of the deforming atlas have to be maintained under these complex transforms. This is difficult to achieve in traditional image-warping manipulations.121
Physical continuum models of the deformation address these difficulties by considering the deforming atlas image to be embedded in a three-dimensional deformable medium that can be either an elastic material or a viscous fluid.76 The medium is subjected to certain distributed internal forces, which reconfigure the medium and eventually lead the image to match the target. These forces can be based mathematically on the local intensity patterns in the data sets, with local forces designed to match image regions of similar intensity (Plates 2 and 3▶▶).
Plate 3.
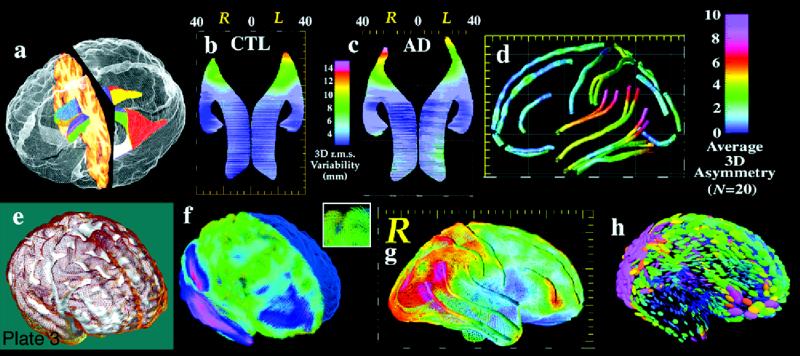
(Opposite, bottom) Surface models. Three-dimensional models can be created to represent major structural and functional interfaces in the brain. a, A model of the lateral ventricles, in which each element is a three-dimensional parametric surface mesh. b and c, Average ventricular models from a group of patients with Alzheimer's disease (N = 10) and matched elderly controls (N = 10). Notice the larger ventricles in the patients and a prominent ventricular asymmetry (left larger than right). This feature emerges only after averaging models for a group of subjects. Population average maps of cortical anatomy (d) reveal a clear asymmetry in perisylvian cortex. e, The cortex from an individual brain (brown mesh) overlaid on an average cortical model for a group. f, Differences in cortical patterns are encoded by computing a three-dimensional elastic deformation (pink indicates large deformation) that reconfigures the average cortex into the shape of the individual, matching elements of the gyral pattern exactly. These deformation fields store detailed information on individual deviation, and can be averaged across subjects to create three-dimensional variability maps, revealing fundamental patterns of anatomic variability in the brain (g).123 Tensor maps (h, color ellipsoids) reveal the directions in which anatomic variation is greatest. The ellipsoids are more elongated in the directions in which structures tend to vary the most; pink denotes largest variation; blue, least. These statistical data can be used to detect patterns of abnormal anatomy in new subjects. (Panels e through h are reprinted, with permission, from Thompson PM, Woods RP, Mega MS, Toga AW. Mathematical/computational challenges in creating deformable and probabilistic atlases of the human brain. Hum Brain Mapp. 2000;9(2):81–92. Copyright © John Wiley & Sons, 2000.)
Surface Methods
Rationale
Vast numbers of anatomic models can be stored in a population-based atlas.122,123 These models provide detailed information on the three-dimensional geometry of the brain and how it varies in a population. By averaging models across multiple subjects, subtle features of brain structure emerge that are obscured in an individual subject because of wide cross-subject differences in anatomy.124
These modeling approaches have recently uncovered striking patterns of disease-specific structural differences in Alzheimer's disease,125,126 schizophrenia,127 and fetal alcohol syndrome128 as well as strong linkages between patterns of cortical organization, age, and gender,129 cognitive scores,130 and genotype.131 To illustrate the approach, Plate 3▶ shows a model of the lateral ventricles, in which each element is represented by a three-dimensional surface mesh. These surface models can often be extracted automatically from image data, using recently developed algorithms based on deformable parametric surfaces132–134 or voxel-coding.135 Once an identical computational grid (or surface mesh) is imposed on the same structure in different subjects, an average anatomic model can be created for a group. This is done by averaging the three-dimensional coordinate locations of boundary points that correspond across subjects.
Plate 3▶, parts b and c, show average ventricular models from a group of patients with Alzheimer's disease (N = 10) and from matched elderly controls (N = 10). Not only are the ventricles larger in the patients, but a prominent ventricular asymmetry (left larger than right) is found in both groups, a feature that emerges only after surface averaging. Specialized approaches for averaging cortical anatomy can also be used to generate population-based maps of brain asymmetry (Plate 3d▶) and investigate its alteration in disease.124,127
Cortical anatomy can also be compared across subjects and its variability encoded to guide the detection of abnormal anatomy.122 Plate 3e▶ shows the cortex of an individual subject (brown mesh) overlaid on an average cortical model for a group. Differences in cortical patterns can be encoded by computing a three-dimensional elastic deformation that reconfigures the average cortex into the shape of the individual cortex, matching elements of the gyral pattern exactly (Plate 3f▶). These deformation fields store detailed information on individual deviations and can be averaged across subjects to create three-dimensional variability maps, revealing fundamental patterns of anatomic variability in the brain (Plate3g▶). The resulting confidence limits on the locations of cortical structures can be used in Bayesian approaches to guide the automated labeling of gyri and sulci136 and to map profiles of abnormal anatomic features in individual patients or groups of subjects.122,137
Two strategies are described—one for extraction of the cortical surface as a continuous curved sheet (MSD) and the other identifying and labeling folds or sulci (SEAL)
Cortical surface segmentation.
Multiple surface deformation (MSD) is a fully-automated procedure for fitting and unfolding the entire human cortex, using an algorithm that automatically fits a three-dimensional mesh model to the cortical surface extracted from MRI studies. Multiple surface deformation uses an iterative minimization of a cost function that balances the distance of the deforming surface from 1) the target surface and 2) the previous iteration surface. Specification of the relative weight of these competing forces allows MSD to range from unconstrained (data-driven) deformation to tightly-constrained (model-preserving) deformation. Further shapepreserving constraints are also employed. The initial mesh surface can be chosen arbitrarily to be a simple geometric object, such as a sphere, an ellipsoid, or two independently-fitted hemispheres.138
Recently, MSD has been extended to allow simultaneous extraction of both inner and outer surfaces of the cortical mantle, using linked concentric mesh models.139 Corresponding vertices in each surface are elastically linked using distance range constraints. Inter-surface cross-intersection and intra-surface self-intersection constraints prevent impossible topologies. These two factors allow for a deeper penetration of the deforming surfaces into the cortical sulci, since areas where infolding of the outer boundary (between GM and CSF) are indistinct because of partial volume effects are areas while the inner boundary (between GM and WM) is usually well distinguished.
Multiple surface deformation can operate on raw image intensity or on fuzzy-classified tissue maps obtained from INSECT. Extraction of both surfaces yields a measurement of cortical thickness at each surface vertex. The thickness measurement can be defined in a variety of ways, as 1) distance between corresponding vertices, 2) closest approach of one surface to each vertex of the other surface, or 3) distance between surfaces along the surface normal at each vertex of one surface. These definitions give rise to different absolute values for cortical thickness (closest approach must yield the smallest value, by definition) but the variation in thickness over the whole cortex is generally very similar among the distance measures.139
The method has been applied to a set of 102 MRI volumes from the ICBM database, which have been previously mapped automatically into stereotaxic space85 and used to generate various group results by averaging of the three-dimensional locations of corresponding vertices across subjects. The average outer cortical surface obtained when both surfaces are simultaneously fitted exhibits a dramatic increase in detail compared with the surface obtained when only the outer surface is fitted, a consequence of the deeper penetration into individual sulci. Since the average cortex can be used as the starting point for mesh-modeling of any individual surface, this is likely to lead to faster and more accurate extraction of individual cortical surfaces in the future. Moreover, the average cortical surface is used by some groups to constrain electrophysiologic inverse solutions,140 and better specification of this surface can be expected to improve that process. The cortical thickness maps exhibit the expected variation in cortical thickness, the temporal poles having the thickest cortex (4 to 6 mm) and the posterior bank of the central sulcus having the thinnest (1.8 to 2.5 mm).
Sulcal Extraction and Automatic Labeling.
We have implemented an automated sulcal extraction and automatic labeling algorithm, SEAL.131,141 At every voxel on the MSD isosurface, SEAL calculates the two principal curvatures—the mean curvature and the Gaussian curvature. Voxels with negative mean curvature, belonging to sulci, are extracted and pruned to obtain a set of superficial sulcal traces. SEAL extracts the buried sulcus with an “active ribbon” that evolves in three dimensions from a superficial trace to the bottom of a sulcus by optimizing an energy function based on 1)maximizing distance between starting and current trace position (i.e., for increased penetration), 2)maximizing distance to any other sulcal voxel (i.e., stay within sulcus), and 3)minimizing distance from the median sulcal locus, as defined by the “ridge” operator.
To encode the extracted information, we defined a relational graph structure composed of two main features, arcs and vertices. Arcs contain a surface representing the interior of a sulcus. Points on this surface are expressed in stereotaxic coordinates. For each arc, we store length, depth, and orientation data as well as attributes, e.g., hemisphere, lobe, and sulcus type. Each vertex stores its three-dimensional location and its connecting arcs.
We have written functions to access this data structure, which allow a systematic description of the sulci themselves and their interconnections. Sulcal labeling is performed semi-automatically within the DISPLAY segmentation software by tagging a sulcal trace in the three-dimensional graph and selecting from a menu of candidate labels. The menu is restricted to most likely candidates by the use of spatial priors for sulcal distribution. Given these spatial probability anatomic maps (SPAMs), the user is provided with the probability that the selected arc belongs to a particular sulcus.
Database
Strategy
Several approaches can be used in the creation of databases to accommodate the diversity of data types and structures needed to adequately represent brain structure and function in three and four dimensions. Whereas a map is a collection of information, a representation of our understanding of the brain, a database is designed with more interactions in mind. Its function is to organize and archive data records and provide an efficient and comprehensive query mechanism. Modern digital maps have only begun to incorporate database functionality.
Daemon and BrainMap
An automated coordinate-based system to retrieve brain labels from the 1988 Talairach Atlas,142 called the Talairach Daemon (TD), was previously introduced.143 The TD system and its three-dimensional database of labels for the 1988 Talairach atlas were tested for labeling of functional activation foci. The TD system labels were compared with author-designated labels of activation coordinates from over 250 published functional brain-mapping studies and with manual atlas-derived labels from an expert group using a subset of these activation coordinates. Automated labeling by the TD system compared well with authors' labels, with a label match, averaged over all locations, of 70 percent or more. Author-label matching improved to more than 90 percent within a search range of ±5 mm for most sites.
Digital Libraries and Data Warehouse
In addition to the derived data organized in the databases described above, digital libraries and data warehouses of complete data sets will also be provided, through the ICBM project, to the neuroimaging community. These data sets include those with “raw” data (i.e., complete, three-dimensional, multispectral MRI structural studies of individual subjects), “scalped” data sets (i.e., with extracerebral structures removed), and intensity-normalized, “scalped” data sets. Access to such information may enable investigators to obtain normal control data for neuroimaging experiments or to test various methods for image analysis and display without the need to acquire original data on their own. Most problematic will be the distribution of “raw” data sets, since the potential for compromising subject confidentiality is an issue. Since the face of an experimental subject could be reconstructed from the raw data sets, one strategy would be to alter or eliminate facial structures from the data set prior to distribution.
Visualization
As with the approach chosen for analysis, members of the consortium decided to keep an open mind about how to present the data developed by the consortium. Given the probabilistic nature of the resultant data, the decision is not straightforward and has not yet been fully resolved. The optimal solution may well be to select many avenues and let users of this system choose for themselves.
Approaches that flatten144–147 or inflate148,149 the cortex have been proposed and well described. As a visualization tool, these strategies allow cortical anatomy to be seen in its entirety at the expense of the more familiar, three-dimensional appearance of the brain. The use of visualization methods simply as tools to view the data must be distinguished from the use of visualization tools to identify homologies between regions in different brains or different species. We consider these strategies here, in this context, only as visualization tools, since our approach to homology identification with regard to macro- and microscopic structure and function considerations was described earlier.
Each visualization strategy has its benefits and limitations. The traditional three-dimensional view of the brain in its natural state obviates the ability to see brain regions hidden in folded cortex or deep structures without providing tools for translucency or sectioning. Flattening or inflating the surfaces will produce areas of compression and expansion that alter the data from their original state but make all surface regions visible. Providing all these avenues will allow the user to choose among them, given a specific purpose. The user can choose whether the benefits and insights provided by a given visualization strategy outweigh its disadvantages or the artifacts it induces.
Results
Automated vs. Manual Segmentation
The DISPLAY tool has been used for manual labeling of many structures.150–153 However, the labeling of each three-dimensional voxel by hand is prohibitively time-consuming and subject to significant intra- and inter-rater variability. Therefore, we have used automated approaches to label specific brain structures. Data volumes are automatically mapped into stereotaxic space using a nine-parameter ar transformation, so that anatomic variability among individual brains is captured in the form of SPAM fields for each brain region. Voxels are labeled using three different segmentation approaches, and SPAMs have been generated for GM/WM/CSF tissue classes (INSECT)84; all major cortical gyri, cerebellum, and deep nuclei (ANIMAL)87; cortical surface and cortical thickness (MSD)139; and sulcal probabilities (SEAL).141
Normal Brain
Adults
With completion of structural imaging and analysis on the first 500 subjects (an additional 5,600 subjects have been studied but not yet fully analyzed), it is possible to report on the initial outcomes of the analysis of this effort. These results can be divided into two categories—the normal adult brain (for which the vast majority of data was collected) (Plate4▶) and the developing brain (for which the tools and principles were developed and have been applied to data sets not originally envisioned in this project of normal adult subjects). Since the main emphasis of the program to this point has been the development of the tools and the acquisition of data, meaningful results from large populations are the last aspect to emerge from a strategy that has a very high front-end overhead. Nevertheless, the following observations have already been made.
Plate 4.
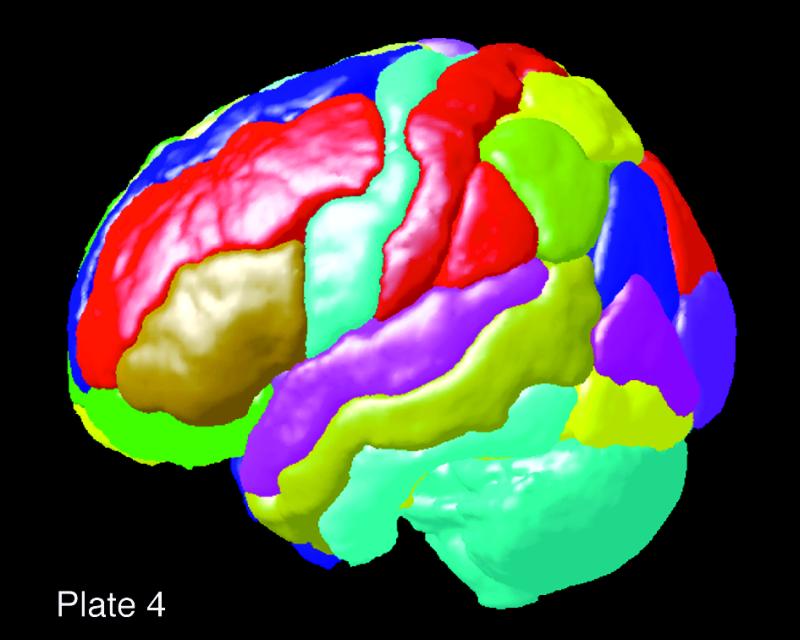
(Opposite, top left) Probabilistic adult human brain: surface-rendering of the probabilistic atlas (N = 100) thresholded to 40 percent to generate a regional probabilistic isocontour for the individual brain regions on the dorsolateral surface. Probabilistic isocontours and confidence limits can be arbitrarily established for any brain region at any probabilistic level, thereby giving a sharply demarcated boundary surface for the region of interest.
Cortical Thickness Estimates.
By the use of algorithms (e.g., MSD, described above) that find both the inner and outer surfaces of the cerebral cortex (analogous in the physical sense to shrink wrapping), it is possible to estimate cortical thickness. This approach has been tested against manual estimates for 20 regions (10 per hemisphere) using 40 brain MRI studies. Validity was determined by an anatomist labeling the CSF–GM and GM–WM borders of selected gyri and by allowing the algorithm to determine the CSF–GM and GM–WM borders for the same region. The distance between the CSF–GM and GM–WM tags determined the cortical thickness at that point. The manual and automatic methods were in agreement for all but 4 of 20 regions tested. The four regions where the results were statistically different between the two methods were the insula in both hemispheres, the cuneus, and the parahippocampus in the right hemisphere. Thus, the automatic algorithm is valid for most of the cortex and provides a reasonable alternative to manual in vivo measurement except in regions where cortex is adjacent to other GM structures.
Development
The noninvasive nature of MR imaging provides unique opportunities for in vivo investigation of the developing human brain. In the early MRI studies of newborns and infants, variations in signal intensities were evaluated by visual inspection of the images.154 Image processing approaches were first used for semi-automatic classification of brain tissues and subsequent measurement of the total volume of GM, WM, and CSF; the total number of children included in such studies varied from 9155 to 60.156 Several authors also included, in addition to such “global” measures, regional volumes or areas of structures like the corpus callosum157,158 and the caudate nucleus.159 In a few studies, the authors applied gross parcellation schemes to subdivide the cerebrum into several cortical compartments.160,161
More recently, MRI investigations of brain development have entered the realm of fully automatic processing and analysis of MR images, which were developed in the context of the ICBM project. Giedd et al.162 reported age-related changes, in 145 children and adolescents, in volumes of GM and WM of the frontal, parietal, temporal, and occipital lobes; the volumes were quantified by combining a technique using an artificial neural network to classify tissues on the basis of voxel intensity, with a technique performing nonar registration to a template brain for which the four lobes had been manually defined.
This study illustrates the potential of tissue-classification and structure-segmentation algorithms for studies of global and regional brain development. The continued evolution and validation of these algorithms will eventually allow us to quantify automatically volumes of individual cortical regions (e.g., GM volume buried in the central sulcus) and subcortical nuclei (e.g., amygdala).
Subtle regional variations in GM and WM can also be evaluated using a voxel-by-voxel analysis of images. This approach borrows from concepts developed in functional neuroimaging. It is based on the use of standardized stereotaxic space and voxel-based statistics. In a study of age-related changes in WM, Paus et al.163 observed significant age-related changes in WM “density” in the internal capsule and the left arcuate fasciculus; the former contains fibers connecting the motor cortex and spinal cord, and the latter contains those connecting the anterior (Broca's) and posterior (Wernicke's) language areas (Plate 5▶).
Plate 5.
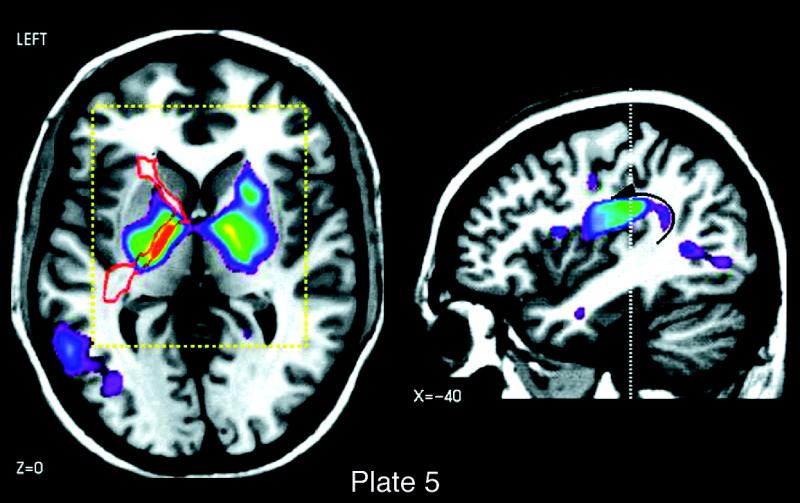
(Opposite, top right) Age-related changes in white-matter density in the internal capsule (left) and the left arcuate fasciculus (right). The thresholded maps of t-statistic values (t<4.0) are superimposed on axial (capsule) and sagittal (arcuate) sections through the magnetic resonance image of a single subject. The images depict the exact brain locations that showed statistically significant correlations between white matter density and the age of the subject (n=111; age range, 4–17 years).163 The internal capsule contains fibers that carry nerve impulses from the motor cortex to the spinal cord and, eventually, to the hand muscles. The arcuate fasciculus contains fibers connecting the posterior (Wernicke's) and anterior (Broca's) speech areas of the left hemisphere.
A similar approach has been applied in two studies of age-related variations of GM density.164,165 Such voxel-based analyses of age-related variations in WM and GM densities complement the volumetric approach in allowing for subtle local differences to emerge in regions that may not be deated as a single volume. However, relatively large numbers of subjects and rather conservative statistical criteria are needed to separate signal from noise reliably.
The growth of well-circumscribed structures can be revealed by a computational analysis of deformation fields. The three-dimensional deformation fields specify, at each voxel, the vector of forces that are applied to bring local anatomic features of the subject's brain in alignment with features of the template brain.
Dramatic changes in brain structure occur in a variety of developmental and disease processes. These changes are now beginning to be tracked in their full spatial and temporal complexity. In a recent study,124 the first detailed maps of growth in the developing brain (2 weeks to 4 years, across the first 15 years of life) were created. As children approached puberty and adolescence, a wave of peak growth rates was identified. This wave of peak growth moved posteriorly from frontal cortex, at ages 3 to 6 years, toward language systems at ages 6 to 15 years (Plate 6a▶). A region of extreme growth was consistently found at the callosal isthmus and the linguistic regions it innervates (Plate 6b▶) between ages 6 and 13 years, with a drastic reduction in growth shortly afterwards, coinciding with the end of a well-known critical period for language acquisition. At the same time, equally rapid tissue loss was found in the basal ganglia (50 percent tissue loss locally; Plate 6c▶).124 Intriguingly, the loss of GM in deep motor nuclei was followed by a progressive reduction of GM in the frontal cortex, which was found to continue throughout adolescence and into adulthood.164 These complex changes suggest not only an acceleration of signal transduction in cortical networks but also a refinement in processing efficiency and a pruning of tissue in frontal and subcortical systems.
Plate 6.
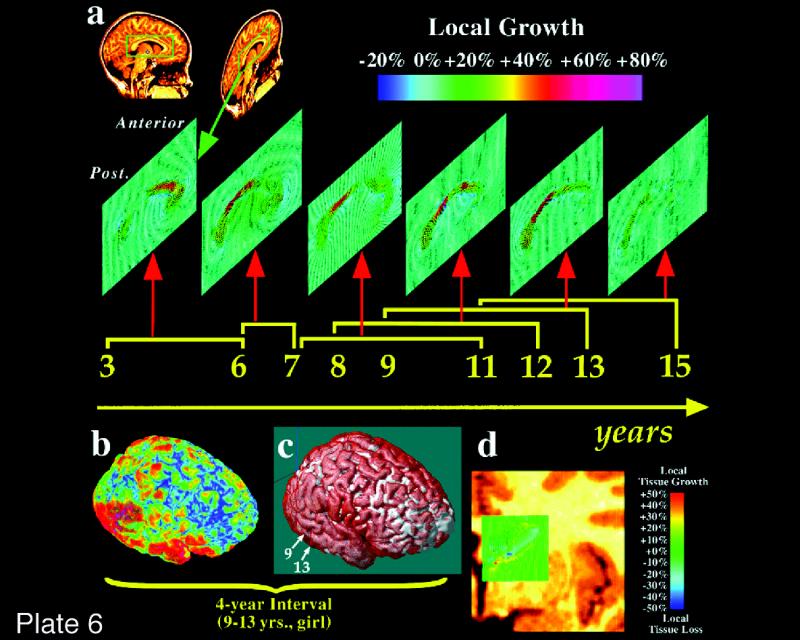
(Opposite, middle) Mapping growth patterns in children. Growth rates are mapped for the corpus callosum (a), the major fiber tract that communicates information between the two brain hemispheres. The maps are based on scans obtained from the same child at ages 3 and 6 years, from another child at ages 6 and 7 years, and so on. Extremely high growth rates (up to 80 percent gain of tissue locally) can be seen in specific brain regions. Fastest growth (red) is found consistently, across ages 6 to 13 years, in the callosal isthmus, which carries fibers to areas of the cerebral cortex that support language function and areas of the temporoparietal cortex that support mathematical thinking. Growth rates in the fibers projecting to language cortex are dramatically reduced after puberty (11 to 15 years). Notice how different the peak growth rates are in a child between the ages of 3 and 6 years, where 80 percent growth occurs in frontal regions that support the planning of new actions and the organization of new behaviors. Brain tissue is also lost during development. A rapid loss of tissue in the caudate nucleus of a 7- to 11-year-old child is shown in panels b through d. This structure supports learned motor behavior. Loss of tissue may suggest localized increases in processing efficiency and elimination of redundant brain tissue as development progresses. These growth patterns are complex, as rapid growth is also occurring close to the site where tissue is lost. (Reprinted, with permission, from Thompson PM, Giedd JN, Woods RP, MacDonald D, Evans AC, Toga AW. Growth patterns in the developing brain detected by using continuum mechanical tensor maps. Nature. 2000;404(6774):190–3. Copyright © 2000, Macmillan Magazines Ltd.)
The ability to encode these growth rates in a group atlas presents key opportunities for studying brain development. By storing probabilistic information on growth rates at each developmental stage, confidence limits for normal development are now beginning to be established.129,163 By adapting the theory of Gaussian fields to accommodate four-dimensional data,124,166 both growth and degenerative profiles can be compared and aberrant brain changes detected in individual subjects. Finally, the atlasing of dynamic data on brain structure provides a powerful means to correlate structural and functional changes that may not be observable in a single scan, for early detection of disease. The probabilistic framework also supplies mathematical criteria to evaluate therapeutic response and is currently being used to compare four-dimensional profiles in development,129,163 dementia,125 multiple sclerosis,84 and neuro-oncology.167 To detect more subtle variations, however, group analysis of deformation fields and their statistical evaluation will be necessary. Chung et al.168 have developed a novel statistical analysis of local growth that will allow investigators to evaluate the statistical significance of age-related changes in deformation fields throughout the brain.
Patient Examples
There is a natural evolution in applying the tools developed in a program such as this, established to build an atlas of the normal human brain, to disease states. Specifically, it is both practical and desirable to build disease-specific atlases to observe the natural history of disorders, to compare affected patients with normal, age-matched subjects, and to compare patients undergoing conventional and experimental therapies. In this way, it is possible to have quantifiable, objective and automated means by which to examine brain structure and function in normal and disease states. Such an approach, using imaging as a surrogate marker of disease burden, may greatly facilitate clinical therapeutic trials by providing objectivity and a quantifiable surrogate end point.
Schizophrenia
In schizophrenia, probabilistic atlases may provide clues about relationships between neurobiology and behavior, add insight into the etiology and pathogenesis of the disease, and ultimately provide diagnostic criteria and help predict treatment outcome (Plate7▶).169 Nevertheless, to define aberrations in specific functional systems, it is first necessary to identify structural neuropathology in discrete brain regions.
Plate 7.
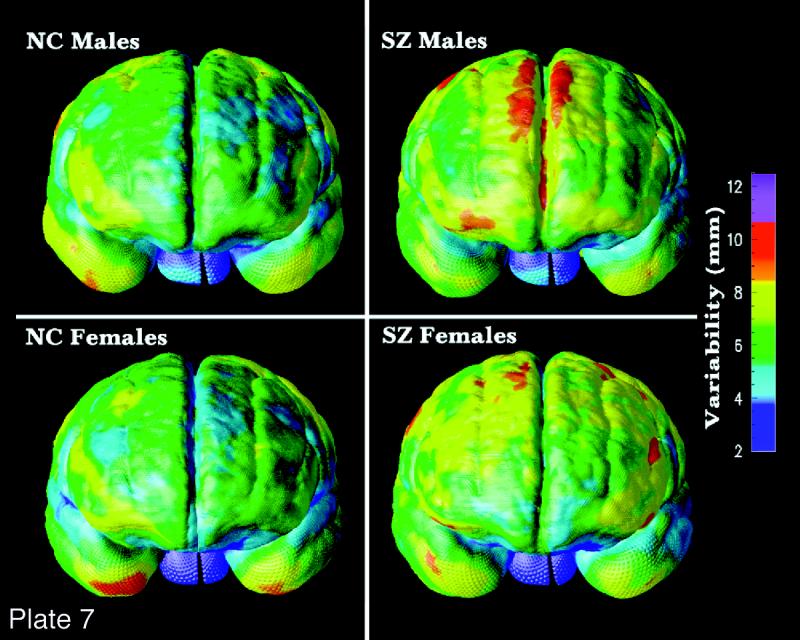
(Opposite, bottom) Variance of frontal cortex in normal subjects vs. patients with schizophrenia, by gender. Anatomic variability in the frontal cortex is far greater in patients with schizophrenia than in control subjects matched for age, gender, and other demographic factors. This indicates an aberrant organization of the gyral pattern in frontal cortex, perhaps occurring during late embryonic development, when the gyral pattern of frontal cortex is established. Notice that the pattern of greater anatomic variability is specific to frontal cortex and is found in both male and female patients (SZ) but not in normal controls (NC).127 (Reprinted, with permission, from Narr K, Thompson P, Sharma T, et al. Three-dimensional mapping of gyral shape and cortical surface asymmetries in schizophrenia: gender effects. Am J Psychiatry. 2001;158(2):244–55. Copyright © 2001 by American Psychiatric Association, Inc.)
The corpus callosum plays an integral role in relaying sensory, motor, and cognitive information from homologous regions in the two cerebral hemispheres. Given that cognitive impairments and both bilateral and unilateral neuroanatomic structural abnormalities are characteristic in schizophrenia, morphology of the corpus callosum has been well studied.170–175 Most investigations of the corpus callosum have used “region of interest” analyses to assess differences in area in the midsagittal plane, callosal length, and width.176 Fewer studies have attempted to investigate differences in callosal shape and in the three-dimensional location of the corpus callosum across groups.177,178
Volumetric methods allowing group comparisons in gross neuroanatomy may have limitations. For example, results from “region of interest”– based studies may be obscured by across-subject variability and are not able to fully characterize subtle differences in anatomy across groups. A parametric surface modeling approach using MR images was employed, providing spatially accurate representations of midsagittal callosal surfaces in patients with schizophrenia (n = 25) and in normal controls (n = 28). Functionally relevant areas were visualized and compared across groups. To register neuroanatomic landmarks surrounding the corpus callosum, each three-dimensional MR volume was scaled according to Talairach anterior commissure–posterior commissure (AC-PC) distance. Raw distances were included as covariates in multivariate analyses.
Results revealed distinct patterns of variability in each group, a marked vertical displacement of the corpus callosum in patients, significant increases in curvature (P<0.001) in both superior and inferior callosal surfaces in male patients, and increases in maximum widths in anterior and posterior callosal regions in male patients vs. controls. These findings demonstrate a clear structural index of schizophrenia neuropathology, with different manifestations in male and female patients. Displacement and curvature increases correspond to structural differences in surrounding neuroanatomic regions.
In sum, the methods employed in this study revealed unique differences in callosal shape and patterns of variability between patients with schizophrenia and normal controls, with clear gender differences. These findings demonstrate that, whether gender-by-diagnosis interactions exist in particular regions of interest in regard to volume in schizophrenia,179,180 gender effects may influence other structural neuroanatomic parameters.
Further investigations are in progress, relating callosal parameters to other neuroanatomic regions shown to possess structural alterations in patients with schizophrenia, such as asymmetric perisylvian cortices and prefrontal cortices (Plaste 7). Furthermore, structural alterations in surrounding regions such as thalamus and cingulate cortices may also be related to callosal displacements. Finally, it is clear that gender influences callosal morphology in schizophrenia. Larger sample sizes and homogeneous patient populations matched closely with control subjects as well as correlations with symptom complexes are required, since callosal morphology in patients with schizophrenia appears to be tempered by a number of clinical variables, including symptomatology, disease course, and age of onset in addition to sex, handedness, and age.
Other Issues
Isolated Brain Regions
More difficult than working with full three-dimensional data sets is the problem of entering microscopic data from brain sites that are analyzed on a regional basis (e.g., the study of the isolated hippocampus). Nevertheless, such data can also be incorporated into the probabilistic reference system and atlas. Such a problem will require landmarks to appropriately localize regional data in the global atlas brain.
Consider a series of postmortem cryomacrotome human brains that are stained with a series of conventional and commonly used neuroanatomic “landmark” stains (e.g., Nissl, acetylchosterase). Using imaging devices, these sections would be digitized and sampled at a 20-μm resolution. The resultant data sets would be warped and entered into the probabilistic atlas as an additional feature.
Now consider an investigator who studies GABA (gamma-aminobutyric acid) receptors in the human hippocampus. This investigator would like to know where the receptors from the hippocampi of a given epileptic patient population fall with regard to other data in the probabilistic reference system. In preparing the tissue, this investigator would process every th section using one of the “landmark” stains that are part of the probabilistic atlas. The investigator would then digitize the information from both the GABA receptor sections and the landmark-stained sections. Using alignment, registration, and warping tools that are part of the atlas system, the investigator would register the landmark-stained sections with the atlas and then use the same mathematical transformations to enter the GABA receptor information into the hippocampal region of the atlas. Once these new data were referenced, database queries and visualization of the data could be performed in the atlas system. A similar approach allows referencing between newly acquired in vivo data and stored postmortem specimens, which should aid in relating functional localization with macroscopic and microscopic anatomy.96–100,181
Sociology
Any endeavor to organize information across laboratories, or especially across an entire field, requires attention to the sociology involved.2 Frustration with existing methods must be high enough and the solutions good enough (in terms of practicality, economics, and implementation) that they will be adopted. Such a transition is made easier if rigid new standards are not imposed on the structure or organization of data generated in a given laboratory but if, instead, the tools are available to translate such data into the framework and form required for interaction with the database and atlas. This is a strategy we have employed.
Perhaps the most important, if not critical, step is the willingness of the community to share data in all its forms (including raw data) to allow for the full implementation of such a system. Such strategies will require participation of traditional final end products of research (e.g., journals) as well as academic recognition for data provided to such systems. Finally, it is always important to have a consensus from the community before embarking on the construction of a complex system such as this one. Wide participation, frequent requests for input, and distributed testing of products are all helpful in establishing a successful system that is accepted by the community for which it was intended.
Conclusions
There is no question that the development of systems and tools such as the probabilistic atlas will have a specific and not insignificant cost associated with them. It is also true that increments in neuroscientific research funding have not kept pace with the growth of the field in terms of the number of investigators or the magnitude of their projects.2
The ultimate goal of neuroscientific research is to produce the most accurate and precise understanding of normal and abnormal brain function. The tools we describe will enhance the accuracy, efficiency, and availability of the results of such research. A system such as a probabilistic atlas for a given species, or potentially across species, provides a means for rigorously storing, comparing, and analyzing data over time and between laboratories. Such a system currently does not exist. Furthermore, by virtue of data exchange and comparison, integration within the broad field of neuroscience will begin.
The development of a probabilistic atlas and reference system for the human brain is a formidable goal. It involves participation from many sites around the world and investigators committed to the end product. The creation of a probabilistic atlas of the human brain is not an exercise in library science. It is a series of fundamental, hypothesis-driven experiments in merging mathematical and statistical approaches with morphologic and physiologic problems posed with regard to the nervous system. It will create new data and insights into the organization of the human nervous system in health and disease, its development, and its evolution. When successful, the atlas will provide previously unprecedented tools for organizing, storing, and communicating information about the human brain throughout development, maturation, adult life, and old age. It will be a natural prelude to studies of patients with cerebral disorders and will provide the first mechanism by which large-scale phenotype–genotype–behavioral comparisons can be made on macroscopic and microscopic levels. These results will provide the first insights into the structure-function organization of the human brain across all structures and a wide range of ages. Its design anticipates continuing evolution in the quality, resolution, and magnitude of data generated by existing technologies that are used to map the human brain, and even anticipates that many future technologies, unknown today, will be applicable because the entire system is organized using the architecture of the brain as its guiding principle. The result will allow electronic experimentation and hypothesis generation, facilitated communication among investigators, and an objective way to assess information gleaned from scientific meetings or publications, and will vastly increase the value of every dollar spent on neuroscience research.182 Developing such a system is an open-ended project with constant evolution, improvement, and expansion both in the numbers of subjects included and the range of attributes associated with each. The results should be far more than a data structure and organizational system. Rather, the system should provide new insights and new opportunities for neuroscientists to utilize data in their own laboratories as well as others to more rapidly, effectively, and efficiently make progress in understanding human brain function in health and disease.
Acknowledgments
The authors thank the Brain Mapping Medical Research Organization, the Pierson-Lovelace Foundation, The Ahmanson Foundation, the Tampkin Foundation, the Jennifer Jones Simon Foundation, The National Alliance for Research in Schizophrenia and Affective Disorders, and the Robson Family for additional generous support. They also thank Laurie Carr for preparation of the manuscript and Andrew Lee for preparation of illustrations. The authors thank the faculties and staffs of the participating organizations for their dedication and participation in this program. Finally, they thank the subjects from around the world who participated in these investigations, for their time, interest, and commitment.
This work was supported by Human Brain Project grant P20-MHDA52176 funded jointly by the National Institute of Mental Health, National Institute for Drug Abuse, National Institute for Neurological Disease and Stroke, and the National Cancer Institute.
References
- 1.Mazziotta JC. Physiological neuroanatomy: functional brain imaging presents a new problem to an old discip. J Cereb Blood Flow Metab. 1984;4:481–4. [DOI] [PubMed] [Google Scholar]
- 2.Koslow SH. Should the neuroscience community make a paradigm shift to sharing primary data? Nature Neurosci. 2000;3:863–5. [DOI] [PubMed] [Google Scholar]
- 3.Watson JD, Myers R, Frackowiak RS, et al. Area V5 of the human brain from a combined study using positron emission tomography and magnetic resonance imaging. Cereb Cortex. 1993;3:79–94. [DOI] [PubMed] [Google Scholar]
- 4.Ungerleider LG, Desimone R. Cortical connections of visual area MT in the macaque. J Comp Neurol. 1986;248:190–222. [DOI] [PubMed] [Google Scholar]
- 5.Mazziotta JC, Huang SC, Phelps ME, Carson RE, MacDonald NS, Mahoney K. A non-invasive positron computed tomography technique using oxygen-15 labeled water for the evaluation of neurobehavioral task batteries. J Cereb Blood Flow Metab. 1985;5:70–8. [DOI] [PubMed] [Google Scholar]
- 6.Fox PT, Mintun MA. Noninvasive functional brain mapping by change-distribution analysis of averaged PET images of H215O tissue activity. J Neurosci. 1989;7:913–22. [PubMed] [Google Scholar]
- 7.Flechsig P. Anatomie des menschlichen Gehirns und Ruckenmarks. Leipzig, Germany: Thieme, 1920.
- 8.Zihl J, von Cramon D, Mai N. Selected disturbance of movement vision after bilateral brain damage. Brain. 1983;106:313–40. [DOI] [PubMed] [Google Scholar]
- 9.Zihl J, von Cramon D, Mai D, Schmid C. Disturbance of movement vision after bilateral posterior brain damage: further evidence and follow-up observations. Brain. 1991;114:2235–52. [DOI] [PubMed] [Google Scholar]
- 10.Friston KJ, Frith CD, Liddle PF, Frackowiak RSJ. Comparing functional (PET) images: the assessment of significant change. J Cereb Blood Flow Metab. 1991;11:690–9. [DOI] [PubMed] [Google Scholar]
- 11.Woods RP, Cherry SR, Mazziotta JC. A rapid automated algorithm for accurately aligning and reslicing positron emission tomography images. J Comp Assist Tomogr. 1992;16: 620–33. [DOI] [PubMed] [Google Scholar]
- 12.Woods RP, Mazziotta JC, Cherry SR. MRI-PET registration with automated algorithm. J Comp Assist Tomogr. 1993; 17(4):536–46. [DOI] [PubMed] [Google Scholar]
- 13.Ono M, Kubik S, Abernathy C. Atlas of the Cerebral Sulci. Stuttgart, Germany: Thieme, 1990.
- 14.Bailey P, von Bonin G. The Isocortex of Man. Urbana, Ill: University Press, 1951.
- 15.Dumoulin SO, Bittar RG, Kabani NJ, et al. A new neuroanatomical landmark for the reliable identification of human area V5/MT: a quantitative analysis of sulcal patterning. Cereb Cortex. 2000;10:454–63. [DOI] [PubMed] [Google Scholar]
- 16.Bartley AJ, Jones DW, Weinberger DR. Genetic variability of human brain size and cortical gyral patterns. Brain. 1997;120: 257–69. [DOI] [PubMed] [Google Scholar]
- 17.Zilles K, Schleicher A, Langemann C, et al. Quantitative analysis of sulci in the human cerebral cortex: development, regional heterogeneity, gender difference, asymmetry, intersubject variability and cortical architecture. Hum Brain Mapp. 1997;5(4):218–21. [DOI] [PubMed] [Google Scholar]
- 18.Clark S, Miklossy J. Occipital cortex in man: organization of callosal connections, related myelo- and cytoarchitecture, and putative boundaries of functional visual areas. J Comp Neurol. 1990;298:188–214. [DOI] [PubMed] [Google Scholar]
- 19.Rademacher J, Caviness VS, Steinmetz H, Galaburda AM. Topographical variation of the human primary cortices: implications for neuroimaging, brain mapping and neurobiology. Cereb Cortex. 1993;3(4):313–29. [DOI] [PubMed] [Google Scholar]
- 20.Dale AM, Halgren E. Spatiotemporal imaging of brain activity by multi-modality integration. Curr Opin Neurobiol. 2001;11:202–8. [DOI] [PubMed] [Google Scholar]
- 21.Ahlfors SP, Simpson GV, Dale AM, et al. Spatiotemporal activity of a cortical network for processing visual motion revealed by MEG and fMRI. J Neurophysiol. 1999;82: 2545–55. [DOI] [PubMed] [Google Scholar]
- 22.Broca P. Perte de la parole, ramollisement chronique et destruction partielle du lobe anterieure gauche du cerveau. Bull Soc Anthropol. 1861;2:235–9. [Google Scholar]
- 23.Ferrier D. Experiments on the brain of monkeys. Proc R Soc Lond. 1875;23:409–30. [Google Scholar]
- 24.Phillips C, Zeki S, Barlow H. Localization of function in the cerebral cortex: past, present and future. Brain. 1984;107: 327–61. [PubMed] [Google Scholar]
- 25.Zeki S, Watson JDG, Lueck CJ, Friston KJ, Kennard C, Frackowiak RSJ. A direct demonstration of functional specialization in human visual cortex. J Neurosci. 1991;11:641–9. [DOI] [PMC free article] [PubMed] [Google Scholar]
- 26.Brodmann K. Beitrage zur histologischen Lokalisation der Grosshirnrinde. Dritte Mitteilung: Die Rindenfelder der niederen Affen. J Psychol Neurol Lpz. 1905;4:177–226. [Google Scholar]
- 27.Brodmann K. Vergleichende Lokalisationslehre der Großhirnrinde in ihren Prinzipien dargestellt auf Grund des Zellenbaues. Leipzig, Germany: Barth JA, 1909.
- 28.Flechsig P. Developmental (myelogenetic) localisation of the cerebral cortex in the human subject. Lancet. 1901;2:1027–9. [Google Scholar]
- 29.Mesulam M-M. Large-scale neurocognitive networks and distributed processing for attention, language and memory. Ann Neurol. 1990;28:597–613. [DOI] [PubMed] [Google Scholar]
- 30.Posner M, Dehaene S. Attentional networks. Trends Neurosci. 1994;17(2):75–9. [DOI] [PubMed] [Google Scholar]
- 31.Kety S, Schmidt C. The nitrous oxide method for the quantitative determination of cerebral blood flow in man: theory, procedure and normal values. J Clin Invest. 1948;27:476–83. [DOI] [PMC free article] [PubMed] [Google Scholar]
- 32.Lassen N, Feinberg I, Lane, M. Bilateral studies of cerebral oxygen uptake in young and aged normal subjects. J Clin Invest. 1960;9:491–500. [DOI] [PMC free article] [PubMed] [Google Scholar]
- 33.Ingvar D. rCBF in focal cortical epilepsy. In: Langfitt T, McHenry L, Reivich M (eds). Cerebral Circulation and Metabolism. New York: Springer-Verlag, 1975:361–3.
- 34.Kuhl D, Edwards R. Quantitative section scanning using orthogonal tangent correction. J Nucl Med. 1973;14:196. [PubMed] [Google Scholar]
- 35.Phelps M, Hoffman E, Mullani N. Applications of annihilation coincidence detection to transaxial reconstruction tomography. J Nucl Med. 1975;16:210. [PubMed] [Google Scholar]
- 36.Mazziotta J, Gilman S. Clinical Brain Imaging. Philadelphia, Pa.: Davis, 1992.
- 37.Belliveau J, Kennedy D, McKinstry R, et al. Functional mapping of the human visual cortex by magnetic resonance imaging. Science. 1991;254:716–9. [DOI] [PubMed] [Google Scholar]
- 38.Prichard J, Alger J, Behar K, Petroft O, Shulman R. Cerebral metabolic studies in vivo by 31P NMR. Proc Natl Acad Sci USA. 1983;80:2748–51. [DOI] [PMC free article] [PubMed] [Google Scholar]
- 39.Prichard J, Brass L. New anatomical and functional imaging methods. Ann Neurol. 1992;32:395–400. [DOI] [PubMed] [Google Scholar]
- 40.Mazziotta J, Koslow S. Assessment of goals and obstacles in data acquisition and analysis from emission tomography: report of a series of international workshops. J Cereb Blood Flow Metab. 1987;7(2):S1–31. [DOI] [PubMed] [Google Scholar]
- 41.Filimonoff IN. Über die Variabilität der Großhirnrindenstruktur, Mitteilung II: Regio occipitalis beim erwachsenen Menschen. J Psychol Neurol. 1932;44:2–96. [Google Scholar]
- 42.Roland PE, Zilles K. Brain atlases: a new research tool. Trends Neurosci. 1994;17(11):458–67. [DOI] [PubMed] [Google Scholar]
- 43.Roland PE, Zilles K. The developing European Computerized Human Brain Database for all imaging modalities. NeuroImage. 1996;4:39–47. [DOI] [PubMed] [Google Scholar]
- 44.Roland PE, Zilles K. Structural divisions and functional fields in the human cerebral cortex. Brain Res Rev. 1998;26:87–105. [DOI] [PubMed] [Google Scholar]
- 45.Mazziotta JC, Toga AW, Evans AC, Fox P, Lancaster J. A probabilistic atlas of the human brain: theory and rationale for its development. NeuroImage. 1995;2:89–101. [DOI] [PubMed] [Google Scholar]
- 46.Toga AW, Thompson PM, Holmes CJ, Payne BA. Informatics and Computational Neuroanatomy. J Am Med Inform Assoc. 1996;6:299–303. [PMC free article] [PubMed] [Google Scholar]
- 47.Farrer LA, Cupples A, Haines JL, et al. Effects of age, sex and ethnicity on the association between apolipoprotein E genotype and Alzheimer disease: a meta-analysis. JAMA. 1997; 278:1349–56. [PubMed] [Google Scholar]
- 48.Soininen H, Partanen K, Pitkanen A, et al. Decreased hippocampal volume asymmetry on MRIs in nondemented elderly subjects carrying the apolipoprotein E-4 allele. Neurology. 1995;45:391–2. [DOI] [PubMed] [Google Scholar]
- 49.Tohgi H, Takahashi S, Kato E, et al. Reduced size of right hippocampus in 39- to 80-year-old normal subjects carrying the apolipoprotein E-4 allele. Neurosci Ltrs. 1997;236:21–4. [DOI] [PubMed] [Google Scholar]
- 50.Jack CR, Petersen RC, Xu YC, et al. Hippocampal atrophy and apolipoprotein E genotype are independently associated with Alzheimer's disease. Ann Neurol. 1998;43:303–10. [DOI] [PMC free article] [PubMed] [Google Scholar]
- 51.Plassman BL, Welsh-Bohmer KA, Bigler ED, et al. Apolipoprotein E-4 allele and hippocampal volume in twins with normal cognition. Neurology. 1997;48(4):985–9. [DOI] [PubMed] [Google Scholar]
- 52.Reiman EM, Uecker A, Caselli RJ, et al. Hippocampal volumes in cognitively normal persons at genetic risk for Alzheimer's disease. Ann Neurol. 1998;44:288–91. [DOI] [PubMed] [Google Scholar]
- 53.Wang JZ, Wiederhold G, Firschein O. System for screening objectionable images using Daubechies' wavelets and color histograms, interactive distributed multimedia systems and telecommunication services. In: Steinmetz R, Wolf LC (eds): Proceedings of the Interactive Distributed Multimedia Systems and Telecommunication Services, 4th International Workshop (IDMS '97); Darmstadt, Germany; September 10–12, 1997. New York: Springer-Verlag, 1997.
- 54.Neelin PD, MacDonald D, Collins DL, Evans AC. The MINC file format: from bytes to brains. NeuroImage. 1998;7(4):S786. [Google Scholar]
- 55.Strother SC, Anderson JR, Xu X-L, Low J-S, Boar DC, Rottenberg DA. Quantitative comparisons of image registration techniques based on high-resolution MRI of the brain. J Comput Assist Tomogr. 1994;18:954–62. [DOI] [PubMed] [Google Scholar]
- 56.Arnold JB, Liow J-S, Schaper KA, et al. Quantitative and qualitative evaluation of six algorithms for correcting intensity non-uniformity effects. NeuroImage. 2001, in press. [DOI] [PubMed]
- 57.Holmes CJ, Hoge R, Collins L, Woods R, Toga AW, Evans AC. Enhancement of magnetic resonance images using registration for signal averaging. J Comput Asst Tomogr. 1998; 22(2):324–33. [DOI] [PubMed] [Google Scholar]
- 58.Saunders JB, O'Malley CD. Illustrations from the Works of Andreas Vesalius of Brussels. New York: Dover Publications, 1950.
- 59.Wertheim SL. The brain database: a multimedia neuroscience database for research and teaching. Proc Annu Symp Comput Appl Med Care. 1989.
- 60.Spitzer V, Whitlock DG. High resolution imaging of the human body. Biol Photog. 1992;60(4):167–72. [PubMed] [Google Scholar]
- 61.Payne BA, Toga AW. Surface mapping brain function on 3D models. IEEE Comput Graph Appl. 1990;10(5):33–41. [Google Scholar]
- 62.Toga AW, Arnicar-Sulze TL. Digital image reconstruction for the study of brain structure and function. J Neurosci Methods. 1987;20:7–21. [DOI] [PubMed] [Google Scholar]
- 63.Toga AW, Goldkorn A, Ambach K, Chao K, Quinn BC, Yao P. Postmortem cryosectioning as an anatomic reference for human brain mapping. Comput Med Image Graphics. 1997; 21(2):131–41. [DOI] [PubMed] [Google Scholar]
- 64.Cannestra AF, Santori EM, Holmes CJ, Toga AW. A three-dimensional multimodality map of the nemistrina monkey. Brain Res Bull. 1997;5:147–53. [DOI] [PubMed] [Google Scholar]
- 65.Galaburda AM. La region de Broca: observations anatomiques faites un siecle apres la mort de son decoveur. Rev Neurologique. 1980;136:609–16. [PubMed] [Google Scholar]
- 66.Hayes TL, Lewis DA. Anatomical specialization of the anterior motor speech area: hemispheric differences in magnopyramidal neurons. Brain Language. 1995;49:289–308. [DOI] [PubMed] [Google Scholar]
- 67.Hayes TL, Lewis DA. Magnopyramidal neurons in the anterior motor speech region. Arch Neurol. 1996;53:1277–83. [DOI] [PubMed] [Google Scholar]
- 68.Jacobs B, Batal HA, Lynch B, Ojemann G, Ojemann LM, Scheibel AB. Quantitative dendritic and spine analysis of speech cortices: a case study. Brain Language. 1993;44: 239–53. [DOI] [PubMed] [Google Scholar]
- 69.Simonds RJ, Scheibel AB. The postnatal development of the motor speech area: a preliminary study. Brain Language. 1989;37:43–58. [DOI] [PubMed] [Google Scholar]
- 70.Scheibel AB, Paul LA, Fried I, et al. Dendritic organization of the anterior speech area. Exp Neurol. 1985;87:109–17. [DOI] [PubMed] [Google Scholar]
- 71.Merker B. Silver staining of cell bodies by means of physical development. J Neurosci. 1983;9:235–41. [DOI] [PubMed] [Google Scholar]
- 72.Amunts K, Schleicher A, Bürgel U, Mohlberg H, Uylings HBM, Zilles K. Broca's region revisited: cytoarchitecture and intersubject variability. J Comp Neurol. 1999;412:319–41. [DOI] [PubMed] [Google Scholar]
- 73.Schleicher A, Amunts K, Geyer S, Morosan P, Zilles K. Observer-independent method for microstructural parcellation of cerebral cortex: a quantitative approach to cytoarchitectonics. NeuroImage. 1999;9:165–77. [DOI] [PubMed] [Google Scholar]
- 74.Schormann T, Zilles K. Limitations of the principal axes theory. IEEE Trans Med Imag. 1997;16:942–7. [DOI] [PubMed] [Google Scholar]
- 75.Schormann T, Dabringhaus A, Zilles K. Statistics of deformations in histology and improved alignment with MRI. IEEE Trans Med Imag. 1995;14:25–35. [DOI] [PubMed] [Google Scholar]
- 76.Schormann T, Henn S, Zilles K. A new approach to fast elastic alignment with application to human brains. Lecture Notes Computer Science Series, vol. 1131. 1996:437–42.
- 77.Schormann T, Dabringhaus A, Zilles K. Extension of the principal axis theory for the determination of affine transformations. Informatik Aktuell. London, UK: Springer, 1997:384–91.
- 78.Schormann T, Zilles K. Three-dimensional ar and nonlinear transformations: an integration of light microscopical and MRI data. Hum Brain Mapp. 1998;6:339–47. [DOI] [PMC free article] [PubMed] [Google Scholar]
- 79.Amunts K, Klingberg T, Binkofski F, et al. Cytoarchitectonic definition of Broca's region and its role in functions different from speech. NeuroImage. 1998;7:8. [Google Scholar]
- 80.Sled J, Zijdenbos A, Evans A. A comparison of retrospective intensity non-uniformity correction methods for MRI. In: Duncan J (ed). Information Processing in Medical Imaging. Lecture Notes in Computer Science Series, vol. 1230. Heidelberg, Germany: Springer, 1997:459–64.
- 81.Sled J, Zijdenbos A, Evans A. A non-parametric method for automatic correction of intensity non-uniformity in MRI data. IEEE Trans Med Imag. 1998;17:87–97. [DOI] [PubMed] [Google Scholar]
- 82.Kamber M, Collins DL, Shinghal R, Francis GS, Evans AC. Model-based 3D segmentation of multiple sclerosis lesions in dual-echo MRI data. Proc SPIE Vis Biomed Comp. 1992;1808: 590–600. [Google Scholar]
- 83.Kamber M, Shinghal R, Collins DL, Francis GS, Evans AC. Model-based 3D segmentation of multiple sclerosis lesions in magnetic resonance brain images. IEEE Trans Med Imag. 1995;14(3):442–53. [DOI] [PubMed] [Google Scholar]
- 84.Zijdenbos AP, Evans AC, Riahi F, Sled JG, Chui H-C, Kollokian V. Automatic quantification of multiple sclerosis lesion volume using stereotaxic space. Proceedings of the 4th International Conference on Visualization in Biomedical Computing (VBC ‘96); Hamburg, Germany; Sep 22–25, 1996. Lecture Notes in Computer Science Series, vol 1131. Berlin, Germany: Springer-Verlag, 1996:439–48.
- 85.Collins DL, Neelin P, Peters TM, Evans AC. Automatic 3D registration of MR volumetric data in standardized Talairach space. J Comput Assist Tomogr. 1994;18(2):192–205. [PubMed] [Google Scholar]
- 86.Evans AC, Frank JA, Antel J, Miller DH. The role of MRI in clinical trials of multiple sclerosis: comparison of image processing techniques. Ann Neurol. 1997;41:125–32. [DOI] [PubMed] [Google Scholar]
- 87.Collins DL, Holmes CJ, Peters TM, Evans AC. Automatic 3D model-based neuroanatomical segmentation. Hum Brain Mapp. 1995;3:190–208. [Google Scholar]
- 88.Broit C. Optimal registration of deformed images [doctoral dissertation]. Philadelphia, Pa.: University of Pennsylvania, 1981.
- 89.Bajcsy R, Kovacic S. Multi-resolution elastic matching. Comput Vision Graphics Image Proc. 1989;46(1):1–21. [Google Scholar]
- 90.Gee JC, Reivich M, Bajcsy R. Elastically deforming an atlas to match anatomical brain images. J Comput Assist Tomogr. 1993;17(2):225–36. [DOI] [PubMed] [Google Scholar]
- 91.Gee JC, LeBriquer L, Barillot C, Haynor DR, Bajcsy R. Bayesian Approach to the Brain Image Matching Problem. Philadelphia, Pa.: Institute for Research in Cognitive Science, 1995. Technical report 95-08.
- 92.Seitz RJ, Bohm C, Greitz T, et al. Accuracy and precision of the computerized brain atlas programme for localization and quantification in positron emission tomography. J Cereb Blood Flow Metab. 1990;10:443–57. [DOI] [PubMed] [Google Scholar]
- 93.Thurfjell L, Bohm C, Greitz T, Eriksson L. Transformations and algorithms in a computerized brain atlas. IEEE Trans Nucl Sci. 1993;40(4):1167–91. [Google Scholar]
- 94.Ingvar M, Eriksson L, Greitz T, et al. Methodological aspects of brain activation studies: cerebral blood flow determined with [15O]butanol and positron emission tomography. J Cereb Blood Flow Metab. 1994;14(4):628–38. [DOI] [PubMed] [Google Scholar]
- 95.Geyer S, Ledberg A, Schleicher A, et al. Two different areas within the primary motor cortex of man. Nature. 1996;382: 805–7. [DOI] [PubMed] [Google Scholar]
- 96.Larsson J, Amunts K, Gulyás B, Malikovic A, Zilles K, Roland PE. Neuronal correlates of real and illusory contour perception: functional anatomy with PET. Eur J Neurosci. 1999;11: 4024–36. [DOI] [PubMed] [Google Scholar]
- 97.Naito E, Ehrsson HH, Geyer S, Zilles K, Roland PE. Illusory arm movements activate cortical motor areas: a positron emission tomography study. J Neurosci. 1999;19:6134–44. [DOI] [PMC free article] [PubMed] [Google Scholar]
- 98.Naito E, Kinomura S, Geyer S, Kawashima R, Roland PE, Zilles K. Fast reaction to different sensory modalities activates common fields in the motor areas, but the anterior cingulate cortex is involved in the speed of reaction. J Neurophysiol. 2000;83:1701–9. [DOI] [PubMed] [Google Scholar]
- 99.Bodegård A, Geyer S, Naito E, Zilles K, Roland PE. Somatosensory areas in man activated by moving stimuli: cytoarchitectonic mapping and PET. Neuroreport. 2000;11: 187–91. [DOI] [PubMed] [Google Scholar]
- 100.Bodegård A, Ledberg A, Geyer S, et al. Object shape differences reflected by somatosensory cortical activation in human. J Neurosci. 2000;20(RC51):1–5. [DOI] [PMC free article] [PubMed] [Google Scholar]
- 101.Friston KJ, Holmes AP, Worsley KJ, Po JP, Frith CD, Frackowiak RSJ. Statistical parametric maps in functional imaging: a general linear approach. Hum Brain Mapp. 1995;2: 189–210. [Google Scholar]
- 102.Christensen G, Rabbitt RD, Miller MI. A deformable neuroanatomy textbook based on viscous fluid mechanics [invited paper]. Proceedings of the 1993 Conference on Information Science Systems. Baltimore, Md.: Johns Hopkins University, 1993:211–6.
- 103.Christensen GE, Rabbitt RD, Miller MI. Deformable templates using large deformation kinematics. IEEE Trans Image Proc. 1996;5(10):1435–47. [DOI] [PubMed] [Google Scholar]
- 104.Thirion J-P. Fast Non-Rigid Matching of Medical Images [internal report]. Le Chesnay, France: INRIA, 1995. Report 2547.
- 105.Rabbitt RD, Weiss JA, Christensen GE, Miller MI. Mapping of hyperelastic deformable templates using the finite element method. Proc SPIE. 1995;2573:252–65. [Google Scholar]
- 106.Davatzikos C. Spatial normalization of 3D brain images using deformable models. J Comput Assist Tomogr. 1996; 20(4):656–65. [DOI] [PubMed] [Google Scholar]
- 107.Thompson PM, Toga AW. A surface-based technique for earping 3-dimensional images of the brain. IEEE Trans Med Imag. 1996;15(4):1–16. [DOI] [PubMed] [Google Scholar]
- 108.Bro-Nielsen M, Gramkow C. Fast fluid registration of medical images. Proceedings of the 4th International Conference on Visualization in Biomedical Computing (VBC ‘96); Hamburg, Germany; Sep 22–25, 1996. Lecture Notes in Computer Science Series, vol 1131. Berlin, Germany: Springer-Verlag, 1996:267–76.
- 109.Ashburner J, Neelin P, Collins DL, Evans A, Friston, K. Incorporating prior knowledge into image registration. NeuroImage. 1997;6(4):344–52. [DOI] [PubMed] [Google Scholar]
- 110.Woods RP, Grafton ST, Holmes CJ, Cherry SR, Mazziotta JC. Automated image registration, part I: General methods and intrasubject, intramodality validation. J Comput Assist Tomogr. 1998;22(1):139–52. [DOI] [PubMed] [Google Scholar]
- 111.Evans AC, Dai W, Collins DL, Neelin P, Marrett S. Warping of a computerized 3D atlas to match brain image volumes for quantitative neuroanatomical and functional analysis. SPIE Med Imag. 1991;1445:236–47. [Google Scholar]
- 112.Miller MI, Christensen GE, Amit Y, Grenander U. Mathematical Textbook of Deformable Neuroanatomies. Proc Natl Acad Sci USA. 1993;90:11944–8. [DOI] [PMC free article] [PubMed] [Google Scholar]
- 113.Sandor SR, Leahy RM. Matching deformable atlas models to pre-processed magnetic resonance brain images. Proceedings of the IEEE Conference on Image Processing. 1994;3:686–90. [Google Scholar]
- 114.Sandor SR, Leahy RM. Towards automated labeling of the cerebral cortex using a deformable atlas. In: Bizais Y, Barillot C, Di Paola R (eds). Proc 14th Int Conf Info Proc Med Imag. Amsterdam, The Netherlands: Wolters Kluwer, 1995:127–38.
- 115.Rizzo G, Gilardi MC, Prinster A, Grassi F, Scotti G, Cerutti S, et al. An elastic computerized brain atlas for the analysis of clinical PET/SPET data. Eur J Nucl Med. 1995;22(11):1313–8. [DOI] [PubMed] [Google Scholar]
- 116.Amunts K, Malikovic A, Mohlberg H, Schormann T, Zilles K. Brodmann's areas 17 and 18 brought into stereotaxic space - where and how variable? NeuroImage. 2000;11:66–84. [DOI] [PubMed] [Google Scholar]
- 117.Geyer S, Schleicher A, Zilles K. The somatosensory cortex of human: cytoarchitecture and regional distributions of receptor-binding sites. NeuroImage. 1997;6:27–45. [DOI] [PubMed] [Google Scholar]
- 118.Geyer S, Schleicher A, Zilles K. Areas 3a, 3b, and 1 of human primary somatosensory cortex, part 1: Microstructural organization and interindividual variability. NeuroImage. 1999;10: 63–83. [DOI] [PubMed] [Google Scholar]
- 119.Geyer S, Schormann T, Mohlberg H, Zilles K. Areas 3a, 3b, and 1 of human primary somatosensory cortex, part 2: Spatial normalization to standard anatomical space. NeuroImage. 2000;11(6 Pt 1):684–96. [DOI] [PubMed] [Google Scholar]
- 120.Thompson PM, Toga AW. Anatomically driven strategies for high-dimensional brain image warping and pathology detection. In: Toga AW (ed). Brain Warping: San Diego, Calif.: Academic Press, 1998:311–36.
- 121.Christensen GE, Rabbitt RD, Miller MI, et al. Topological properties of smooth anatomic maps. In: Bizais Y, Barillot C, Di Paola R (eds). Information Processing in Medical Imaging. June 1995:101–12.
- 122.Thompson PM, Toga AW. Detection, visualization and animation of abnormal anatomic structure with a deformable probabilistic brain atlas based on random vector field transformations. Med Image Anal. 1997;1(4):271–94. [DOI] [PubMed] [Google Scholar]
- 123.Thompson PM, Toga AW. Warping strategies for intersubject registration. In: Bankman I (ed). Handbook of Medical Image Processing. San Diego, Calif.: Academic Press, 2000:569–601.
- 124.Thompson PM, Woods RP, Mega MS, Toga AW. Mathematical/computational challenges in creating deformable and probabilistic atlases of the human brain. Hum Brain Mapp. 2000;9(2):81–92. [DOI] [PMC free article] [PubMed] [Google Scholar]
- 125.Thompson PM, Moussai J, Zohoori S, et al. Cortical variability and asymmetry in normal aging and Alzheimer's disease. Cereb Cortex. 1998;8:492–509. [DOI] [PubMed] [Google Scholar]
- 126.Thompson PM, Mega MS, Toga AW. Disease-specific brain atlases. In: Toga AW, Mazziotta JC, Frackowiak RSJ (eds). Brain Mapping: The Disorders. San Diego, Calif.: Academic Press, 2000:131–177.
- 127.Narr KL,Thompson PM, Sharma T, Moussai J, Cannestra AF, Toga AW. Mapping morphology of the corpus callosum in schizophrenia. Cereb Cortex. 2000;10(1):40–9. [DOI] [PubMed] [Google Scholar]
- 128.Sowell ER, Mattson SN, Thompson PM, Jernigan TL, Riley EP, Toga AW. Mapping callosal morphology and cognitive correlates: effects of heavy prenatal alcohol exposure. Neurology. 2001;57(2):235–44. [DOI] [PubMed] [Google Scholar]
- 129.Thompson PM, Giedd JN, Woods RP, MacDonald D, Evans AC, Toga AW. Growth patterns in the developing brain detected by using continuum mechanical tensor maps. Nature. 2000;404(6774):190–3. [DOI] [PubMed] [Google Scholar]
- 130.Mega MS, Chen S, Thompson PM, et al. Mapping pathology to metabolism: coregistration of stained whole brain sections to PET in Alzheimer's disease. NeuroImage. 1997;5:147–53. [DOI] [PubMed] [Google Scholar]
- 131.Le Goualher G, Argenti A, Duyme M, et al. Statistical sulcal shape comparisons: application to the detection of genetic encoding of the central sulcus shape. NeuroImage. 2000;11(5 Pt 1):564–74. [DOI] [PubMed] [Google Scholar]
- 132.Thompson PM, Schwartz C, Toga AW. High-resolution random mesh algorithms for creating a probabilistic 3D surface atlas of the human brain. NeuroImage. 1996;3:19–34. [DOI] [PubMed] [Google Scholar]
- 133.Thompson P, Schwartz C, Lin RT, Khan AA, Toga AW. Three-dimensional statistical analysis of sulcal variability in the human brain. J Neurosci. 1996;16(13):4261–74. [DOI] [PMC free article] [PubMed] [Google Scholar]
- 134.MacDonald D. A method for identifying geometrically simple surfaces from three-dimensional images [doctoral dissertation]. Montreal, Quebec, Canada: McGill University, 1998.
- 135. Zhou Y, Toga AW. Efficient skeletonization of volumetric objects. IEEE Trans Vis Comput Graph. 1999;5(3):196–209. [DOI] [PMC free article] [PubMed] [Google Scholar]
- 136.Pitiot A, Toga AW, Thompson PM. Spatially and temporally adaptive elastic template matching. IEEE Trans Med Imag. 2000, in press. [DOI] [PubMed]
- 137.Cao J, Worsley KJ. The geometry of the Hotelling's T2 random field with applications to the detection of shape changes. Ann Stat. 1999;27:925–42. [Google Scholar]
- 138.MacDonald D, Avis D, Evans AC. Multiple surface identification and matching in magnetic resonance imaging. Proceedings of SPIE Conference on Visualization in Biomedical Computing. 1994;2359:160–9. [Google Scholar]
- 139.MacDonald D, Kabani N, Avis D, Evans AC. Automated 3D extraction of inner and outer surfaces of cerebral cortex from MRI. NeuroImage. 2000, in press. [DOI] [PubMed]
- 140.Harmony T, Fernandez T, Silva J, et al. Do specific EEG frequencies indicate different processes during mental calculation? Neurosci Ltrs. 1999;266(1):25–8. [DOI] [PubMed] [Google Scholar]
- 141.Le Goualher G, Procyk E, Collins DL, Venugopal R, Barillot C, Evans AC. Automated extraction and variability analysis of sulcal neuroanatomy. IEEE Trans Med Imaging. 1999;18(3):206–17. [DOI] [PubMed] [Google Scholar]
- 142.Talairach J, Tournoux P. Coplanar stereotaxic atlas of the human brain. Stuttgart, Germany: Thieme, 1988.
- 143.Lancaster JL, Rainey LH, Summerlin JL, et al. Automated labeling of the human brain: a preliminary report on the development and evaluation of a forward-transform method. Hum Brain Mapp. 1997;5(4):238–42. [DOI] [PMC free article] [PubMed] [Google Scholar]
- 144.Carman GJ, Drury HA, Van Essen DC. Computational methods for reconstructing and unfolding the cerebral cortex. Cereb Cortex 1995;5(6):506–17. [DOI] [PubMed] [Google Scholar]
- 145.Felleman D, Van Essen D. Distributed hierarchical processing in the primate cerebral cortex. Cereb Cortex. 1991;1:1–47. [DOI] [PubMed] [Google Scholar]
- 146.Van Essen DC, Drury HA. Structural and functional analyses of human cerebral cortex using a surface-based atlas. J Neurosci. 1997;17(18):7079–102. [DOI] [PMC free article] [PubMed] [Google Scholar]
- 147.Van Essen DC, Drury HA, Joshi S, Miller MI. Functional and structural mapping of human cerebral cortex: solutions are in the surfaces. Proc Natl Acad Sci USA. 1998;95(3):788–95. [DOI] [PMC free article] [PubMed] [Google Scholar]
- 148.Dale AM, Fischl B, Sereno MI. Cortical surface-based analysis, part I: Segmentation and surface reconstruction. NeuroImage. 1999;9(2):179–94. [DOI] [PubMed] [Google Scholar]
- 149.Fischl B, Sereno MI, Tootell RB, Dale AM. High-resolution intersubject averaging and a coordinate system for the cortical surface. Hum Brain Mapp. 1999;8(4):272–84. [DOI] [PMC free article] [PubMed] [Google Scholar]
- 150.Penhune VB, Zatorre RJ, MacDonald JD, Evans AC. Interhemispheric anatomical differences in human primary auditory cortex: probabilistic mapping and volume measurement from MR scans. Cerebr Cortex. 1996;6(5):617–72. [DOI] [PubMed] [Google Scholar]
- 151.Paus T, Otaky N, Caramanos Z, et al. In-vivo morphometry of the intrasulcal -matter in the human cingulate, paracingulate and superior-rostral sulci: hemispheric asymmetries, gender differences, and probability maps. J Comp Neurol. 1996;376:664–73. [DOI] [PubMed] [Google Scholar]
- 152.Paus T, Tomaiuolo F, Otaky N, et al. Human cingulate and paracingulate sulci: pattern, variability, asymmetry, and probabilistic map. Cereb Cortex. 1996b6:207–14. [DOI] [PubMed] [Google Scholar]
- 153.Evans AC, Collins DL, Holmes CJ. Automatic 3D regional MRI segmentation and statistical probability anatomy maps. In: Myers R, Cunningham V, Bailey D, Jones T (eds). Quantification of Brain Function Using PET. San Diego, Calif.: Academic Press, 1996:123–30.
- 154.van der Knaap MS, Valk J. MR imaging of the various stages of normal myelination during the first year of life. Neuroradiology. 1990;31(6):459–70. [DOI] [PubMed] [Google Scholar]
- 155.Jernigan TL, Tallal P. Late childhood changes in brain morphology observable with MRI. Dev Med Child Neurol. 1990;32(5):379–85. [DOI] [PubMed] [Google Scholar]
- 156.Pfefferbaum A, Mathalon DH, Sullivan EV, Rawles JM, Zipursky RB, Lim KO. A quantitative magnetic resonance imaging study of changes in brain morphology from infancy to late adulthood. Arch Neurol. 1994;51(9):874–87. [DOI] [PubMed] [Google Scholar]
- 157.Pujol J, Vendrell P, Junqué C, Martí-Vilalta JL, Capdevila A. When does human brain development end? Evidence of corpus callosum growth up to adulthood. Ann Neurol. 1993;34(1):71–5. [DOI] [PubMed] [Google Scholar]
- 158.Giedd JN, Rumsey JM, Castellanos FX, et al. A quantitative MRI study of the corpus callosum in children and adolescents. Brain Res Dev Brain Res. 1996;91(2):274–80. [DOI] [PubMed] [Google Scholar]
- 159.Caviness VS Jr, Kennedy DN, Richelme C, Rademacher J, Filipek PA. The human brain age 7–11 years: a volumetric analysis based on magnetic resonance images. Cereb Cortex. 1996;6(5):726–36. [DOI] [PubMed] [Google Scholar]
- 160.Reiss AL, Abrams MT, Singer HS, Ross JL, Denckla M. Brain development, gender and IQ in children: a volumetric imaging study. Brain. 1996;119(5):1763–74. [DOI] [PubMed] [Google Scholar]
- 161.Giedd JN, Snell JW, Lange N, et al. Quantitative magnetic resonance imaging of human brain development: ages 4–18. Cereb Cortex. 1996;6(4):551–60. [DOI] [PubMed] [Google Scholar]
- 162.Giedd JN, Blumenthal J, Jeffries NO, et al. Brain development during childhood and adolescence: a longitudinal MRI study. [letter]. Nature Neurosci. 1999;2(10):861–3. [DOI] [PubMed] [Google Scholar]
- 163.Paus T, Zijdenbos A, Worsley K, et al. Structural maturation of neural pathways in children and adolescents: in vivo study. Science. 1999;283(5409):1908–11. [DOI] [PubMed] [Google Scholar]
- 164.Sowell ER, Thompson PM, Holmes CJ, Jernigan TL, Toga AW. Progression of structural changes in the human brain during the first three decades of life: in vivo evidence for post-adolescent frontal and striatal maturation. Nature Neurosci. 1999;2(10):859–61. [DOI] [PubMed] [Google Scholar]
- 165.Sowell ER, Thompson PM, Holmes CJ, Batth R, Jernigan TL, Toga AW. Localizing age-related changes in brain structure between childhood and adolescence using statistical parametric mapping. NeuroImage. 1999;9:587–97. [DOI] [PubMed] [Google Scholar]
- 166.Worsley KJ, Andermann M, Koulis T, MacDonald D, Evans AC. Detecting changes in nonisotropic images. Hum Brain Mapp. 1999;8(2/3):98–101. [DOI] [PMC free article] [PubMed] [Google Scholar]
- 167.Haney S, Thompson P, Cloughesy T, et al. Mapping therapeutic response in a patient with malignant glioma. J Comput Assist Tomogr. 2001;25(4):529–36. [DOI] [PubMed] [Google Scholar]
- 168.Chung MK, Worsley KJ, Cherif C, et al. Statistical analysis of local volume change, with an application to brain growth. NeuroImage. 2000;11:S611. [Google Scholar]
- 169.Sharma T, Kerwin R. Biological determinants of difficult to treat patients with schizophrenia. Br J Psychiaty. 1996;169:5–9. [PubMed] [Google Scholar]
- 170.Nasrallah HA, Andreasen NC, Coffman JA, et al. A controlled magnetic resonance imaging study of corpus callosum thickness in schizophrenia. Biol Psychiatry. 1986;21: 3:274–82. [DOI] [PubMed] [Google Scholar]
- 171.Uematsu M, Kaiya H. The morphology of the corpus callosum in schizophrenia: a MRI study. Schizophr Res. 1988;1:391–8. [DOI] [PubMed] [Google Scholar]
- 172.Rossi A, Stratta P, Gallucci M, Passariello R, Casacchia M. Quantification of corpus callosum and ventricles in schizophrenia with nuclear magnetic resonance imaging: a pilot study. Am J Psychiatry. 1989;146:99–101. [DOI] [PubMed] [Google Scholar]
- 173.Woodruff PW, Pearlson GD, Geer MJ, Barta PE, Chilcoat HD. A computerized magnetic resonance imaging study of corpus callosum morphology in schizophrenia. Psychol Med. 1993;23(1):45–56. [DOI] [PubMed] [Google Scholar]
- 174.Woodruff PW, Phillips ML, Rushe T, Wright IC, Murray RM, David AS. Corpus callosum size and inter-hemispheric function in schizophrenia. Schizophr Res. 1997;23(3):189–96. [DOI] [PubMed] [Google Scholar]
- 175.Jacobsen LK, Giedd JN, Rajapakse JC, et al. Quantitative magnetic resonance imaging of the corpus callosum in childhood onset schizophrenia. Psychiatry Res. 1997;68(2–3):77–86. [DOI] [PubMed] [Google Scholar]
- 176.Woodruff PWR, McManus IC, David AS. Meta-analysis of corpus callosum size in schizophrenia. J Neurol Neurosurg Psychiatry. 1995;58:457–61. [DOI] [PMC free article] [PubMed] [Google Scholar]
- 177.Casanova MF, Sanders RD, Goldberg TE, et al. Morphometry of the corpus callosum in monozygotic twins discordant for schizophrenia: a magnetic resonance imaging study. J Neurol Neurosurg Psychiatry. 1990;53:416–21. [DOI] [PMC free article] [PubMed] [Google Scholar]
- 178.DeQuardo JR, Bookstein FL, Green WD, Brunberg JA, Tandon R. Spatial relationships of neuroanatomic landmarks in schizophrenia. Psychiatry Res. 1996;61:81–95. [PubMed] [Google Scholar]
- 179.Flaum M, Swayze VW, O'Leary DS, et al. Effects of diagnosis, laterality, and gender on brain morphology in schizophrenia. Am J Psychiatry. 1995;152:5:704–14. [DOI] [PubMed] [Google Scholar]
- 180.Lawrie SM, Abukmeil SS. Brain abnormality in schizophrenia. Br J Psychiatry. 1998;172:110–20. [DOI] [PubMed] [Google Scholar]
- 181.Rademacher J, Galaburda A, Kennedy D, Filipek P, Caviness V. Human cerebral cortex: localization, parcellation, and morphometry with magnetic resonance imaging. J Cogn Neurosci. 1992;4:352–74. [DOI] [PubMed] [Google Scholar]
- 182.Huerta M, Koslow S, Leshner A. The Human Brain Project: an international resource. Trends Neurosci. 1993;16:436–8. [DOI] [PubMed] [Google Scholar]