

Abstract
Planning the clinical evaluation of a computerized decision support system requires a strategy that encompasses the different aspects of the clinical problem, the technical difficulties of software and hardware integration and implementation, the behavioral aspects of the targeted users, and the discip of study design. Although clinical information systems are becoming more widely available, only a few decision support systems have been formally evaluated in clinical environments. Published accounts of difficulties associated with the clinical evaluation of decision support systems remain scarce. The authors report on a variety of behavioral, logistical, technical, clinical, cost, and work flow issues that they had to address when choosing a study design for a clinical trial for the evaluation of an integrated, real-time decision support system for the automatic identification of patients likely to have pneumonia in an emergency department. In the absence of a true gold standard, they show how they created a credible, clinically acceptable, and economical reference standard for the diagnosis of pneumonia, to determine the overall accuracy of the system. For the creation of a reference standard, they describe the importance of recognizing verification bias and avoiding it. Finally, advantages and disadvantages of different study designs are explored with respect to the targeted users and the clinical setting.
The development and evaluation of diagnostic decision support systems (DDSSs) remains an active and challenging area of research. Several DDSSs have demonstrated promising diagnostic performances in formal evaluations.1–4 However, the majority of diagnostic systems have not been evaluated in a clinical environment. Others have been evaluated on a limited set of patients only. The few prospectively evaluated clinical systems were stand-alone diagnostic systems3,4 and were not integrated into clinical information systems.
Stand-alone DDSSs depend heavily on users to enter data. They generally include data elements that are not routinely documented in the clinical information system during a patient's encounter or are not captured in an easily computable format. The requirement for additional, sometimes redundant data entry and the time constraints during a patient encounter prevent health care providers from applying the diagnostic information in routine patient care.
Integrating a DDSS into an existing clinical information system and into the work flow of busy clinicians reduces or eliminates redundant data entry and supports the incorporation of DDSS information into the clinician's work flow. Integration provides an opportunity to apply the diagnostic information in a variety of computerized clinical applications. For example, the diagnostic information might be applied to trigger disease-specific guides without the need for a clinician to intervene to identify applicable patients. Clinicians may consider automatically displayed guideline information more often because the information is accessible with little effort.
The need to evaluate diagnostic accuracy exists for both stand-alone and integrated DDSSs. However, the clinical evaluation of an integrated DDSS presents additional challenges that do not exist or that have less impact on the evaluation of a stand-alone DDSS. Examples of factors that can affect the utility of an integrated DDSS include the quality of data from a clinical information system, how and when these data are available to the DDSS, and when and where the DDSS information is delivered to clinicians. Identifying the factors that may influence the clinical integration of a DDSS is an important step in designing a clinical evaluation. Unfortunately, there are few published reports of experiences in designing studies that prospectively evaluate integrated real-time DDSSs in clinical settings.
In this paper we describe the development of the study design for a prospective clinical evaluation of a real-time, integrated DDSS for patients with community-acquired pneumonia. First, we describe the clinical setting and the functional characteristics of the population-based DDSS. We address the difficulties in establishing a clinically acceptable reference standard to determine the system's overall accuracy, and highlight the importance of recognizing the presence of verification bias. We illustrate the trade-offs made in choosing a clinical characteristic, such as a patient's chief complaint, as a preselection mechanism for increasing the number of patients who have the target disease. We describe the advantages and disadvantages of different study design alternatives and explain why we selected particular alternatives. We also discuss how the clinical setting and certain user practices of interacting with the clinical information system affected the study design of the evaluation.
A Computerized Diagnostic Decision Support System for Pneumonia
We developed and implemented a pneumonia DDSS for use in the emergency department (ED) of LDS Hospital, a 520-bed university-affiliated tertiary care center in Salt Lake City, Utah.5,6 Our main objective was to develop a real-time process that automatically identifies ED patients who present with findings suggestive of pneumonia. When such patients are identified, the system triggers the computerized evaluation of the pneumonia guide. The system consists of a diagnostic and a disease management component. The diagnostic component is based on a probabilistic algorithm (Bayesian network) that computes a probability of pneumonia. The disease management component consists of the pneumonia severity-of-illness index (PSI) , which is computed for patients likely to have pneumonia. The PSI calculates a risk score based on 20 routinely available, computer-charted variables in the ED, and stratifies patients into five risk classes.7 The PSI risk classes can be applied to support clinicians in the admission decision.7,8
To eliminate additional data entry and allow a high level of integration into the clinical information system, the DDSS was developed with data elements that were routinely collected during the patient's ED encounter. In addition, almost all data elements required for the PSI were routinely captured and stored in our clinical information system. Prior to system implementation, the accuracy of the PSI was assessed when data elements from the clinical information system were used. It was determined that the system identified an accurate risk class for 86 percent of patients admitted with pneumonia.9 Taking advantage of routinely available data elements in the clinical information system allows the decision support system to update and display the probability for pneumonia and the PSI risk class information without intervention by busy clinicians. The DDSS identifies patients likely to have pneumonia and supports the automatic delivery of the PSI information at the point and time of care.
The ED main screen displays a list of current ED patients and represents the most common entry point for charting and accessing patient information (Figure 1▶). In addition to basic patient information, such as patient name, vital signs, and the availability of laboratory values or dictated reports, a dedicated column provides space for the results of protocols. Displaying the pneumonia-related information on the top-level ED screen ensures that the information is available and can be easily located and seen by clinicians.
Figure 1.
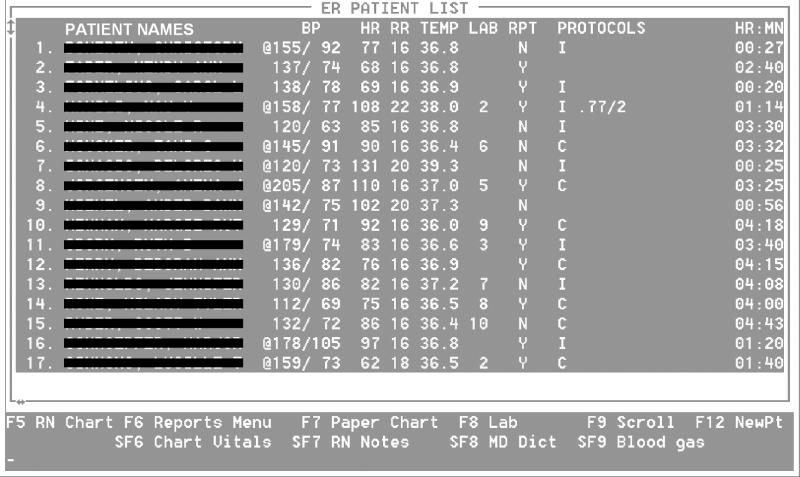
The main emergency department screen is the most common entry screen for reviewing and charting patient information. The patient names are accompanied by the main vital signs and the number of available laboratory reports (LAB column) and dictated hospital reports (RPT column). Abnormal vital signals are flagged in the first column (by @), and the respective values are displayed in a different color on the screen. The last column (PROTOCOLS) shows the pneumonia probability and the pneumonia severity index. For the evaluation study, the letter “I” informs users that the patient is assigned to the intervention group, in which DDSS information might become available during the patient's encounter. For patients assigned to the comparison group (“C”), no information is available, even if the patient has pneumonia or a high pneumonia probability. Among the patients whose details appear here, the pneumonia information is available for one patient of the intervention group, indicating a 77 percent probability of pneumonia and pneumonia risk class 2.
The clinical information system is used to display a patient's probability of pneumonia and the respective PSI. On the clinical information system, however, the ED staff members cannot obtain more detailed information about the pneumonia probability or the PSI. More detailed information is available on a separate, dedicated computer in the ED. Using the dedicated computer, ED physicians who are interested in the variables involved in calculating the pneumonia probability or the PSI can review, add, correct, or delete patient information. If the physicians make changes, the system immediately updates the probability and the risk mortality, reflecting the changes in the patient's findings.
The Influence of Disease Prevalence
The disease prevalence at the developing site influences directly the diagnostic characteristics of a decision aid.10,11 The disease prevalence appears to influence the positive and negative predictive values more than the sensitivity and the specificity of a test.12 For clinical purposes, the predictive values are more useful because they inform the clinicians about the expected proportion of diseased patients when a test is positive (or negative).
Although tests that are applied in low-prevalence diseases can yield relatively high sensitivity and high specificity, the positive predictive value usually remains moderate. The moderate positive predictive value results from the heavily unbalanced distribution of the cell frequencies in a 2 × 2 contingency table. With decreasing disease prevalence the distribution in a 2 × 2 table becomes even more unbalanced. Table 1▶ shows how different levels of disease prevalence influence the predictive values if sensitivity and specificity are kept constant.
Table 1 ▪.
Influence of Disease Prevalence on Test Characteristic with Constant Sensitivity (90%) and Specificity (75%).
| Disease Present | Disease Absent | Total | ||
|---|---|---|---|---|
| Disease prevalence 20.0%, positive predictive value 47.4%, negative predictive value 96.8%: | Test positive | 180 | 200 | 380 |
| Test negative | 20 | 600 | 620 | |
| Total | 200 | 800 | 1000 | |
| Disease prevalence 10.0%, positive predictive value 28.6%, negative predictive value 98.5%: | Test positive | 90 | 225 | 315 |
| Test negative | 10 | 675 | 685 | |
| Total | 100 | 900 | 1000 | |
| Disease prevalence 2.0%, positive predictive value 6.8%, negative predictive value 99.7%: | Test positive | 18 | 245 | 263 |
| Test negative | 2 | 735 | 737 | |
| Total | 20 | 980 | 1000 |
The prevalence of pneumonia in our ED population averages about 1.7 percent and fluctuates with seasonal changes. During the winter months, pneumonia affects patients more frequently and the disease prevalence may substantially increase (2.7 percent in our setting). During the summer months, pneumonia is less frequently seen and the prevalence may be low (0.8 percent in our setting).
It was our goal to develop a DDSS that operated like a screening test and would be able to identify patients with pneumonia from an unrestricted population, such as the entire ED population. Because we chose to develop a system that could be applied to an entire population, the disease prevalence was small and, consequently, a moderately low positive predictive value for the DDSS was found during the development phase.
The low positive predictive value of the DDSS had implications for the display of PSI guide information. The PSI information was expected to be displayed for many patients who did not have pneumonia but did have a disease with similar clinical presentation, such as acute bronchitis, congestive heart failure, or pulmonary embolism. We discussed the low positive predictive value with the ED physicians. For clinical purposes they considered the low positive predictive value acceptable, particularly since the DDSS information was displayed automatically and did not require additional data entry. The ED physicians preferred an automatic approach with lower predictive power to an approach that had higher predictive power but required data entry.
Influence of Preselection Criteria
A possible method to increase the low positive predictive value and reduce unnecessary information consists of using a prescreening factor that reduces the number of patients from the underlying population. Depending on the test characteristics, however, the limitation of eligible patients based on the prescreening factor might show no or even an opposite effect. If an increase in the positive predictive value is achieved, introducing a selection criterion may come at the cost of selection bias and the obtained results are limited to the prescreened subpopulation. In addition, preselection of patients on the basis of certain clinical criteria may limit the population to patients with typical findings of the disease.
Typical findings for patients with pneumonia include a respiratory complaint, fever, and cough. However, pneumonia is a frequent disease in the elderly population and elderly patients often do not present with the typical findings.13 Elderly patients may not have a fever or a cough but may have a change in mental status, a syncopal episode, or general malaise. Other patients may complain of abdominal pain or headache. The diagnostic challenges occur in the patients with atypical findings, and clinicians might be expected to benefit from a DDSS most in these cases. Even though a DDSS might perform extremely well in patients with the typical respiratory chief complaint, clinicians rarely need diagnostic support for such patients.
We examined whether use of patients' chief complaints as a preselection criterion influenced the positive predictive value of our system. In our historical data set, the most frequent chief complaint (for 55 percent of patients with pneumonia) was a respiratory symptom. However, patients with pneumonia may have numerous other chief complaints (Table 2▶). Eleven other chief complaints were given by 40 percent of patients with pneumonia, and 14 additional chief complaints were given by the remaining 5 percent.
Table 2 ▪.
Comparison Between the Frequencies of Chief Complaints for Pneumonia and All Emergency Department Patients, in Decreasing Order of Occurrence
| Chief Complaint | Patients with Pneumonia |
All ED Patients |
||
|---|---|---|---|---|
| Abs. % | Cumul. % | Abs. % | Cumul. % | |
| Respiratory | 54.7 | 54.7 | 10.4 | 10.4 |
| Fever | 14.5 | 69.2 | 3.4 | 13.8 |
| Chest pain | 10.9 | 80.1 | 14.1 | 27.9 |
| Abdominal | 3.0 | 83.1 | 8.1 | 36.0 |
| Neurologic | 2.4 | 85.5 | 4.9 | 40.9 |
| Abdominal pain | 2.2 | 87.7 | 18.1 | 58.9 |
| Falls | 1.6 | 89.3 | 8.6 | 67.6 |
| Weak(ness) | 1.6 | 90.9 | 0.9 | 68.5 |
| Body aches | 1.4 | 92.4 | 0.8 | 69.3 |
| Temperature related | 1.0 | 93.4 | 0.2 | 69.5 |
| Cardiovascular | 1.0 | 94.4 | 3.1 | 72.6 |
| Ear/nose/throat | 1.0 | 95.4 | 3.2 | 75.8 |
Note: Abs. indicates absolute; Cum.ul., cumulative.
Preselecting patients on the basis of their chief complaints did not increase the positive predictive value but did have an opposite effect on the specificity and the negative predictive value of the DDSS (Table 3▶). We believed that the diagnostic information would be useful for patients with uncommon and less frequent chief complaints, such as abdominal pain, headache, or weakness. For patients presenting with typical pneumonia findings, we assumed that the busy ED physicians would focus their attention on the PSI risk class information rather than the diagnostic information. In these instances, the diagnostic information enables the automatic identification of patients likely to have pneumonia and facilitates the delivery of pneumonia-specific guide information.
Table 3 ▪.
Influence on Test Characteristics Using Different Sets of Chief Complaints as Preselection Criteria
| Patients with Pneumonia Included (%) | Pneumonia Prevalence (%) | Positive Predictive Value (%) | Negative Predictive Value (%) | Specificity (%) | |
|---|---|---|---|---|---|
| Most frequent chief complaint | 55 | 10.4 | 15.5 | 98.8 | 44.4 |
| Three most frequent chief complaints | 80 | 6.2 | 14.8 | 99.6 | 67.6 |
| Eight most frequent chief complaints | 91 | 2.9 | 13.1 | 99.8 | 83.1 |
| All chief complaints | 100 | 1.7 | 13.1 | 99.9 | 90.7 |
Note: Depending on which chief complaints were included in the four different sets, the number of included patients with and without pneumonia varied. For each set, the sensitivity level was set at 95% and the respective test characteristics computed.
Evaluation Challenges: Reference Standard and Verification Bias
For the prospective clinical evaluation of the DDSS, we were faced with two important problems. The first problem is well recognized and concerns the creation of a solid and credible reference standard for pneumonia. The second problem, the need to avoid verification bias, is less frequently recognized and addressed in evaluation studies.
Reference Standard
We developed the DDSS using historical data from more than 32,000 ED patients at LDS Hospital. For the DDSS development we identified patients with pneumonia by ICD-9-CM discharge diagnosis, the most feasible and economical source of diagnostic information. We recognized, however, that diagnostic information obtained from claims data are known to be imperfect and imprecise for clinical purposes,14,15 including the evaluation of a DDSS in a clincal setting.
No objective criteria exist for the diagnosis of pneumonia, such as those for the diagnosis of an acute myocardial infarction.4 The most frequently applied criteria for pneumonia are the presence of a clinical finding suggestive of pneumonia and the identification of a new infiltrate on a chest x-ray during a patient's initial presentation.7 However, there is observer variation in physical examination and radiologic interpretation.16,17 A positive microbiology culture is a strong indicator of the presence of pneumonia, but a negative microbiology result does not indicate the absence of the disease. The microbiologic cause remains unknown in 94.3 percent of outpatients and in 71.4 percent of inpatients.18 Even if findings that meet more rigorous criteria, such as the histologic analysis of lung tissue, are available, pathologists may disagree about the presence of pneumonia.19
In addition, in several clinical situations a pneumonia diagnosis may be confirmed even though none of these criteria are met. For example, a pneumonic infiltrate may not be present on the day of presentation but may appear the following day, or a pneumonic infiltrate in the lower lung lobes may be diagnosed on an abdominal film or a chest computer tomogram. Clinicians may choose not to perform a chest x-ray if other radiologic examinations provide adequate evidence of an infiltrate.
The presence of a gold standard diagnosis forms the backbone of a DDSS evaluation. The best available gold standard is definitely preferred, but it may be difficult and expensive to obtain. In medical informatics, the adoption of a “silver” reference standard that is feasible, economical, and ethical is sometimes necessary.20 If the definition of a silver reference standard becomes necessary for the evaluation of a decision support system in a clinical setting, the standard should at least be clinically acceptable. For some diseases, such as pneumonia, the lack of objective criteria necessitates the use of more subjective measures. The creation of a reference standard for pneumonia must therefore include subjective physicians' judgments.
Verification Bias
When planning the development of a reference standard, evaluators must avoid introducing verification bias. Verification bias occurs when patients are selected for evaluation by the reference standard procedure on the basis of the likelihood that they have a certain disease status. Selecting patients for verification of disease status because they have a positive test result introduces bias. Patients with a negative test may not undergo the gold standard procedure, and their true disease status may remain unknown.21,22 The disease status of all patients in the study population needs to be confirmed by the gold standard procedure, independent of previous test results.
An example of verification bias is the work-up of patients in whom pulmonary embolism is suspected. To assess the test characteristics of ventilation-perfusion scans for identifying patients with pulmonary embolism, pulmonary angiography was commonly used as the gold standard procedure to verify the disease status. Pulmonary angiography has greater risks for patients than ventilation-perfusion scans. If only patients with positive ventilation-perfusion scans undergo pulmonary angiography, verification bias is present, because not all patients have an equal chance of being submitted to the gold standard procedure; that is, the disease status of patients with a negative ventilation-perfusion scan is not verified and is assumed to be negative. But it is possible that a negative ventilation-perfusion scan is a false-negative result and that pulmonary embolism is present but was not detected by the scan. In such cases, patients are classified as not having pulmonary embolism and their disease status is not verified by pulmonary angiography, the chosen gold standard for pulmonary embolism. To avoid verification bias, all patients with suspected pulmonary embolism need to be submitted to both the test (ventilation-perfusion scan) and the gold standard (pulmonary angiography). In such a design, the test characteristics of ventilation-perfusion scans can be determined exactly.
Verification bias may influence outcome measures considerably by either inflating the sensitivity and deflating the specificity or vice versa. Verification bias can be avoided when all study patients are selected for the gold standard procedure independently of the outcome of the test being evaluated, results of which may be available before the results of the gold standard procedure. In studies with verification bias, a correction procedure can be applied if test and gold standard information about a subset of consecutive patients is available.21 In diseases with assured clinical manifestation (e.g., appendicitis), verification bias can be avoided by following up patients whose disease status is assumed to be negative.
For the evaluation of the pneumonia DDSS, verification bias was initially present in a subtle way. In the historical data set, patients with pneumonia were identified using ICD-9-CM codes as diagnostic information. Accepting ICD-9-CM codes as a reference standard for the diagnosis of pneumonia has the advantage that every ED patient is assigned a diagnostic code. Having a code for all patients divides the population into patients with and without pneumonia. Because every patient is categorized applying the same criterion (ICD-9-CM code) verification bias is not present.
However, as mentioned above, a well-documented disadvantage of ICD codes is inaccuracies in the coding procedure. To improve the accuracy of coding, cases with an ICD-9-CM code of pneumonia could be submitted to physicians for an in-depth review. This approach, however, introduces verification bias because not all ED patients have an equal chance to obtain the reference standard verification in the form of an in-depth review. Patients with pneumonia and ICD-9-CM codes different from the pneumonia code would be completely missed. Verification bias would be present because we would select patients on the basis of the test (the ICD-9-CM code) and not on the basis of the patient's disease (pneumonia). The DDSS evaluation would yield an inaccurate sensitivity and specificity.
Because we used ICD-9-CM codes to identify pneumonia cases in the historical data set, verification bias existed for the development phase and the results have to be interpreted with caution.
Creating a Reference Standard for Pneumonia
Unconditional review of all ED patients during the study period prevents verification bias. In our ED, 60 to 70 patients are treated daily and a detailed review of each patient's chart was not feasible, because of our limited financial and personnel resources. Before performing the prospective study, we sought a method that both controlled effectively for verification bias and was feasible within the limits of our resources. We defined a three-step process that verified the disease status of ED patients. The goal of the three-step review process was to apply in each step an increasingly stringent procedure that safely excluded patients with a very remote chance of pneumonia from further review.
Pneumonia Reference Standard: Step 1
In the first step, we used the absence of five criteria to exclude patients: 1) the patient's chief complaint, 2) the presence of a radiology chest examination, 3) the patient's ICD-9-CM codes on admission and discharge, 4) the pneumonia probability computed by the DDSS, and 5) a keyword search. Singly or in combination, these criteria could introduce verification bias when used as inclusion criteria; however, we used the absence of all criteria to exclude patients from further review. It is highly improbable that a patient with pneumonia would not meet any one of the five criteria.
The chief complaint is part of the triage assessment, and ED nurses enter it in a coded format for more than 98 percent of patients. Using our development data set, we identified all the chief complaints of previous patients with pneumonia. All ED patients with these chief complaints were retained for our reference standard. We also included all ED patients on whom chest radiology examinations were performed, including patients whose chief complaints were not found in the historical data set. Furthermore, we included all patients who had ICD-9-CM diagnoses of pneumonia on admission or discharge. Patients with a probability of pneumonia of more than 1 percent, as computed by the DDSS, were also included.
Finally, we performed a keyword search of the ED physicians' reports (including ED follow-up reports) and hospital admission and discharge reports. We included all patients who had any reports that included the term “pneumonia.” On the basis of analysis of our historical data set, we estimated that up to 73 percent of the ED patients could be excluded on the basis of the first step (Table 4▶). The actual exclusion rate (66.7 percent) was slightly lower.
Table 4 ▪.
Comparison Between Estimated and Actual Accrual Rates
| Estimated Rate |
Actual Rate |
|||
|---|---|---|---|---|
| Absolute | % | Absolute | % | |
| Patients in study | 9,300 | 10,863 | ||
| Patients with pneumonia | 155* | 1.7 | 273† | 2.5 |
| Patients per day | 63 | 70 | ||
| Patients in study period | 147 | 155 | ||
| Patients in physician review for reference standard: Step 2 | 2,500 | 26.9 | 3,618 | 33.3 |
| Patients in physician review for reference standard: Step 3 | 490 | 5.3 | 838 | 7.7 |
*Pneumonia diagnosis based on ICD-9-CM codes.
†Pneumonia diagnosis based on clinical review.
Pneumonia Reference Standard: Step 2
In the second step, a group of five physicians read the ED physicians' reports and the radiologists' reports of the chest examinations. The group included a second-year resident, two third-year residents, and two board-certified internists. The reviewers did not know what criteria were applied to cases to be reviewed. The reviewer's task was to exclude from further classification efforts those patients who had no chance of having pneumonia. However, the physicians were instructed not to make a decision about whether pneumonia was actually present. We estimated that the second step would reduce the number of patients to be reviewed in the third step by an additional 21.6 percent (Table 4▶). The actual elimination rate in step 2 was 25.6 percent.
Pneumonia Reference Standard: Step 3
Patients not excluded from further review in the second step were thoroughly reviewed in the third step. The third step involved review of patients' charts and radiology images by physicians who were board-certified in pulmonary and critical care medicine. At least two different physicians reviewed each patient's information. If the two reviewers disagreed, a third physician reviewed the case. The majority vote decided whether pneumonia was present or absent.
The reviewers determined not only whether pneumonia was present or absent but also the type of pneumonia, according to established criteria.23 The types of pneumonia included community-acquired pneumonia, hospital-acquired pneumonia, pneumonia in an immuno-compromised patient, suspected aspiration pneumonia, pneumonia due to tuberculosis, and post-obstructive pneumonia due to malignancy.
We estimated that about 5 percent of all study cases would remain to be reviewed in the last step, which represented about three times the number of expected patients with pneumonia. The physicians actually reviewed the cases of 7.7 percent of the entire study population in the third step. A summary of estimated and actual rates is shown in Table 4▶. In the last step two reviewers agreed on the presence or absence of pneumonia in 89 percent of cases (85 percent estimated). The disagreement was resolved by the third reviewer in 11 percent of cases (15 percent estimated). This approach is an economical way to create a majority vote without having all three reviewers judge all patients.
In addition to assessing the absence or presence of pneumonia, step 3 reviewers were asked to judge whether the diagnosis made at the patient's initial ED encounter was “correct,” “suspected,” “missed,” or “incorrect.” The category “correct” was marked for patients whose ED diagnosis equaled the gold standard diagnosis. The category “suspected” was marked for the frequent situations in which a preliminary or working diagnosis, such as sepsis, fever of unknown origin, acute exacerbation of bronchitis, or change of mental status in an elderly patient, was established. Pneumonia was not the ED physician's final assessment, but it was considered in the differential diagnosis list and was expected to be assessed during further patient work-up.
“Missed,” or false-negative, pneumonias were defined for gold standard pneumonia cases that did not include pneumonia in final ED diagnoses or among the ED physicians' differential diagnoses. “Incorrect,” or false-positive, pneumonias included cases in which the ED diagnosis was pneumonia but the gold standard diagnosis was not.
In evaluation studies that apply a reference standard, it is advisable to assess reliability (interrater agreement) and repeatability (intrarater agreement).20,24 The reliability of a reference standard increases as more physicians participate in the review process. Because of resource considerations and the reviewers' limited time, the third step in the creation of our reference standard involved only two physicians. Because two physicians reviewed each case and the third physician was involved for resolving disagreement, reliability could suffer. However, this approach is more economical and maintains the feasibility of establishing a majority vote on the diagnosis of each patient.
The physicians involved in establishing the reference standard were independent reviewers who were practicing medicine. No ED physician and no member of the development team were reviewers. Reviewers involved in step 3 were not involved in step 2 of the review process, and vice versa. All reviewers, except one, were from the hospital where the study was performed. Optimally, reviewers are blinded to the purpose of the study. We chose to inform the reviewers about the general purpose of the study to motivate them to undertake the tedious and time-consuming task of reviewing charts. However, they were unaware of any details of the development or the operational characteristics of the DDSS.
Although it is optimal to separate the tasks of the DDSS developers, the users, and the reviewers completely, it is frequently not practical. Only $25,000 was allocated for the evaluation, of which $18,000 was spent for the review process alone. It is possible that the three-step process used did not identify the true disease status for all patients. However, we considered the chances of missing a pneumonia case to be small, and the three-step process represented a balanced trade-off among clinically acceptable disease verification, optimal resource allocation, and feasibility.
Considerations in Selecting a Study Design
The objective of the clinical evaluation was to assess the diagnostic performance of the system and test whether automatically providing physicians with computerized pneumonia information represents a feasible and successful approach to delivering such information. Assessing the overall diagnostic performance in a prospective study is important, and several methods are available, depending on the purpose of the DDSS. One method is to measure the system's overall diagnostic performance with the area under the receiver operating characteristic (ROC) curve.25 The ROC curve determines the accuracy if the DDSS is used for the automatic identification of patients with pneumonia. Such an evaluation does not yield information about whether the diagnostic data are valuable to clinicians or affect their behavior. If the system is used to support physicians in making a diagnosis, a possible evaluation consists of a comparison of the diagnostic performance of physicians with and without the system's information. The functionality of the DDSS can be used for both tasks, and the two evaluation strategies can be pursued in the same study.
Assuming that delivering pneumonia guide information is valuable only if the information is available for the majority of patients with pneumonia, we chose to concentrate on differences in diagnostic sensitivity between physicians with and without the system. We estimated that physicians using the system would identify about 10 to 15 percent more patients with pneumonia than physicians without the system. The rough estimate was derived from the ICD-9-CM codes in the historical data set and was the basis for computing sample size, power, and the duration of the study. Because ICD-9-CM codes were the only available diagnostic source and are inaccurate for clinical purposes, we realized that our estimates for planning the study were approximate.
It is important to recognize that the system automatically provides physicians with PSI risk information. Even if the system does not identify any pneumonia cases not identified by the physicians, it might still be valuable because it provides physicians with access to guide information that they did not have previously.
A variety of designs have been applied to evaluation studies in medical informatics; however, the reasons for preferring one study design to another have rarely been discussed. The interdisciplinary characteristics of decision aids and the variations in the clinical environment create specific challenges and unique barriers that influence the design of clinical evaluations. For our study we considered a time-series design (quasi-experimental design), an independent group comparison (experimental design), and a cross-over design (mixed design). Here we discuss the strengths and weaknesses of each design, emphasizing behavioral, technical, cost, and statistical factors.
Time-Series Design
A quasi-experimental time-series design would compare the accuracy of diagnoses of pneumonia during two successive time periods. During the first period, ED physicians would not have access to the DDSS information and the ED physicians' diagnostic performance would be compared with the reference standard. During the second period, the system's information would be available and the diagnostic characteristics would again be compared with the reference standard. Although a quasi-experimental design is powerful in detecting differences, its internal validity may be compromised by several effects, such as historical events (e.g., educational sessions on pneumonia, concurrent antibiotic study that includes patients with pneumonia), maturation of the subjects' skills, or the reactivity of subjects to the DDSS (e.g., Hawthorne effect, increased awareness).26
A multiple base design, e.g., intervention off-on-off-on, is a possible alternative to a simple time-series design, but it at least doubles the study period. The “off,” or “washout,” period between the two “on” periods should be long enough that the outcome measures approach the initial baseline. Differences in outcome measures between the “on” and the “off” periods shrink as the washout period is shortened. Smaller differences make it more difficult to detect an effect even if it is actually present. In statistical terms, the probability of committing a type 2 error increases.
Sometimes the introduction of a decision support system results in a learning effect that represents an alternative explanation and weakens the outcome. Even when the system is shown to have a measurable effect, it remains unknown whether the system itself or the focus on the disease—such as increased awareness, better documentation, or a possible Hawthorne effect—influenced the observed change. In summary, controlling for possible confounding factors in time-series designs is difficult. Thus, the causal relationship between the introduction of a decision support system and the observed change may remain unknown.
Independent Group Comparison
In the traditional experimental or parallel-group design, ED physicians are randomly assigned to either the intervention or the comparison group. The random assignment of ED physicians to two different groups has the advantage of being less vulnerable to threats to internal validity. However, significant behavioral, logistical, and technical issues are inherent in the restriction of DDSS access to a subset of physicians who work in the ED. Problems that can compromise the evaluation include:
-
Sharing logins among clinicians because of inconsistent logout practices. The ED nurses and physicians access the clinical information system for charting and reviewing patient data. Specifically, the ED nurses spend considerable time interacting with the computer. Terminals are installed in every patient room and in the central working area of the ED. Up to 80 percent of the data processing tasks are performed in the central area even though there are only six computer terminals there.
Users on the ED staff do not consistently log out after using the computers, even though logging out is easy and can be accomplished with a single keystroke. If a user does not log out, the session stays alive until a time-out occurs or another user starts working on the terminal. In the latter case, the subsequent staff person will use the clinical information system under the user identifier of someone else. Shortening the time-out period may require the ED staff to tolerate multiple log-in operations to finish a single task.
In our ED, nurses used the information system heavily for charting patient information, whereas physicians used the information system primarily for data review. Physicians were more likely to use the information system under a different login. Consequently, it would be virtually impossible to limit the display of pneumonia-related information to ED physicians in the intervention group. In addition, ED physicians in the intervention group may not receive the intervention if they do not use their own login when reviewing data.
Sharing experiences about the DDSS. Physicians share their experiences and discuss patients daily. Emergency department physicians who have a particular good or bad experience with the DDSS may influence the attitude of the their colleagues.
Exchanging information. Consultations with other ED physicians occur, specifically in pneumonia cases that present without the characteristic clinical findings of pneumonia, and these consultations are difficult to control when ED physicians are randomized.
Changing responsibility for patients. Because of shift changes, more than one physician may take responsibility for a patient. If, however, the two physicians were assigned to different groups of the experiment, it would be unclear whether the patient was diagnosed by a physician in the intervention or the comparison group.
Attitudes toward computers. Factors that are independent of the information presented by the DDSS, such as different attitudes toward computer use in general, might affect the evaluation. With only half of the ED physicians being in the intervention group, the influence of individual attitudes would grow. In our situation, the 12 ED physicians had a comparable amount of experience with the clinical information system.
Physicians' preferences. Physicians may have a professional interest in patients with distinct diseases or conditions, such as surgical patients, patients with respiratory symptoms, or elderly patients. Although it is unknown whether the effect is present in our ED physician group, it may influence the number of patients with pneumonia in one of the two groups and represent a bias that is not controlled by randomization.
Cross-over Design
Some of these possible effects may be counterbalanced by a mixed design or, more specifically, by a cross-over or split-plot design.27 Compared with a simple randomized design, the cross-over design could potentially have the same statistical power with a smaller sample size. The potential efficiency of the design is based on the within-subject rather than the between-subject observations used in the parallel-group design. The within-subject comparison may be more efficient if considerable variability between subjects exists. However, the cross-over design has several drawbacks that may jeopardize the internal validity of the study. In our evaluation, a major disadvantage to be considered was the presence of a carry-over effect that could obscure the presence of an effect. As in the repeated-measures design, the introduction of a washout period is a countermeasure for carry-over effects. Because of the seasonal variation in pneumonia prevalence and the time constraints on the evaluation, the cross-over design was not our primary choice.
We finally chose a traditional experimental design that randomized patients rather than ED physicians into an intervention and a comparison group.28 Randomizing patients may circumvent problems involved in the physician cross-over or the experimental design with ED physician randomization. To achieve balanced sample sizes for the large number of ED patients during the study period, we applied a block randomization with blocks of 12 consecutive ED patients. Each block had six patients in the intervention group and six patients in the comparison group. The randomization was performed immediately after registration and before any data elements were available. Because, at the time of randomization, we did not know the patient's final diagnosis, it was not feasible to randomize patients with pneumonia into intervention and comparison groups.
The DDSS information was displayed on the ED main screen, where anyone with a legitimate login was able to observe the information. For the majority of ED patients, the pneumonia probability remained below the probability threshold and was not displayed, to avoid overloading ED physicians with useless data. On the screen (see Figure 1▶), a character distinguished patients in the intervention group (“I”) from those in the comparison group (“C”).
Displaying a patient's randomization status allowed the ED physicians to recognize whether pneumonia information might become available during a patient's ED encounter. Hiding a patient's randomization status produces an ambiguous situation and leaves room for two different interpretations. In the first situation, the patient is in the intervention group but the probability threshold for pneumonia has not been crossed. In the second situation, the patient is in the comparison group and no information is displayed. Displaying the patient's assigned randomization group resolves this ambiguity. For example, absent DDSS information for a patient in the intervention group tells the ED physician that the probability threshold for pneumonia was not crossed.
We chose the patients rather than the physicians as the unit of analysis and randomization. Instead of assessing the diagnostic performance of each physician, we decided to evaluate the diagnostic performance of the ED as an entity by analyzing diagnoses and to control for the fact that patients' diagnoses might be influenced by their attending ED physicians. Controlling for ED physicians accounts for the attending physician's making the final diagnosis.
Choosing the patient as the unit of analysis without controlling for the physician factor might violate the independence assumption. The independence assumption asserts that patient data are independently distributed and does not address the possibility of a nested structure that contains correlated data nested within a factor, e.g., ED physician.29 The assumption is not met if establishing a pneumonia diagnosis depends on the responsible ED physician.
In our evaluation, patients are nested in ED physicians and the diagnostic abilities of ED physicians in establishing pneumonia diagnoses may vary. Large differences in diagnostic abilities among ED physicians will violate the independence assumption and may result in an increased likelihood that a type 1 error will be committed.
We plan to use generalized estimating equation models to evaluate the ability of the DDSS to improve diagnosis accuracy in the ED. Generalized estimating equations were originally developed for the longitudinal data analysis of repeated observations of an outcome and account for the correlation between the repeated observations.30 They can be applied to the analysis of clustered data, as in our study, in which a patient's pneumonia diagnosis is clustered within a responsible ED physician.
Discussion
The demand for integrated decision support systems grows as an increasing number of hospitals depend on clinical information systems. To explore new algorithms, stand-alone DDSSs will continue to be developed and evaluated in artificial laboratory settings. However, to effectively support clinicians in routine patient care, decision support systems need to be integrated into clinical information systems and into physicians' work flow. The evaluation of an integrated system challenges researchers because the characteristics of a clinical setting have an important influence on how a system is applied in the care of patients. The characteristics might be completely independent of the system and might relate to behavioral and psychological issues.
We described the study design for the evaluation of a real-time, integrated decision support system. We illustrated that the clinical setting involves a variety of factors that are not present in more artificial experimental settings. The complexity of a system's evaluation increases as the system moves through the phases of system development to routine clinical application. At higher levels of system implementation, the expected behavior of the targeted users and the logistical aspects of the clinical environment become more important than the technical characteristics of the decision support system in determining the appropriate design for a clinical evaluation study. The planning phase is a dynamic process, and every study design involves trade-offs. Some factors may have considerable influence in one design but less in another. The design of the clinical evaluation for a decision support system remains a challenge, and evaluators have to be flexible enough to balance feasibility, study design characteristics, statistical considerations, and limited financial and personnel resources.
Hypotheses about users' behavior can be verified only during or after the study period: Will ED physicians actually incorporate the unsolicited information into their diagnostic decision process? Evaluators should not assume that a decision support system is welcomed and that the information presented will be incorporated into clinicians' reasoning. If clinicians are required to change their work flow, they may be less willing to use decision support systems. Clinicians may incorporate a system's output into their decision making more frequently if the system is highly integrated and delivers information in an unsolicited and easily accessible way.
The goal of our DDSS was not primarily to assist physicians in the diagnosis of difficult pneumonia cases but to detect pneumonia cases automatically and with high accuracy. If the DDSS accomplishes the diagnostic task, detected cases can be flagged in the clinical information system as pneumonia cases. On the basis of the pneumonia flag in the clinical information system, patient- and pneumonia-specific protocols—such as vaccination guides,23 criteria for intensive care unit admission,24 and discharge criteria25—can be initiated without a clinician's intervention. Potentially useful patient management information can then be displayed to clinicians without any action on their part.
Because our study evaluated a new decision support approach in a clinical setting, we wanted to find answers to simple questions. Will clinicians consider the provided information? Will the DDSS influence the clinician's diagnostic accuracy? However, questions about changes in behavior and clinical impact on patients' outcomes will eventually be of greater interest. Our evaluation study represents an intermediate step in the life cycle of the development and evaluation of a decision support system. As the system moves through the life cycles, further evaluation studies will be necessary to demonstrate a clinical impact.
Acknowledgments
The authors thank the ED physicians at LDS Hospital for valuable contributions during system development and study design. They also thank Nathan C. Dean, MD, Mary Suchyta, DO, David Klein, MD, Kurt Besch, MD, Kelly Murny, MD, John Lund, MD, Allen Davis, MD, and Brian Beck, MD, for their help in the review process. They also thank the anonymous reviewers for their comments on an early version of the manuscript.
This study was supported by a grant from the Deseret Foundation. Dr. Aronsky was supported by grant 31-44406.95 from the Swiss National Science Foundation.
References
- 1.Miller RA. Medical diagnostic decision support systems—past, present, and future: a threaded bibliography and brief commentary. J Am Med Inform Assoc. 1994;1:8–27. [DOI] [PMC free article] [PubMed] [Google Scholar]
- 2.Berner ES, Webster GD, Shugerman AA, et al. Performance of four computer-based diagnostic systems. N Engl J Med. 1994;330:1792–6. [DOI] [PubMed] [Google Scholar]
- 3.de Dombal FT, Leaper DJ, Staniland JR, McCann AP, Horrocks JC. Computer-aided diagnosis of acute abdominal pain. BMJ. 1972;2:9–13. [DOI] [PMC free article] [PubMed] [Google Scholar]
- 4.Baxt WG, Skora J. Prospective validation of artificial neural network trained to identify acute myocardial infarction. Lancet. 1996;347:12–5. [DOI] [PubMed] [Google Scholar]
- 5.Aronsky D, Haug PJ. Diagnosing community-acquired pneumonia with a Bayesian network. Proc AMIA Annu Symp. 1998:632–6. [PMC free article] [PubMed]
- 6.Aronsky D, Haug PJ. An integrated decision support system for diagnosing and managing patients with community-acquired pneumonia. Proc AMIA Annu Symp. 1999:197–201. [PMC free article] [PubMed]
- 7.Fine MJ, Auble TE, Yealy DM, et al. A prediction rule to identify low-risk patients with community-acquired pneumonia. N Engl J Med. 1997;336:243–50. [DOI] [PubMed] [Google Scholar]
- 8.Atlas SJ, Benzer TI, Borowsky LH, et al. Safely increasing the proportion of patients with community-acquired pneumonia treated as outpatients: an interventional trial. Arch Intern Med. 1998;158:1350–6. [DOI] [PubMed] [Google Scholar]
- 9.Aronsky D, Haug PJ. Assessing the quality of clinical data in a computer-based record for calculating the pneumonia severity index. J Am Med Inform Assoc. 2000;7:55–65. [DOI] [PMC free article] [PubMed] [Google Scholar]
- 10.Brenner H, Gefeller O. Variation of sensitivity, specificity, likelihood ratios and predictive values with disease prevalence. Stat Med. 1997;16:981–91. [DOI] [PubMed] [Google Scholar]
- 11.Poses RM, Cebul RD, Collins M, Fager SS. The importance of disease prevalence in transporting clinical prediction rules: the case of streptococcal pharyngitis. Ann Intern Med. 1986;105:586–91. [DOI] [PubMed] [Google Scholar]
- 12.Gallagher EJ. Clinical utility of likelihood ratios. Ann Emerg Med. 1998;31:391–7. [DOI] [PubMed] [Google Scholar]
- 13.Metlay JP, Schulz R, Li YH, et al. Influence of age on symptoms at presentation in patients with community-acquired pneumonia. Arch Intern Med. 1997;157:1453–9. [PubMed] [Google Scholar]
- 14.Whittle J, Fine MJ, Joyce DZ, et al. Community-acquired pneumonia: Can it be defined with claims data? Am J Med Qual. 1997;12:187–93. [DOI] [PubMed] [Google Scholar]
- 15.Guevara RE, Butler JC, Marston BJ, Plouffe JF, File TM Jr, Breiman RF. Accuracy of ICD-9-CM codes in detecting community-acquired pneumococcal pneumonia for incidence and vaccine efficacy studies. Am J Epidemiol. 1999;149:282–9. [DOI] [PubMed] [Google Scholar]
- 16.Wipf JE, Lipsky BA, Hirschmann JV, et al. Diagnosing pneumonia by physical examination: Relevant or relic? Arch Intern Med. 1999;159:1082–7. [DOI] [PubMed] [Google Scholar]
- 17.Albaum MN, Hill LC, Murphy M, et al. Interobserver reliability of the chest radiograph in community-acquired pneumonia. PORT Investigators. Chest. 1996;110:343–50. [DOI] [PubMed] [Google Scholar]
- 18.Fine MJ, Stone RA, Singer DE, et al. Processes and outcomes of care for patients with community-acquired pneumonia: results from the Pneumonia Patient Outcomes Research Team (PORT) cohort study. Arch Intern Med. 1999;159:970–80. [DOI] [PubMed] [Google Scholar]
- 19.Corley DE, Kirtland SH, Winterbauer RH, et al. Reproducibility of the histologic diagnosis of pneumonia among a panel of four pathologists: analysis of a gold standard. Chest. 1997;112:458–65. [DOI] [PubMed] [Google Scholar]
- 20.Friedman CP, Wyatt JC. Evaluation Methods in Medical Informatics (Computers and Medicine). New York: Springer-Verlag, 1997.
- 21.Begg CB, Greenes RA. Assessment of diagnostic tests when disease verification is subject to selection bias. Biometrics. 1983;39: 207–15. [PubMed] [Google Scholar]
- 22.Greenes RA, Begg CB. Assessment of diagnostic technologies: methodology for unbiased estimation from samples of selectively verified patients. Invest Radiol. 1985;20:751–6. [PubMed] [Google Scholar]
- 23.Ewig S. Community-acquired pneumonia: definition, epidemiology, and outcome. Semin Respir Infect. 1999;14:94–102. [PubMed] [Google Scholar]
- 24.Wyatt J, Spiegelhalter D. Evaluating medical expert systems: what to test and how? Med Inform (Lond.) 1990;15:205–17. [DOI] [PubMed] [Google Scholar]
- 25.Hanley JA, McNeil BJ. The meaning and use of the area under a receiver operating characteristic (ROC) curve. Radiology. 1982;143:29–36. [DOI] [PubMed] [Google Scholar]
- 26.Drew CJ, Hardman ML, Hart AW. Designing and Conducting Research: Inquiry in Education and Social Science. Boston, Mass.: Allyn & Bacon, 1995.
- 27.Woods JR, Williams JG, Tavel M. The two-period cross-over design in medical research. Ann Intern Med. 1989;110:560–6. [DOI] [PubMed] [Google Scholar]
- 28.Morris AH, Wallace CJ, Menlove RL, et al. Randomized clinical trial of pressure-controlled inverse ratio ventilation and extracorporeal CO2 removal for adult respiratory distress syndrome. Am J Respir Crit Care Med. 1994;149:295–305. [DOI] [PubMed] [Google Scholar]
- 29.Crits-Christoph P, Mintz J. Implications of therapist effects for the design and analysis of comparative studies of psychotherapies. J Consult Clin Psychol. 1991;59:20–6. [DOI] [PubMed] [Google Scholar]
- 30.Diggle PJ, Liang KY, Zeger SL. Analysis of Longitudinal Data. New York: Oxford University Press, 1994.