

Abstract
Stearoyl-acyl carrier protein desaturase-mediated conversion of stearic acid to oleic acid (18:1) is the key step that regulates the levels of unsaturated fatty acids (FAs) in cells. Our previous work with the Arabidopsis (Arabidopsis thaliana) ssi2/fab2 mutant and its suppressors demonstrated that a balance between glycerol-3-phosphate (G3P) and 18:1 levels is critical for the regulation of salicylic acid (SA)- and jasmonic acid-mediated defense signaling in the plant. In this study, we have evaluated the role of various genes that have an impact on SA, resistance gene-mediated, or FA desaturation (FAD) pathways on ssi2-mediated signaling. We show that ssi2-triggered resistance is dependent on EDS1, PAD4, EDS5, SID2, and FAD7 FAD8 genes. However, ssi2-triggered defects in the jasmonic acid pathway, morphology, and cell death phenotypes are independent of the EDS1, EDS5, PAD4, NDR1, SID2, FAD3, FAD4, FAD5, DGD1, FAD7, and FAD7 FAD8 genes. Furthermore, the act1-mediated rescue of ssi2 phenotypes is also independent of the FAD2, FAD3, FAD4, FAD5, FAD7, and DGD1 genes. Since exogenous application of glycerol converts wild-type plants into ssi2 mimics, we also studied the effect of exogenous application of glycerol on mutants impaired in resistance-gene signaling, SA, or fad pathways. Glycerol increased SA levels and induced pathogenesis-related gene expression in all but sid2, nahG, fad7, and fad7 fad8 plants. Furthermore, glycerol-induced phenotypes in various mutant lines correlate with a concomitant reduction in 18:1 levels. Inability to convert glycerol into G3P due to a mutation in the nho1-encoded glycerol kinase renders plants tolerant to glycerol and unable to induce the SA-dependent pathway. A reduction in the NHO1-derived G3P pool also results in a partial age-dependent rescue of the ssi2 morphological and cell death phenotypes in the ssi2 nho1 plants. The glycerol-mediated induction of defense was not associated with any major changes in the lipid profile and/or levels of phosphatidic acid. Taken together, our results suggest that glycerol application and the ssi2 mutation in various mutant backgrounds produce similar effects and that restoration of ssi2 phenotypes is not associated with the further desaturation of 18:1 to linoleic or linolenic acids in plastidal or extraplastidal lipids.
Plants have evolved various defense mechanisms to resist infection by pathogens. Upon recognition, the host plant initiates one or more signal transduction pathways that activate various plant defenses and thereby avert pathogen colonization. In many cases, resistance is associated with increased expression of defense genes, including the pathogenesis-related (PR) genes and the accumulation of salicylic acid (SA) in the inoculated leaf. The SA signal transduction pathway plays a pivotal role in plant defense signaling (for review, see Durrant and Dong, 2004). When SA accumulation is suppressed in tobacco (Nicotiana tabacum) and Arabidopsis (Arabidopsis thaliana) by expression of the nahG transgene, which encodes the SA-degrading enzyme SA hydroxylase, susceptibility to both compatible and incompatible pathogens is enhanced and PR gene expression is suppressed (Gaffney et al., 1993; Delaney et al., 1994). Similarly, Arabidopsis mutants that are impaired in SA responsiveness, such as npr1 (Cao et al., 1997; Ryals et al., 1997; Shah et al., 1997), or pathogen-induced SA accumulation, such as eds1 (Falk et al., 1999), eds5 (Nawrath et al., 2002), sid2 (Wildermuth et al., 2001), and pad4 (Jirage et al., 1999), exhibit enhanced susceptibility to pathogen infection and impaired PR gene expression.
In addition to the major phytohormone-mediated defense pathways, fatty acid (FA)-derived signaling has also started to emerge as one of the important defense pathways (Vijayan et al., 1998; Kachroo et al., 2001, 2003b, 2004; Weber, 2002; Li et al., 2003; Yaeno et al., 2004). Desaturation of stearic acid (18:0)-acyl carrier protein (ACP) to oleic acid (18:1)-ACP catalyzed by the SSI2/FAB2-encoded stearoyl-ACP desaturase (S-ACP-DES) is one of the key steps in the FA biosynthesis pathway that regulates levels of unsaturated FAs in the cell (see also Fig. 8). A mutation in ssi2 confers stunted phenotype, constitutive PR gene expression, spontaneous lesion formation, and enhanced resistance to both bacterial and oomycete pathogens (Kachroo et al., 2001; Shah et al., 2001). By contrast, the ssi2 plants are unable to induce jasmonic acid (JA)-responsive gene PDF1.2 and show enhanced susceptibility to necrotrophic pathogen Botrytis cinerea (Kachroo et al., 2001, 2003b). The activity of the mutant S-ACP-DES enzyme was reduced 10-fold, resulting in elevation of 18:0 content in ssi2 plants (Kachroo et al., 2001). However, an increase in 18:0 does not contribute to altered defense signaling because several ssi2 suppressors show wild type-like signaling and yet accumulate high levels of 18:0 (Kachroo et al., 2003a).
Figure 8.

A condensed scheme for lipid biosynthesis and glycerol-mediated signaling in Arabidopsis leaves. De novo FA synthesis occurs exclusively in the plastids of all plant cells and leads to the synthesis of palmitic acid (16:0)-ACP and oleic acid (18:1)-ACP. These FAs enter glycerolipid synthesis either via the prokaryotic pathway in the inner envelope of chloroplasts or are exported out of plastids as CoA thioesters to enter the eukaryotic glycerolipid synthesis pathway. Desaturation of stearic acid (18:0)-ACP to 18:1-ACP catalyzed by the SSI2/FAB2-encoded stearoyl-ACP desaturase is one of the key steps in the FA biosynthesis pathway that regulates levels of unsaturated FAs in the cell. The 18:1-ACP generated in this reaction enters the prokaryotic pathway through acylation of G3P and this reaction is catalyzed by the ACT1-encoded G3P acyltransferase. G3P can be made via a cytosolic enzyme GK or via G3Pdh. Dotted line indicates that GK-derived G3P makes a minor contribution to the plastidal G3P pool. Desaturation of 18:1 to 18:2 and 18:3 on membrane glycerolipids (GL) is catalyzed by FAD6 and FAD7/FAD8-encoded desaturases, respectively, that are present on the plastid envelop. Esterification of the CoA group is mediated by acyl-CoA synthetase (ACS). CoA, Coenzyme A; Lyso-PA, acyl-G3P; SL, sulfolipid; DAG, diacylglycerol; DHAP, dihydroxyacetone phosphate.
A mutation in ssi2 also results in reduction in 18:1 content. The altered morphology and defense phenotypes in the ssi2 plants are restored by a loss-of-function mutation in the ACT1-encoded glycerol-3-P (G3P) acyltransferase, or in the GLY1-encoded G3P dehydrogenase (G3Pdh), both of which elevate 18:1 levels in the ssi2 plants (Kachroo et al., 2003b, 2004). A mutation in gly1 and act1 results in reduced carbon flux through the prokaryotic pathway, which leads to a reduction in the hexadecatrienoic (16:3) acid levels (Kunst et al., 1988; Miquel et al., 1998). However, the gly1 and act1 plants continue to show normal growth characteristics, suggesting that increased flux through the eukaryotic pathway compensates for their defect. Because both 18:1 and G3P are required for the acyltransferase-catalyzed reaction, a reduction in either is likely to reduce the carbon flux through ACT1.
The levels of G3P and of 18:1 can also be modulated by exogenous application of glycerol. The glycerol treatment leads to an increase in the endogenous G3P levels, which results in quenching of 18:1. Since the ACT1-catalyzed step is rate limiting, the quenching of 18:1 is more drastic in glycerol-treated ACT1-overexpressing lines (Kachroo et al., 2004). A reduction in the 18:1 in wild-type plants confers phenotypes similar to that of the ssi2 mutant.
In this study, we have attempted to establish a link between glycerol metabolism and ssi2-mediated defense signaling. We show that the glycerol-mediated decline in 18:1 levels occurs in mutants that are impaired in the SA signaling pathway or affected in various FAD steps. The defense phenotypes associated with glycerol application are dependent on the ability of plants to utilize glycerol or acylate the glycerol-derived G3P with 18:1. Consistent with this result, a mutation in nho1 (gli1) renders plants tolerant to glycerol and unable to induce PR-1 gene expression in response to glycerol. We also show that ssi2-triggered phenotypes were not influenced by mutations that impair the SA pathway or that alter the levels of 16:3 or trienoic acids (16:3 and linolenic [18:3]). Since mutations in various FADs did not affect any of the ssi2 act1 phenotypes, we conclude that complementation of the ssi2 mutation in the act1 background is not associated with the further conversion of 18:1 to linoleic acid (18:2) or 18:3 in plastidal or extraplastidal lipids.
RESULTS
Glycerol-Induced SA Levels Are Dependent on SID2
Previously, we showed that exogenous application of glycerol on wild-type plants lowers 18:1 levels and results in the induction of PR-1 gene expression (Kachroo et al., 2004). To determine the molecular components participating in this glycerol-mediated effect on the SA pathway, we tested the response of sid2, npr1, eds1, pad4, ndr1, and eds5 mutants and nahG transgenic plants to exogenous application of glycerol (Table I). The glycerol- and water-sprayed plants were evaluated for cell death, SA/SA glucoside (SAG) levels, PR expression, pathogen resistance, and 18:1 levels. All genotypes showed cell death on their leaves, suggesting that glycerol-induced cell death was independent of mutations analyzed or the nahG transgene (Fig. 1A). Next, we determined the levels of SA and SAG in water- and glycerol-treated plants. Both Nössen (Nö) and Columbia-0 (Col-0) plants showed a 10- and 13-fold induction in SA levels and an 8- and 10-fold induction in SAG levels, respectively (Fig. 1B). The SA/SAG levels in glycerol-treated eds1, eds5, and pad4 plants were higher compared to the water-treated plants, but significantly lower compared to the glycerol-treated wild-type plants. The sid2 plants showed near-basal levels of SA/SAG, whereas ndr1 and npr1 plants accumulated higher than wild-type levels. These results indicate that SA levels generated upon glycerol treatment are partially dependent on EDS1, EDS5, and PAD4, and completely dependent on SID2. These results also suggest that NDR1 and NPR1 negatively regulate the glycerol-triggered increase in SA/SAG levels.
Table I.
Mutant and transgenic lines used in this study and functional properties of the proteins encoded by their wild-type alleles
| Mutant | Functional Properties | References |
|---|---|---|
| fad2 | Endoplasmic reticulum-localized oleoyl-phosphatidylcholine desaturase, desaturates 18:1 to 18:2 | Miquel and Browse (1992) |
| fad3 | Endoplasmic reticulum-localized linoleoyl-phosphatidylcholine desaturase, desaturates 18:2 to 18:3 | Browse et al. (1993) |
| fad4 | Desaturates palmitate at sn-2 position of PG in plastids | Browse et al. (1985) |
| fad5 | Desaturates palmitate at sn-2 position of MGDG in plastids | Kunst et al. (1989) |
| fad6 | Plastid-localized oleoyl desaturase | Falcone et al. (1994) |
| fad7 | Plastid-localized linoleate desaturase | Iba et al. (1993) |
| fad8 | Plastid-localized linoleate desaturase | Gibson et al. (1994) |
| nho1 (gli1) | Encodes glycerolkinase, converts glycerol to G3P | Eastmond (2004); Kang et al. (2003) |
| gly1 | Encodes G3Pdh, converts DHAP to G3P | Kachroo et al. (2004); Miquel (2003) |
| act1 | Encodes G3P acyltransferase, plastid localized, acylates 18:1 on G3P backbone | Kunst et al. (1988) |
| dgd1 | Plastid-localized galactosyltransferase; involved in synthesis of DGDG from MGDG | Dormann et al. (1995) |
| eds1 | Encodes lipase-like protein, involved in R gene- and SA-mediated signaling | Falk et al. (1999) |
| pad4 | Encodes lipase-like protein, involved in SA-mediated signaling | Jirage et al. (1999) |
| eds5 | Encodes membrane-bound multidrug and toxin-extrusion protein transporter-like protein, involved in SA-mediated signaling | Nawrath et al. (2002) |
| ndr1 | Encodes plasma membrane-localized protein required for nonrace-specific disease resistance, involved in R gene-mediated signaling | Century et al. (1997) |
| sid2 | Encodes isochorismate synthase involved in biosynthesis of SA | Wildermuth et al. (2001) |
| nahG | Bacterial salicylate hydroxylase that converts SA to catachol | Yamamotoj et al. (1965) |
| npr1 | Encodes a protein containing an ankyrin repeat domain, a key positive regulator of SA signaling and systemic acquired resistance | Cao et al. (1997); Ryals et al. (1997) |
Figure 1.


Glycerol-mediated effects on mutants impaired in SA or R gene signaling. A, Microscopy of trypan blue-stained leaves from indicated genotypes treated with water or 50 mm glycerol. SSI2 indicates Col-0 ecotype. B, Endogenous SA and SAG levels in the leaves of indicated 4-week-old soil-grown plants treated with water or glycerol. The values are presented as the mean of three replicates. Error bars represent sd. C, Expression of the PR-1 and PR-2 genes in indicated genotypes. RNA gel-blot analysis was performed on 7 μg of total RNA extracted from 4-week-old soil-grown plants treated with water or glycerol. SSI2 indicates Col-0 ecotype. Ethidium bromide staining of rRNA was used as a loading control. D, Growth of P. parasitica biotype Emco5 on various plant genotypes listed at the left. The Ler and Ws ecotypes were used as the resistant and susceptible controls, respectively. The plants were treated with water (W) or glycerol (G) for 72 h prior to pathogen inoculation and approximately 60 to 75 cotyledons were scored for infection. The shade of each box indicates the severity of infection, based on the number of sporangiophores per cotyledon (see key at the right). Except eds1-1 (Ws background) and nahG (Nö background), all other mutant lines were in Col-0 background. E, Glycerol-induced changes in the 18:1 levels in leaf tissue of 4-week-old plants. Plants were treated with glycerol or water, and samples taken 72 h post treatment were analyzed for FAs using gas chromatography (GC). SSI2 indicates Col-0 ecotype. The values are presented as the mean of six to eight replicates. Error bars represent sd.
To determine whether a correlation exists between glycerol-induced SA levels and PR gene expression, we evaluated the expression of PR-1 and PR-2 genes in various genotypes treated with water or glycerol (Fig. 1C). Although basal or low levels of PR-1 and PR-2, respectively, were seen in glycerol-treated sid2 plants, all the other mutant lines showed induction of these transcripts upon glycerol treatment. Interestingly, the glycerol-treated ndr1, eds5, and npr1 plants induced higher levels of the PR-2 gene as compared to the glycerol-treated wild-type plants. Taken together, these data suggest that glycerol-induced PR gene expression is dependent on the presence of a certain threshold level of SA/SAG, and these levels are derived via a SID2-dependent pathway.
We further evaluated the effect of mutations impairing the SA pathway on glycerol-induced resistance to Peronospora parasitica biotype Emco5 (Fig. 1D). Under the conditions tested, the wild-type Col-0 plants showed developmental resistance to Emco5, revealing less than 20% susceptibility as compared to the mock-inoculated plants. By comparison, both Wassilewskija (Ws) and Nö showed marked susceptibility (Fig. 1D; Kachroo et al., 2004). The glycerol-treated Col-0 plants were as tolerant as the resistant ecotype Landsberg erecta (Ler) and glycerol treatment of Ws and Nö showed significant reduction in pathogen growth and sporulation (Fig. 1D; Kachroo et al., 2004). The water-treated eds1 (derived from Ws ecotype), eds5, pad4, sid2, ndr1, npr1, and nahG plants showed marked susceptibility to Emco5. Glycerol treatment had little or no effect on the nahG plants. A partial enhancement in resistance was observed in glycerol-treated pad4, eds5, ndr1, and sid2 plants. A more pronounced effect was observed in glycerol-treated npr1 plants, which showed an approximately 60% reduction in the number of susceptible plants. The glycerol-treated eds1 plants showed only a marginal, approximately 10% reduction in the number of susceptible plants. Taken together, these data suggest that glycerol-mediated resistance to Emco5 requires the functions of EDS1, PAD4, EDS5, SID2, and NDR1. Similar to Col-0 plants, only approximately 10% of water-treated act1 plants displayed susceptibility. Consistent with the glycerol-insensitive phenotype of act1 plants, glycerol treatment of act1 did not enhance resistance to Emco5 (Fig. 1D).
To establish a correlation between the glycerol-induced phenotypes and 18:1 levels, we next determined the leaf 18:1 content 3 d after glycerol application. Both wild-type and plants impaired in the SA signaling pathway showed a drastic reduction in their 18:1 levels after glycerol application (Fig. 1E), and these were comparable to 18:1 levels in ssi2 plants. By comparison, act1 plants, which are unable to acylate 18:1, did not show a decrease in their 18:1 levels.
SA Signaling Mutants Affect the SA Levels But Do Not Restore Altered Defense Signaling in ssi2 Plants
Previously, we suggested that glycerol application on wild-type plants converts these into ssi2 mimics by lowering their 18:1 levels (Kachroo et al., 2004). To determine whether the glycerol effect seen on single mutants defective in SA or resistance (R) gene signaling pathways was comparable to the presence of the ssi2 mutation in these backgrounds, we constructed ssi2 double-mutant plants in the eds1, pad4, eds5, ndr1, and sid2 backgrounds. All the double-mutant plants showed hypersensitive response-like lesions on their leaves and, except ssi2 ndr1, all other double-mutant and ssi2 nahG plants were slightly bigger than the ssi2 plants (Fig. 2, A and B). In comparison to ssi2, the ssi2 eds1, ssi2 pad4, ssi2 eds5, and ssi2 ndr1 plants accumulated lower levels, whereas the ssi2 sid2 plants showed basal levels, of SA and SAG (Fig. 2C). Thus EDS1, PAD4, EDS5, NDR1, and SID2 appear to contribute to the SA levels in ssi2 plants and the SA/SAG in ssi2 plants is possibly derived via a SID2-dependent pathway. This possibility was further supported by the observation that exogenous application of glycerol was able to up-regulate the SA/SAG levels in ssi2 gly1-3 plants, but not in ssi2 sid2 and ssi2 act1 plants (Fig. 2C). Consistent with the reduced levels of SA, PR-1 gene expression decreased to basal levels in ssi2 sid2 and ssi2 nahG plants (Fig. 2D). A moderate reduction in PR-1 levels was also observed in ssi2 npr1 and ssi2 eds5 plants, whereas ssi2 eds1, ssi2 pad4, and ssi2 ndr1 plants showed levels similar to those in ssi2 plants. Interestingly, as seen in glycerol-treated single-mutant plants, the expression of PR-2 was up-regulated by mutations in npr1 and eds5 and increased basal-level expression was also seen in ssi2 sid2 and ssi2 nahG plants (Figs. 1C and 2D). These results indicate that high levels of PR expression in ssi2 plants can be triggered by the presence of a certain threshold of SA/SAG (Fig. 2D). To determine whether any correlation exists between SA levels/PR gene expression and pathogen resistance, we tested the response of ssi2 pad4, ssi2 eds5, ssi2 sid2, and ssi2 nahG plants to the virulent pathogen Emco5 (Fig. 2E). Strikingly, and similar to the resistance spectrum seen in glycerol-treated single mutants (Fig. 1D), a mutation in pad4, eds5, or sid2 increased the susceptibility of ssi2 plants to Emco5. Since ssi2 eds1-2 plants were in the RPP8 background (McDowell et al., 1998), which confers resistance to Emco5, we inoculated these and ssi2 ndr1 plants with a virulent bacterial pathogen, Pseudomonas syringae. The eds1-2 mutation compromised the enhanced bacterial resistance conferred by the ssi2 mutation (Fig. 2F). By contrast, the ssi2 ndr1 plants were as resistant as the ssi2 plants. These data suggest that ssi2-mediated resistance was dependent on EDS1 and independent of NDR1. A higher degree of susceptibility seen in ssi2 pad4 as compared to ssi2 eds5 plants further suggests that ssi2-conferred resistance does not correlate with either the levels of SA or the expression of PR-1.
Figure 2.


Morphological, molecular, and biochemical phenotypes of wild-type, ssi2, ssi2 nahG, ssi2 sid2, ssi2 pad4, ssi2 eds1, ssi2 eds5, and ssi2 ndr1 plants. A, Comparison of the morphological phenotypes displayed by the wild-type (SSI2, Nö ecotype), ssi2, and various double-mutant plants in the ssi2 background. B, Microscopy of trypan blue-stained leaves from wild-type (SSI2, Nö ecotype), ssi2, and various double-mutant plants in the ssi2 background. C, Endogenous SA and SAG levels in the leaves of indicated 4-week-old soil-grown plants treated with water or glycerol. The values are presented as the mean of three replicates. Error bars represent sd. D, Expression of the PR-1 and PR-2 genes in indicated genotypes. RNA gel-blot analysis was performed on 7 μg of total RNA extracted from 4-week-old soil-grown plants. SSI2 indicates Nö ecotype. Ethidium bromide staining of rRNA was used as a loading control. E, Growth of P. parasitica biotype Emco5 on various plant genotypes listed at the left. The Ler and Nö ecotypes were used as the resistant and susceptible controls, respectively. The numbers against each box indicate cotyledons scored. The shade of each box indicates the severity of infection, based on the number of sporangiophores per cotyledon (see key at the right). F, Growth of P. syringae on SSI2, ssi2, ssi2 eds1, and ssi2 ndr1. Four leaf discs were harvested from infected leaves at 3 d postinoculation, ground in 10 mm MgCl2, and the bacterial numbers tittered. The bacterial numbers ± sd (n = 4) presented as colony forming units (CFU) per unit leaf area of 25 mm2. The experiment was independently performed twice with similar results.
We then analyzed various ssi2-containing genotypes for their FA levels to determine whether a correlation exists between 18:1 levels and phenotypes exhibited by these plants (Table II). All double-mutant and ssi2 nahG plants showed increased levels of 18:0 and a decrease in 18:1 content, which is consistent with the presence of the ssi2 mutation in these plants. Taken together, these results suggest that a mutation in eds1, pad4, eds5, ndr1, or sid2 does not restore 18:1 levels or normal signaling in ssi2 plants.
Table II.
FA composition from leaf tissues of SSI2, ssi2, eds1, ssi2 eds1, ndr1, ssi2 ndr1, eds5, ssi2 eds5, pad4, ssi2 pad4, sid2, ssi2 sid2, nahG, and ssi2 nahG plants
All measurements were made on plants grown at 22°C and data are described as mol% ± sd calculated for a sample size of six.
| Genotype | 16:0 | 16:1 | 16:2 | 16:3 | 18:0 | 18:1 | 18:2 | 18:3 | Morphology |
|---|---|---|---|---|---|---|---|---|---|
| SSI2 | 14.85 ± 1.41 | 4.10 ± 0.34 | 0.99 ± 0.33 | 16.30 ± 0.33 | 0.63 ± 0.08 | 2.31 ± 0.59 | 13.1 ± 1.55 | 47.72 ± 1.71 | Wild type |
| ssi2 | 14.81 ± 2.10 | 2.86 ± 0.44 | 0.45 ± 0.18 | 9.0 ± 1.06 | 15.8 ± 2.82 | 0.6 ± 0.18 | 15.68 ± 1.72 | 40.8 ± 1.45 | Stunted |
| eds1 | 13.73 ± 0.41 | 4.66 ± 0.12 | 0.55 ± 0.04 | 17.95 ± 0.84 | 0.70 ± 0.04 | 1.27 ± 0.13 | 10.41 ± 0.64 | 50.73 ± 0.96 | Wild type-like |
| ssi2 eds1 | 14.77 ± 2.75 | 3.85 ± 0.54 | 0.45 ± 0.1 | 10.18 ± 1.29 | 16.9 ± 1.99 | 0.8 ± 0.15 | 13.8 ± 2.39 | 39.25 ± 3.53 | ssi2-like |
| ndr1 | 14.6 ± 0.41 | 4.65 ± 0.12 | 1.01 ± 0.1 | 14.81 ± 0.67 | 0.54 ± 1.3 | 2.1 ± 0.48 | 13.87 ± 1.04 | 48.42 ± 0.98 | Wild type-like |
| ssi2 ndr1 | 12.34 ± 0.33 | 2.0 ± 0.1 | 0.5 ± 0.1 | 9.84 ± 1.53 | 18.52 ± 1.3 | 0.70 ± 0.48 | 11.16 ± 1.04 | 45.30 ± 0.98 | ssi2-like |
| eds5 | 14.05 ± 0.36 | 4.29 ± 0.37 | 1.17 ± 0.14 | 16.39 ± 0.74 | 0.60 ± 0.06 | 2.39 ± 0.39 | 14.72 ± 1.05 | 46.39 ± 0.79 | Wild type-like |
| ssi2 eds5 | 16.68 ± 2.31 | 3.88 ± 0.96 | 0.28 ± 0.04 | 8.88 ± 1.86 | 14.84 ± 2.59 | 0.94 ± 0.20 | 12.66 ± 0.65 | 41.84 ± 5.00 | ssi2-like |
| pad4 | 14.09 ± 0.88 | 4.09 ± 0.65 | 1.18 ± 0.22 | 15.91 ± 1.59 | 0.64 ± 0.11 | 2.27 ± 0.60 | 15.44 ± 2.29 | 46.38 ± 1.78 | Wild type-like |
| ssi2 pad4 | 15.16 ± 0.48 | 3.05 ± 0.72 | 0.5 ± 0.1 | 8.62 ± 0.70 | 17.54 ± 2.36 | 0.88 ± 0.08 | 12.25 ± 0.73 | 42.00 ± 3.95 | ssi2-like |
| sid2 | 13.00 ± 0.36 | 4.23 ± 0.35 | 0.84 ± 0.19 | 17.24 ± 0.92 | 0.63 ± 0.06 | 1.42 ± 0.39 | 12.91 ± 1.90 | 49.73 ± 1.62 | Wild type-like |
| ssi2 sid2 | 16.68 ± 1.51 | 5.1 ± 0.75 | 0.18 ± 0.02 | 10.68 ± 2.08 | 17.58 ± 1.80 | 0.68 ± 0.21 | 8.68 ± 0.62 | 40.42 ± 1.19 | ssi2-like |
| nahG | 14.86 ± 0.90 | 4.18 ± 0.68 | 1.14 ± 0.51 | 16.06 ± 2.30 | 1.19 ± 0.50 | 1.75 ± 0.92 | 14.27 ± 3.29 | 46.55 ± 3.47 | Wild type-like |
| ssi2 nahG | 14.60 ± 2.53 | 3.32 ± 0.31 | 0.31 ± 0.08 | 10.0 ± 1.24 | 18.01 ± 1.07 | 0.9 ± 0.25 | 13.68 ± 0.91 | 39.18 ± 2.81 | ssi2-like |
Glycerol Application or Presence of the ssi2 Mutation in fad Mutants Produce Similar Effects
To examine the role of the FA desaturation pathway in the induction of glycerol-mediated ssi2-like phenotypes, we treated mutants affected in various steps of FAD with glycerol (Table I). The fad2, fad3, fad4, fad5, fad6, fad7, and fad7 fad8 plants showed visible and microscopic cell death lesions on their leaves upon exposure to glycerol (Fig. 3A). The extent of lesion formation was maximal in fad5 plants and minimal in fad7 and fad7 fad8 plants (Fig. 3A). The glycerol-induced morphological, microscopic, and PR-1 phenotypes in fad7 and fad8 plants correlated with SA levels; upon glycerol treatment, fad7 and fad7 fad8 accumulated approximately 3-fold lower levels of SA as compared to wild-type plants (Fig. 3, A–C). The SA levels after glycerol treatment were highest in fad5 plants followed by fad3, fad2, wild-type, fad4, and fad6 plants. Although glycerol treatment induced higher expression of PR-1 in fad3 plants, their morphological phenotype was not as pronounced as that of fad5 plants. FA profiling of water- and glycerol-treated fad2, fad3, fad4, fad5, and fad6 plants showed a glycerol-triggered decline in 18:1 levels; however, this decline was not as drastic in fad2 and fad6 plants because they contain high levels of membranous 18:1 (Fig. 3D). As compared to fad3, fad4, and fad5 plants, the glycerol-treated fad7 and fad7 fad8 plants showed a moderate reduction in 18:1 and these levels were higher than those in the ssi2 plants. As expected, while the ssi2 act1 plants did not show any drop in 18:1 levels, ssi2 gly1-3 plants showed a significant decline. Taken together, these results imply a positive correlation between reduction in 18:1 levels and the appearance of glycerol-induced phenotypes in fad mutants.
Figure 3.


Glycerol-mediated effects on mutants impaired in various FAD steps and double-mutant analysis of ssi2 in different fad backgrounds. A, Comparison of the morphological and cell death phenotypes displayed by the wild-type (SSI2, Col-0 ecotype), fad2, fad3, fad4, fad5, fad6, fad7, and fad7 fad8 plants. The plants were treated with water or glycerol and photographed 3 d post treatment. B, Expression of the PR-1 gene in water- and glycerol-treated fads, wild-type (SSI2, Col-0 ecotype), and act1 plants. RNA gel-blot analysis was performed on 7 μg of total RNA extracted from 4-week-old soil-grown plants. Ethidium bromide staining of rRNA was used as a loading control. C, Endogenous SA levels in the leaves of 4-week-old soil-grown wild-type (Col-0), fad2, fad3, fad4, fad5, fad6, fad7, and fad7 fad8 plants treated with water (W) or glycerol (G). The values are presented as the mean of three replicates. Error bars represent sd. D, Glycerol-induced changes in the 18:1 levels in leaf tissue of 4-week-old plants. The ssi2 gly1 and ssi2 act1 plants were used as controls. Plants were treated with glycerol (G) or water (W), and samples taken 72 h post treatment were analyzed for FAs using GC. The values are presented as the mean of six to eight replicates. Error bars represent sd. E, Comparison of the morphological phenotypes displayed by the ssi2 and various ssi2 fad double- and triple-mutant plants. F, Microscopy of trypan blue-stained leaves from ssi2 and various ssi2 fad double- and triple-mutant plants. G, Expression of the PR-1 and PR-2 genes in wild-type (SSI2, Nö ecotype), ssi2, and various ssi2 fad double- and triple-mutant plants. RNA gel-blot analysis was performed on 7 μg of total RNA extracted from 4-week-old soil-grown plants. Ethidium bromide staining of rRNA was used as a loading control. H, Endogenous SA and SAG levels in the leaves of 4-week-old soil-grown SSI2 (Col-0), ssi2, ssi2 fad7, and ssi2 fad7 fad8 plants. Values are presented as the mean of three replicates. Error bars represent sd. I, Growth of P. syringae on SSI2, ssi2, fad5, ssi2 fad5, fad7, ssi2 fad7, fad7 fad8, and ssi2 fad7 fad8. Four leaf discs were harvested from infected leaves at 3 d postinoculation, ground in 10 mm MgCl2, and the bacterial numbers tittered. The bacterial numbers ± sd (n = 4) presented as colony forming units (CFU) per unit leaf area of 25 mm2. The experiment was independently performed twice with similar results. J, Expression of the PDF1.2 gene in SSI2, ssi2, ssi2 fad7, and ssi2 fad7 fad8 plants in response to 50 μm JA. Samples were harvested 48 h post treatment and analyzed by RNA gel-blot analysis performed on 7 μg of total RNA. Ethidium bromide staining of rRNA was used as a loading control.
To further test the hypothesis that the glycerol sensitivity of fads is related to ssi2-associated signaling, we generated ssi2 fad3, ssi2 fad4, ssi2 fad5, and ssi2 fad7 double-mutant and ssi2 fad7 fad8 triple-mutant plants. The morphological and biochemical characteristics of ssi2 fad2 and ssi2 fad6 plants have been described earlier (Kachroo et al., 2003b). The morphological phenotypes of ssi2 fad3 and ssi2 fad4 were similar to that of ssi2 (Fig. 3E). Interestingly, ssi2 fad5 plants showed a more stunted and chlorotic phenotype and ssi2 fad7 plants were slightly less stunted than ssi2 plants. The ssi2 fad7 and ssi2 fad7 fad8 plants displayed normal leaf morphology during initial stages of growth, but developed lesions on their leaves after 2 weeks of growth (Fig. 3F). The ssi2 fad3, ssi2 fad4, and ssi2 fad5 plants all developed lesions and showed microscopic cell death. The morphological phenotype also correlated with expression of PR-1 in these plants; all the ssi2 fad plants showed high-level expression of the PR-1 gene (Fig. 3G). By contrast, the ssi2-triggered PR-2 gene expression was drastically reduced in ssi2 fad7 and ssi2 fad7 fad8 plants, but remained high in other ssi2 fad plants. Analysis of SA/SAG levels in ssi2 fad7 and ssi2 fad7 fad8 plants showed that these genotypes contained significantly lower levels of SA/SAG as compared to ssi2 (Fig. 3H). However, the levels of SA, and particularly those of SAG in ssi2 fad7 and ssi2 fad7 fad8 plants, were higher than those in wild-type plants. This suggests that fad7 and fad8 mutations have a partial effect on the ssi2-triggered phenotypes. To determine whether any correlation exists between SA levels and pathogen resistance, we tested the response of ssi2 fad7 and ssi2 fad7 fad8 plants to a virulent bacterial pathogen, P. syringae. Since ssi2 fad5 plants showed more pronounced ssi2-like phenotypes, these served as an additional control for the experiment. The fad7 fad8 mutations compromised the enhanced bacterial resistance conferred by the ssi2 mutation, but the fad5 and fad7 mutations did not have any effect (Fig. 3I). A decrease in the SA/SAG levels in ssi2 fad7 and ssi2 fad7 fad8 plants did not alter their JA responsiveness and, like ssi2, these plants continued to show basal-level expression of PDF1.2 upon exogenous application of JA (Fig. 3J). The ssi2 fad3, ssi2 fad4, and ssi2 fad5 plants were also nonresponsive to JA (data not shown). FA profiling of ssi2 fad3, ssi2 fad4, and ssi2 fad5 plants showed these contained 18:1 levels comparable to those seen in the ssi2 plants (Table III). By comparison, the 18:1 levels in ssi2 fad7 and ssi2 fad7 fad8 plants were higher than those in ssi2 and lower compared to wild-type plants. These results suggest that ssi2 phenotypes are independent of FAD3, FAD4, and FAD5 genes and partially dependent on FAD7 and FAD7 FAD8 genes.
Table III.
FA composition from leaf tissues of SSI2, fad2, ssi2 fad2, fad3, ssi2 fad3, fad4, ssi2 fad4, fad5, ssi2 fad5, fad6, ssi2 fad6, fad7, ssi2 fad7, fad7 fad8, and ssi2 fad7 fad8 plants
All measurements were made on plants grown at 22°C and data are described as mol% ± sd calculated for a sample size of six. nd, Not detected.
| Genotype | 16:0 | 16:1 | 16:2 | 16:3 | 18:0 | 18:1 | 18:2 | 18:3 | Morphology |
|---|---|---|---|---|---|---|---|---|---|
| SSI2 | 15.1 ± 0.47 | 4.5 ± 0.46 | 0.9 ± 0.36 | 16.02 ± 0.77 | 0.68 ± 0.13 | 2.9 ± 0.07 | 12.52 ± 2.36 | 47.38 ± 2.24 | Wild type |
| ssi2 | 14.12 ± 1.10 | 3.01 ± 0.65 | 0.45 ± 0.10 | 9.4 ± 1.23 | 16.1 ± 2.22 | 0.7 ± 0.10 | 13.68 ± 2.12 | 42.54 ± 2.47 | Stunted |
| fad2 | 13.7 ± 1.10 | 4.47 ± 0.42 | 1.58 ± 0.81 | 20.58 ± 0.72 | 0.42 ± 0.13 | 14.65 ± 2.47 | 4.18 ± 0.35 | 40.42 ± 1.43 | Wild type-like |
| ssi2 fad2 | 17.08 ± 1.23 | 2.66 ± 0.49 | 0.38 ± 0.08 | 7.82 ± 1.52 | 10.83 ± 0.5 | 19.54 ± 2.02 | 3.84 ± 0.40 | 37.85 ± 1.82 | ssi2-like |
| fad3 | 14.58 ± 0.53 | 4.22 ± 0.32 | 1.44 ± 0.27 | 16.4 ± 0.68 | 0.6 ± 0.12 | 3.42 ± 0.37 | 19.84 ± 1.73 | 39.5 ± 2.25 | Wild type-like |
| ssi2 fad3 | 12.48 ± 1.80 | 3.66 ± 0.28 | 0.4 ± 0.1 | 10.82 ± 2.71 | 14.72 ± 2.1 | 1 ± 0.41 | 20.3 ± 4.89 | 36.62 ± 5.6 | ssi2-like |
| fad4 | 17.88 ± 0.38 | 0.7 ± 0.07 | 1.18 ± 0.15 | 16.22 ± 0.31 | 0.6 ± 0 | 2.38 ± 0.35 | 13.00 ± 1.43 | 48.04 ± 1.59 | Wild type-like |
| ssi2 fad4 | 21.02 ± 1.34 | –nd | – | 9.94 ± 0.39 | 9.82 ± 1.49 | 0.8 ± 0.1 | 10.78 ± 1.06 | 47.64 ± 2.01 | ssi2-like |
| fad5 | 25.64 ± 0.63 | 4.04 ± 0.61 | – | – | 1.3 ± 0.1 | 2.5 ± 0.36 | 14.7 ± 1.94 | 52.18 ± 1.36 | Wild type-like |
| ssi2 fad5 | 20.22 ± 1.05 | 1.88 ± 0.14 | 0.4 ± 0.1 | – | 21.66 ± 2.0 | 1.1 ± 0.22 | 12.44 ± 0.40 | 42.3 ± 1.67 | ssi2-like |
| fad6 | 14.62 ± 0.38 | 17.25 ± 1.30 | – | – | 0.88 ± 0.1 | 22.72 ± 0.39 | 13.46 ± 0.97 | 31.07 ± 0.85 | Wild type-like |
| ssi2 fad6 | 17.6 ± 0.62 | 8.3 ± 0.55 | – | – | 11.36 ± 0.05 | 11.58 ± 0.87 | 16.4 ± 0.92 | 34.76 ± 1.76 | Larger than ssi2 |
| fad7 | 13.42 ± 0.35 | 4.6 ± 0.45 | 10.9 ± 0.35 | 4.1 ± 0.64 | 0.84 ± 0.15 | 3.84 ± 0.21 | 31.2 ± 1.94 | 31.10 ± 1.50 | Wild type-like |
| ssi2 fad7 | 19.22 ± 1.38 | 4.27 ± 0.55 | 11.2 ± 0.8 | 2.55 ± 0.5 | 15.47 ± 2.03 | 1.9 ± 0.42 | 24.85 ± 1.29 | 20.39 ± 1.40 | Larger than ssi2 |
| fad7 fad8 | 12.26 ± 0.31 | 5.36 ± 0.18 | 16.24 ± 0.78 | – | 0.52 ± 0.04 | 3.28 ± 0.63 | 53.92 ± 0.97 | 8.42 ± 1.22 | Wild type-like |
| ssi2 fad7 fad8 | 14.93 ± 1.43 | 4.65 ± 0.50 | 14.81 ± 0.20 | 0.51 ± 0.5 | 14.93 ± 2.61 | 2.05 ± 0.25 | 35.9 ± 1.48 | 12.11 ± 1.74 | Larger than ssi2 |
Phosphatidic Acid or Phosphatidic Acid-Derived Downstream Signaling Is Not Associated with the Glycerol- or ssi2-Triggered Phenotypes
The act1 mutation restores all the ssi2-triggered defense phenotypes because it increases the 18:1 levels in these plants (Kachroo et al., 2003b). Since the ACT1-catalyzed reaction eventually leads to the biosynthesis of phosphatiditic acid (PA), it is possible that the reduced levels of PA in ssi2 act1 plants contribute to restoration of mutant phenotypes. This is plausible because PA levels are known to be induced during host-pathogen interactions (De Jong et al., 2004) and PA is likely to have a role in signaling (Zhang et al., 2003). To test the role of PA in ssi2-triggered defense phenotypes, we first generated a lipid profile of ssi2 plants. The levels of PA in ssi2 plants were similar to those in wild-type plants (Fig. 4A), suggesting that high levels of PA are not responsible for ssi2 phenotypes. Since glycerol application to wild-type plants induces an ssi2-like phenotype, we measured PA levels in water- and glycerol-treated wild-type and act1 plants. As expected, the PA levels in act1 plants were approximately 2.8-fold lower than the wild-type plants, and these levels did not change significantly after glycerol application. By comparison, a marginal reduction in PA levels seen in glycerol-treated wild-type plants was not statistically significant. These results suggest that glycerol application has an impact on the ACT1-mediated acylation step without altering PA levels.
Figure 4.

PA levels and morphological and molecular analyses of ssi2 dgd1 plants. A, PA levels in ssi2 and wild-type (Col-0) and act1 plants treated with water (W) or glycerol (G). The values are presented as the mean of five replicates. Error bars represent sd. According to Student's t test, the difference in PA levels in water- and glycerol-treated samples was not significant (P < 0.05). B, Comparison of the morphological phenotypes displayed by the 4-week-old soil-grown dgd1 and ssi2 dgd1 plants. C, Microscopy of trypan blue-stained leaves from ssi2, dgd1, and ssi2 dgd1 plants. D, Expression of the PR-1 gene in ssi2, dgd1, and ssi2 dgd1 plants. RNA gel-blot analysis was performed on 7 μg of total RNA extracted from 4-week-old soil-grown plants. Ethidium bromide staining of rRNA was used as a loading control. E, Expression of the PR-1 gene and 18:1 levels in water- and glycerol-treated DGD1 (Col-0 ecotype) and dgd1 plants. RNA gel-blot analysis was performed on 7 μg of total RNA extracted from 4-week-old soil-grown plants. Ethidium bromide staining of rRNA was used as a loading control. The 18:1 levels are described as mol% and the values shown are the average of six replicates (±sd).
PA produced in the prokaryotic pathway is converted to diacylglycerol, which then serves as a precursor for the synthesis of monogalactosyldiacylglycerol (MGDG) and digalactosyldiacylglycerol (DGDG; also see Fig. 8). To understand the role of these components in ssi2-triggered signaling, we generated ssi2 dgd1 double-mutant plants, which are impaired in the synthesis of DGDG. The ssi2 dgd1 double-mutant plants showed rosette leaf arrangement like that of dgd1 plants, but much smaller, and showed visible and microscopic cell death lesions on their leaves (Fig. 4, B and C). The double-mutant plants contained low levels of 18:1 and accumulated high levels of PR-1 (Table IV; Fig. 4D). These results were further corroborated by glycerol application to dgd1 plants; as in wild-type plants, glycerol treatment of dgd1 plants caused a decline in 18:1 levels and induced high-level expression of PR-1 (Fig. 4E). Together, these results suggest that a mutation in dgd1 is not sufficient to restore ssi2 phenotypes. Furthermore, the ssi2-triggered phenotypes in dgd1 plants were restored by the act1 mutation, as judged by the lack of cell death lesions on ssi2 act1 dgd1 leaves (data not shown). Other ssi2-like phenotypes could not be verified in the ssi2 act1 dgd1 triple-mutant plants because they were severely dwarfed (similar to act1 dgd1 plants; Klaus et al., 2002) and did not produce any viable seeds.
Table IV.
FA composition from leaf tissues of SSI2, ssi2, nho1, ssi2 nho1, dgd1, and ssi2 dgd1 plants
All measurements were made on plants grown at 22°C and data are described as mol% ± sd calculated for a sample size of six.
| Genotype | 16:0 | 16:1 | 16:2 | 16:3 | 18:0 | 18:1 | 18:2 | 18:3 | Morphology |
|---|---|---|---|---|---|---|---|---|---|
| SSI2 | 16.16 ± 0.8 | 4.24 ± 0.29 | 1.24 ± 0.08 | 16.44 ± 0.38 | 0.92 ± 0.32 | 2.58 ± 0.08 | 13.44 ± 0.77 | 44.98 ± 0.89 | Wild type |
| ssi2 | 14.62 ± 2.13 | 3.12 ± 0.59 | 0.52 ± 0.18 | 10.55 ± 0.83 | 12.97 ± 2.71 | 0.95 ± 0.31 | 12.32 ± 2.23 | 44.95 ± 2.96 | Stunted |
| nho1 | 15.58 ± 0.45 | 4.04 ± 0.23 | 1.06 ± 0.05 | 16.48 ± 0.25 | 0.76 ± 0.11 | 2.58 ± 0.38 | 13.06 ± 0.89 | 46.44 ± 1.40 | Wild type-like |
| ssi2 nho1 | 17.1 ± 1.66 | 2.73 ± 0.6 | 0.18 ± 0.16 | 10.2 ± 1.1 | 13.8 ± 2.4 | 0.95 ± 0.1 | 9.78 ± 0.45 | 45.26 ± 2.59 | ssi2-like |
| dgd1 | 18.37 ± 1.55 | 4.38 ± 0.6 | 0.48 ± 0.26 | 5.87 ± 2.37 | 1.82 ± 1.91 | 2.5 ± 0.3 | 12.5 ± 1.82 | 54.08 ± 3.59 | Smaller than wt |
| ssi2 dgd1 | 18.83 ± 0.97 | 2.65 ± 0.25 | 0.25 ± 0.2 | 4.89 ± 1.24 | 12.66 ± 1.51 | 1.12 ± 0.21 | 11.26 ± 0.70 | 48.34 ± 2.59 | ssi2-like |
Glycerol Application Lowers Total Lipid Content in Wild-Type Plants
To determine whether the glycerol-mediated induction of cell death and defense gene expression in wild-type plants is associated with an altered lipid profile, we measured the levels of individual lipids and the levels of total acyl carbons on each of these lipids. The lipid profiles were obtained for leaves of wild-type and act1 plants treated with water or glycerol and compared with those of ssi2 plants. Glycerol application resulted in a marginal decline in the levels of leaf MGDG and DGDG in wild-type plants and a marginal increase in the levels of phosphotidylglycerol (PG) and phosphatidylethanolamine (PE). By comparison, act1 plants did not show any significant alteration in the levels of MGDG, DGDG, PG, and PE (Fig. 5A). The levels of total acyl carbons and the total double bonds on each individual lipid did not alter significantly between glycerol- and water-treated samples (Supplemental Fig. 1). These results suggest that glycerol application does not significantly alter the levels of plastidal and/or extraplastidal lipids or the number of acyl carbon groups on the individual lipids.
Figure 5.

Lipid profile and total lipid content. A, Profile of total lipids extracted from Col-0 and act1 plants treated with water or glycerol. The values are presented as the mean of five replicates. Error bars represent sd. PC, Phosphatidylcholine; PI, phosphatidylinositol; PS, phosphatidylserine. B, Comparison of total lipid content in water- and glycerol-treated SSI2 (Col-0) and act1 plants with that of ssi2. The values are presented as the mean of five replicates. Error bars represent sd.
Following up on the observation that the ssi2 plants showed a significant reduction in total lipid content in comparison to wild-type plants (Fig. 5B), we next determined total lipid content in glycerol- and water-treated wild-type plants. Interestingly, the wild-type plants showed a statistically significant decline in the total nanomoles of lipids per milligram dry weight (223 versus 164) upon glycerol application (Fig. 5B). Although the total lipid content of act1 plants was significantly lower than wild-type plants, it was not further altered upon glycerol treatment. These results suggest that glycerol application possibly slows down the growth rate of the plants similar to that observed in the ssi2 plants.
Inability to Metabolize Glycerol Abolishes the Glycerol-Induced Responses
To determine the specificity of the glycerol-mediated induction of defense responses, and to define other components of the glycerol-triggered defense pathway, we analyzed a mutant line, which is impaired in glycerol metabolism due to a mutation in the gene encoding glycerol kinase (GK; NHO1/GLI1; Kang et al., 2003; Eastmond, 2004). As seen in the act1 plants, the nho1 plants did not show any reduction in their 18:1 levels upon glycerol treatment (Fig. 6A). By comparison, wild-type, ssi2 gly1-3, and ACT1-overexpressing (35S-ACT1) plants showed a significant reduction in 18:1 (Fig. 6A). A glycerol-mediated decline in 18:1 levels also correlated with the amount of SA and SAG accumulated in these plants and the levels of PR-1 gene expression. Upon glycerol treatment, the highest levels of SA and PR-1 gene expression were seen in 35S-ACT1 plants, followed by wild-type plants (Fig. 6, B and C). The nho1 plants accumulated near-basal levels of SA/SAG, similar to the act1 and ssi2 sid2 plants, and expressed basal levels of PR-1 (Figs. 6, B and C, and 2C). These results further support the idea that the inability to metabolize glycerol confers tolerance to glycerol and abolishes glycerol-induced defense responses.
Figure 6.

Comparison of glycerol-responsiveness in wild-type, act1, nho1, ssi2 gly1-3, and 35S-ACT1 plants and double-mutant analysis of ssi2 nho1 plants. A, Glycerol-induced changes in the 18:1 levels in leaf tissue of 4-week-old plants. Plants were treated with glycerol (G) or water (W) and samples taken 72 h post treatment were analyzed for 18:1 content using GC. The values shown are an average of six independent replicates. Error bars represent sd. B, Endogenous SA levels in the leaves of 4-week-old soil-grown plants. SSI2 indicates Col-0 ecotype. The values presented are averages of three replicates. Error bars represent sd. C, Expression of the PR-1 gene in water- and glycerol-treated plants. RNA gel-blot analysis was performed on 7 μg of total RNA extracted 72 h after glycerol treatment. The ssi2 gly1-3 plants used in this study were 3 weeks old. Ethidium bromide staining of rRNA was used as a loading control. D, Comparison of the morphological phenotypes displayed by the 16-d-old soil-grown ssi2 and ssi2 nho1 plants. E, Microscopy of trypan blue-stained leaves from ssi2 and various ssi2 nho1 plants. F, Expression of the PR-1 gene in ssi2 and ssi2 nho1 plants. RNA gel-blot analysis was performed on 7 μg of total RNA extracted from 16-d-old soil-grown plants. Ethidium bromide staining of rRNA was used as a loading control.
Because glycerol treatment has an impact on the ACT1-catalyzed step (Kachroo et al., 2004), it is very likely that the GK-generated G3P is channeled into the prokaryotic pathway of lipid biosynthesis. Our previous results show that a reduction in G3P levels leads to the accumulation of 18:1 and reversion of ssi2 phenotypes in an age-dependent manner (Kachroo et al., 2004). To determine the relative contribution of GK toward the generation of G3P pools and its effect on ssi2 phenotypes, we mobilized the nho1 mutation in the ssi2 background and analyzed double-mutant plants for various ssi2-like phenotypes. During the initial stages of growth, the ssi2 nho1 double-mutant plants were slightly larger than ssi2 plants and developed significantly fewer visible or microscopic cell death lesions on their leaves (Fig. 6, D and E). Although cell death lesions in ssi2 nho1 plants did appear toward the later phase of growth (Fig. 6E), absence of cell death during the initial growth phase did not reduce or abolish constitutive expression of PR-1 (Fig. 6F). Furthermore, the PR-1 phenotype in ssi2 nho1 plants correlated well with reduced levels of 18:1, similar to those seen in the ssi2 plants (Table IV). These results suggest that conversion of exogenous glycerol to G3P is required for the glycerol-mediated induction of defense and that NHO1 may not be the major source of the plastidal G3P pool.
The act1-Mediated Rescue of ssi2-Triggered Phenotypes Does Not Involve Further Desaturation of 18:1
Previously, we reported that ssi2 act1 plants show wild type-like morphological and molecular phenotypes (Kachroo et al., 2003b). It was also shown that high 18:1 levels in these plants restore their phenotypes. However, it could not be ruled out that the increased 18:1 was further converted to 18:2 and/or 18:3 in membrane lipids, and these were responsible for the phenotypic reversion of ssi2 plants. Since SSI2 also acts on palmitic acid (16:0) substrate (Kachroo et al., 2001), it is also possible that 16:0-derived FAs may play a role in ssi2 act1 plants. If palmitoleic acid (16:1), 18:2, or 18:3 were important, the ssi2 act1 plants would require function of the FAD genes for their phenotypes. We therefore created triple-mutant plants in fad2, fad3, fad4, fad5, fad6, and fad7 backgrounds and analyzed these for various ssi2-like phenotypes. The conversion of 18:1 to 18:2 in plastidal and extraplastidal lipids is catalyzed by FAD6 and FAD2, respectively. The conversion of 18:2 to 18:3 in plastidal and extraplastidal lipids is catalyzed by FAD7-, FAD8-, and FAD3-encoded desaturases, respectively (Ohlrogge and Browse, 1995). The FAD4- and FAD5-encoded plastidal desaturases catalyze the conversion of 16:0 to 16:1 on PG and MGDG, respectively (Ohlrogge and Browse, 1995). All of the triple-mutant plants showed ssi2 act1-like pale leaf morphology and absence of any visible or microscopic cell death (Fig. 7, A and B). Except for ssi2 act1 fad2 plants, which grew slowly, all the other triple-mutant plants had similar growth rates to ssi2 act1 plants. Further, all triple-mutant plants showed basal-level expression of PR-1 (Fig. 7C) and retained their JA responsiveness (data not shown). The FA profiling showed that ssi2 act1 and all triple-mutant plants accumulated high levels of 18:1 in their leaves (Table V). The highest levels of 18:1 were found in the ssi2 act1 fad2 plants, which could be because these plants are blocked in the utilization of 18:1 in both the prokaryotic and the eukaryotic pathways. Consistent with the presence of the act1 mutation, both ssi2 act1 and ssi2 act1 fad plants contained negligible amounts of 16:3. A reduction was also seen in 18:3 levels in ssi2 act1 fad2, ssi2 act1 fad6, and ssi2 act1 fad7 plants. However, this did not have an impact on JA responsiveness in these plants, as both fad2, fad6, and fad7 single-mutant plants and ssi2 act1 fad2, ssi2 act1 fad6, and ssi2 act1 fad7 triple-mutant plants expressed high levels of PDF1.2 in response to JA treatment (data not shown). Taken together, these results show that restoration of ssi2 phenotypes by a mutation in act1 is not affected by the inability of these plants to convert 18:1 to 18:2 or 18:3 in plastidic or extraplastidic lipids and 16:0 to 16:1 in plastidic lipids, and thus confirms that 18:1, not 18:2, 18:3, or 16:1, is responsible for this restoration.
Figure 7.

Morphological and molecular phenotypes of ssi2 act1 and various ssi2 act1 fad triple-mutant plants. A, Comparison of the morphological phenotypes displayed by the 4-week-old soil-grown ssi2 act1 and various ssi2 act1 fad triple-mutant plants. B, Microscopy of trypan blue-stained leaves from ssi2 act1 and ssi2 act1 fad triple-mutant plants. C, Expression of the PR-1 gene in wild-type, ssi2, ssi2 act1, and various ssi2 act1 fad triple-mutant plants. RNA gel-blot analysis was performed on 5 μg of total RNA extracted from 4-week-old soil-grown plants. Ethidium bromide staining of rRNA was used as a loading control.
Table V.
FA composition from leaf tissues of ssi2, act1, ssi2 act1, ssi2 act1 fad2, ssi2 act1 fad3, ssi2 act1 fad5, ssi2 act1 fad6, and ssi2 act1 fad7 plants
All measurements were made on plants grown at 22°C and data are described as mol% ± sd calculated for a sample size of six. nd, Not detected.
| Genotype | 16:0 | 16:1 | 16:2 | 16:3 | 18:0 | 18:1 | 18:2 | 18:3 | Morphology |
|---|---|---|---|---|---|---|---|---|---|
| ssi2 | 14.81 ± 2.10 | 2.86 ± 0.44 | 0.45 ± 0.18 | 9.0 ± 1.06 | 15.8 ± 2.82 | 0.6 ± 0.18 | 15.68 ± 1.72 | 40.8 ± 1.45 | Stunted |
| act1 | 12.5 ± 0.71 | 2.92 ± 0.32 | 0.2 ± 0.16 | 0.35 ± 0.12 | 1.15 ± 0.1 | 10.7 ± 1.71 | 14.58 ± 1.27 | 57.6 ± 2.72 | Wild type-like |
| ssi2 act1 | 9.17 ± 1.30 | 1.62 ± 0.22 | 0.45 ± 0.12 | –nd | 9.5 ± 2.23 | 7.22 ± 2.2 | 16.52 ± 1.23 | 55.52 ± 3.12 | Pale wild type-like |
| fad2 | 13.7 ± 1.10 | 4.47 ± 0.42 | 1.58 ± 0.81 | 20.58 ± 0.72 | 0.42 ± 0.13 | 14.65 ± 2.47 | 4.18 ± 0.35 | 40.42 ± 1.43 | Wild type-like |
| ssi2 act1fad2 | 4.2 ± 0.23 | 1.2 ± 0.5 | – | – | 13.2 ± 1.36 | 40.9 ± 2.08 | 3.2 ± 0.55 | 37.3 ± 2.95 | Pale wild type-like |
| fad3 | 14.58 ± 0.53 | 4.22 ± 0.32 | 1.44 ± 0.27 | 16.4 ± 0.68 | 0.6 ± 0.12 | 3.42 ± 0.37 | 19.84 ± 1.73 | 39.5 ± 2.25 | Wild type-like |
| ssi2 act1fad3 | 8.18 ± 0.82 | 2 ± 0.45 | – | – | 9.88 ± 1.20 | 3.32 ± 0.79 | 24.16 ± 3.6 | 52.46 ± 4.01 | Pale wild type-like |
| fad4 | 17.88 ± 0.38 | 0.7 ± 0.07 | 1.18 ± 0.15 | 16.22 ± 0.31 | 0.6 ± 0 | 2.38 ± 0.35 | 13.00 ± 1.43 | 48.04 ± 1.59 | Wild type-like |
| ssi2 act1fad4 | 16.7 ± 0.36 | – | – | – | 6.46 ± 0.61 | 2.54 ± 0.1 | 22 ± 1.24 | 52.3 ± 1.23 | Pale wild type-like |
| fad5 | 25.64 ± 0.63 | 4.04 ± 0.61 | – | – | 1.3 ± 0.1 | 2.5 ± 0.36 | 14.7 ± 1.94 | 52.18 ± 1.36 | Wild type-like |
| ssi2 act1fad5 | 8.16 ± 0.74 | 1.54 ± 0.25 | – | – | 13.24 ± 0.32 | 3.38 ± 1.06 | 17.76 ± 2.04 | 55.92 ± 1.97 | Pale wild type-like |
| fad6 | 14.62 ± 0.38 | 17.25 ± 1.30 | – | – | 0.88 ± 0.10 | 22.72 ± 0.39 | 13.46 ± 0.97 | 31.07 ± 0.85 | Wild type-like |
| ssi2 act1fad6 | 13.4 ± 1.2 | 14.6 ± 0.7 | – | – | 11.5 ± 1.0 | 18.2 ± 1.2 | 13.7 ± 2.1 | 28.6 ± 2.2 | Pale wild type-like |
| fad7 | 13.42 ± 0.35 | 4.6 ± 0.45 | 10.9 ± 0.35 | 4.1 ± 0.64 | 0.84 ± 0.15 | 3.84 ± 0.21 | 31.2 ± 1.94 | 31.10 ± 1.50 | Wild type-like |
| ssi2 act1fad7 | 11.67 ± 1.84 | – | – | – | 16.05 ± 0.44 | 7.02 ± 0.74 | 30.27 ± 5.4 | 34.99 ± 5.0 | Pale wild type-like |
DISCUSSION
Glycerol plays a major role in various metabolic processes, including its conversion to G3P, which serves as a building block for glycerolipid biosynthesis. In plants, G3P is synthesized via the GK-mediated phosphorylation of glycerol or via the G3Pdh-mediated reduction of dihyroxyacetone phosphate (DHAP; Kang et al., 2003; Eastmond, 2004; Kachroo et al., 2004). Both GK and G3Pdh have already been shown to participate in host-pathogen interactions (Kang et al., 2003; Kachroo et al., 2004; Nandi et al., 2004). Our previous observation that exogenous application of glycerol induces defense responses in plants further reinforces the importance of glycerol-mediated signaling. In this study, we attempted to delineate the components of the glycerol- and ssi2-mediated defense pathway and assess their impact on resistance to pathogens.
Exogenous glycerol application to wild-type plants results in the accumulation of SA and induction of PR genes, which suggests that the SA pathway is up-regulated in these plants. These findings are further supported by the observations that both the sid2 mutation and the expression of the nahG transgene were able to abolish the glycerol-mediated increases in SA and PR expression (Fig. 1, B and C). However, both sid2 and nahG plants showed glycerol-induced leaf cell death, thus disassociating SA accumulation from cell death. The defense phenotypes induced upon glycerol application to mutants impaired in R gene and SA signaling were similar to the phenotypes seen in ssi2 double mutants containing the respective alteration in R gene or SA pathway. For example, ssi2 sid2 and ssi2 nahG plants showed cell death and basal-level expression of the PR-1 gene (Fig. 2, B and D). In addition, similar to glycerol-treated npr1 and eds5 plants, the ssi2 npr1 and ssi2 eds5 plants showed an increase in PR-2 and a decrease in PR-1 expression (Figs. 1C and 2D). Similarly, ssi2 eds1, ssi2 pad4, ssi2 eds5, ssi2 ndr1, ssi2 sid2, and ssi2 nahG plants as well as the glycerol-treated single mutants showed ssi2-like reduced levels of 18:1 (Fig. 1E; Table II). These observations argue that exogenous application of glycerol induces the same signaling pathways as the ssi2 mutation.
A comprehensive analysis of the ssi2 phenotypes in double-mutant backgrounds defective in SA or R gene signaling pathways showed that several of these mutations had an effect on the morphology of the plant. The ssi2 eds1, ssi2 eds5, ssi2 pad4, ssi2 sid2, and ssi2 nahG plants were larger than the ssi2 plants. A larger morphology is likely due to a reduction in SA/SAG levels in these plants (Fig. 2, A and C). However, ssi2 ndr1 plants also showed a reduction in SA/SAG levels, but these were morphologically similar to ssi2 plants. This suggests that factors other than SA may also contribute to stunted morphology of ssi2 plants. High levels of SA in ssi2 plants induce expression of EDS1 and PAD4 genes and these levels are abolished by the eds1 and pad4 mutations (Chandra-Shekara et al., 2004). Thus, a dependence of ssi2-triggered resistance on EDS1 and PAD4 is likely to be associated with increased expression of these in the ssi2 background.
Besides the SA-signaling mutants, mutations in fad7 and fad7 fad8 were also able to significantly reduce SA/SAG levels in the ssi2 plants (Fig. 3H). Although the fad7 and fad7 fad8 mutations down-regulated ssi2-triggered PR-2 gene expression, these mutations were unable to completely restore SA- or JA-mediated defenses in ssi2 plants (Fig. 3, G and J). One possible explanation for these observations would be that fad7 and fad7 fad8 mutations allow increased accumulation of 18:1 in ssi2 plants, which partially restored the ssi2-triggered phenotypes. Since fad7 and fad8 mutations block the step leading to the synthesis of 18:3 in plastidal membrane lipids, these mutations might cause a backup effect, resulting in the accumulation of an 18:1-ACP precursor. This idea is supported by the observation that 18:1 levels in fad7 and fad7 fad8 mutants were higher than in the wild-type plants. Similarly, the 18:1 levels in ssi2 fad7 and ssi2 fad7 fad8 plants were consistently higher compared to those of the ssi2 plants (Table III). The fad7 and fad7 fad8 plants also showed a slower and less drastic decline in their 18:1 levels upon exogenous application of glycerol (Fig. 3D). Interestingly, the partial restoration of phenotypes displayed by ssi2 fad7 and ssi2 fad7 fad8 plants was similar to that seen in ssi2 fad6 (Kachroo et al., 2003b). The fad6 mutants have increased accumulation of 18:1 in membranous lipids; thus it is likely that this mutation causes a similar backup effect resulting in accumulation of free 18:1 or 18:1-ACP in the plastids. Another plausible explanation for glycerol tolerance of fad7 and fad7 fad8 plants is that levels of trienoic acids regulate SA levels and a reduction in these compromises the SA-mediated responses. This is supported by the observation that glycerol treatment or the presence of the ssi2 mutation was unable to trigger accumulation of high levels of SA in the fad7 or fad7 fad8 plants (Fig. 3, C and H).
Epistatic analysis between ssi2 and various fad mutations showed that, except fad7 fad8, these mutations are unable to restore altered defense signaling in the ssi2 plants. The fad7 fad8 mutation prevents the synthesis of trienoic FAs in the chloroplast resulting in compromised resistance to several avirulent P. syringae strains (Yaeno et al., 2004). Our study shows that fad7 fad8 plants are also compromised in their resistance to the virulent P. syringae strain (Fig. 3I). Consistent with these data, the ssi2-triggered resistance was compromised in ssi2 fad7 fad8 plants. It is possible that enhanced susceptibility of ssi2 fad7 fad8 plants was associated with low levels of SA and SAG accumulation. However, the levels of SA/SAG in ssi2 fad7 plants were comparable to that of ssi2 fad7 fad8, and yet these plants were more tolerant to infection by P. syringae. In comparison to ssi2 fad7 plants, the ssi2 fad7 fad8 plants were more severely compromised in their levels of trienoic FAs, which suggests that, besides SA, levels of trienoic FAs may also be required for ssi2-triggered resistance to P. syringae.
In contrast to fad7, the fad5 and fad3 plants accumulated higher levels of SA than wild type upon exogenous application of glycerol (Fig. 3C). However, unlike fad5, the fad3 plants did not show hypersensitivity toward glycerol (Fig. 3A). Introduction of the fad5 mutation in the ssi2 plants enhanced their morphological severity and cell death phenotypes, but did not affect the levels of PR gene expression in these plants (Fig. 3, E–G). One possible explanation is that FAD5 or FAD5-derived components act to balance the negative effects caused by the ssi2 mutation and the absence of these accentuates the effects of the ssi2 mutation. These results further demonstrate common features between glycerol- and ssi2-mediated effects.
Epistatic analysis between ssi2 act1 and various fad mutations showed that all triple-mutant plants remained unaffected by a mutation in any of the fad genes (Fig. 7). Together, these results suggest that levels of 16:1, 16:3, 18:2, and 18:3 are not critical for ssi2 phenotypes. Furthermore, they show that 18:1-derived signaling does not go through 18:2 or 18:3 in plastidal or extraplastidal lipids. Since ssi2 or glycerol-treated wild-type or act1 plants do not show any decrease or increase in PA levels, respectively, we argue that 18:1-mediated signaling is not associated with alterations in PA levels (Fig. 4A). This is further supported by the double-mutant analysis of ssi2 dgd1 plants, which show all the ssi2-related phenotypes (Fig. 4, B–D).
Previously, we showed that act1 plants were unable to induce a defense response upon exogenous treatment with glycerol (Kachroo et al., 2004). We reasoned that exogenous glycerol was converted to G3P in wild-type plants, which quenched 18:1 and produced an ssi2-like phenotype. Since act1 plants are unable to acylate 18:1 on a G3P backbone, glycerol application of act1 plants did not lower 18:1 levels and did not induce the SA pathway (Kachroo et al., 2004). Here, we show that the nho1 mutant plants behave similar to act1 plants, neither reducing their 18:1 levels nor inducing SA or PR gene expression upon glycerol application (Fig. 6, A–C). Because NHO1 encodes a GK, the nho1 plants are unable to utilize the exogenously provided glycerol for G3P synthesis and thereby unable to deplete the 18:1 pool in the presence of excess glycerol. These results suggest that conversion of exogenously applied glycerol to G3P is mediated via GK. Interestingly, unlike the gly1 mutation (inhibiting the synthesis of G3P from DHAP), a mutation in nho1 only slightly improves the morphological phenotype of ssi2, but does not alter the FA profile in leaf tissues or the ssi2-triggered defense phenotypes (Fig. 6; Table IV). This suggests that the NHO1-derived G3P may contribute only marginally to the plastidal G3P pool (Fig. 8, dashed line). However, these data do not correlate with the observation that exogenous application of glycerol can have an impact on the ACT1-mediated acylation step and lower 18:1 levels. A likely scenario explaining both results would be that exogenous application of glycerol generates an excess of G3P in the cytoplasm, which in turn increases the proportion of NHO1-deived G3P entering into plastids. An increase in plastidal G3P levels would in turn quench 18:1 levels and also lead to hypersensitivity toward glycerol in ACT1-overexpressing lines (Fig. 6). Since NHO1 is vital for limiting the growth of nonhost isolates of P. syringae (Kang et al., 2003), it is likely that G3P levels and/or G3P-glycerol metabolism in nho1 plants contribute to nonhost resistance, but do not affect defense responses to virulent pathogens. Presence of several isoforms of G3Pdh in the Arabidopsis genome (Wei et al., 2001; Shen et al., 2003) also suggests that there are several other enzymes contributing to G3P biosynthesis and that relative contributions of these may also influence defense responses.
In conclusion, we show that ssi2-triggered signaling requires components of both SA and FA pathways and is independent of the levels of 16:1, 16:3, 18:2, 18:3, and PA. A reduction in ssi2-triggered increase in SA levels by mutations in the fad7 fad8 genes further establishes a link between SA and FA pathways. We also show that glycerol- and ssi2-mediated signaling pathways overlap and have presented a link between glycerol catabolism and SA signaling. However, it is not yet clear how a reduction in 18:1 levels in ssi2 plants triggers the SA pathway and more work will be required to unravel the biochemical complexity of this novel signaling pathway.
MATERIALS AND METHODS
Plant Growth Conditions and Genetic Analysis
Plants were grown in the MTPS 144 Conviron walk-in chambers at 22°C, 65% relative humidity, and 14-h photoperiod. Mutations affecting the SA signal transduction pathway were transferred in the ssi2 background by pollinating flowers of the ssi2 plants with pollen from npr1-5, eds1-2, pad4-1, eds5-1, ndr1-1, or sid2-1 plants. The nahG and ssi2 nahG transgenic plants used in this study have been described by Shah et al. (2001). Mutations affecting FAD or lipid biosynthesis were transferred in the ssi2 background by pollinating flowers of the ssi2 plants with pollen from fad3-1, fad4-1, fad5-1, fad6-1, fad7-2, and fad7-1 fad8-1. To mobilize various fad mutations in the ssi2 act1 background, pollen from fad2-1, fad3-1, fad4-1, fad5-1, fad6-1, and fad7-1 plants was used to pollinate the ssi2 act1 plants. The ssi2 dgd1 and ssi2 nho1 plants were obtained by pollinating flowers of the ssi2 plant with pollen from dgd1-1 and nho1 plants, respectively. The ssi2 dgd1 act1 plants were obtained by pollinating flowers of the ssi2 dgd1 plant with pollen from ssi2 act1 plants.
The double and triple mutants were identified by cleaved amplified polymorphic sequence (CAPS) or derived-CAPS analyses and by analyzing FA profiles. The genotypes at the ssi2 and act1 loci were determined (Kachroo et al., 2001, 2003b). To distinguish FAD3 and NHO1 wild-type and mutant alleles, we sequenced the fad3 and nho1 genes and developed CAPS and derived-CAPS markers, respectively.
RNA Extraction and Northern Analyses
Small-scale extraction of RNA from one or two leaves was performed in the TRIzol reagent (Invitrogen) following the manufacturer's instructions. Northern-blot analysis and synthesis of random primed probes for PR-1, PR-2, and PDF1.2 were carried out (Kachroo et al., 2001).
Trypan Blue Staining
Leaf samples were taken from 2- or 4-week-old plants grown on soil. Trypan blue staining was performed as described (Chandra-Shekara et al., 2006).
SA, FA, and Lipid Analyses
SA and SAG were extracted and measured from 0.2 to 0.3 g fresh weight of leaf tissue (Chandra-Shekara et al., 2004). FA analysis (Dahmer et al., 1989; He et al., 2002) and lipid extraction (Welti et al., 2002) were carried out as described previously. Lipid profiles and acyl group identification were carried out using an automated electrospray ionization-tandem mass spectrometry facility available at the Kansas Lipidomics Center.
Glycerol and JA Treatments
Glycerol treatments were carried out by spraying 50 mm solution of glycerol prepared in sterile water. All observations were made 3 d post treatment. JA treatments were carried out as described by Kachroo et al. (2001).
Pathogen Infection
Inoculations with Peronospora parasitica Emco5 (Kachroo et al., 2001) and Pseudomonas syringae were conducted as described previously (Shah et al., 2001).
Supplementary Material
Acknowledgments
We would like to thank David Hildebrand for useful discussions, John Johnson for help with gas chromatography, and Mary Roth, Ruth Welti, and the Kansas Lipidomics Center for help with lipid profiling. We are grateful to Jian-Min Zhou for providing us with nho1 (gli1) seeds, Jane Glazebrook for pad4 seeds, Jane Parker for eds1 seeds, Brian Staskawicz for ndr1 seeds, Xinnian Dong for npr1 seeds, Fred Ausubel for eds5 and sid2 seeds, and the Arabidopsis Biological Resource Center (ABRC) database for providing seeds for dgd1 and various fad mutants. We would also like to thank Amy Crume for help with managing the plant growth facility, Joanne Holden for assistance with SA measurements, and David Smith and Lisa Vaillancourt for critical comments on this manuscript.
This work was supported by grants from the National Science Foundation (grant no. MCB 0421914), U.S. Department of Agriculture National Research Initiative (grant no. 2004–03287), and Kentucky Science and Engineering Foundation (419–RDE–004, 04RDE–006, 820–RDE–007). This study is publication number 05–12–127 of the Kentucky Agricultural Experiment Station.
The authors responsible for distribution of materials integral to the findings presented in this article in accordance with the policy described in the Instructions for Authors (www.plantphysiol.org) are: Pradeep Kachroo (pk62@uky.edu) and Aardra Kachroo (apkach2@uky.edu).
The online version of this article contains Web-only data.
Article, publication date, and citation information can be found at www.plantphysiol.org/cgi/doi/10.1104/pp.105.071662.
References
- Browse J, McConn M, James D, Miquel M (1993) Mutants of Arabidopsis deficient in the synthesis of α-Linolenate: biochemical and genetic characterization of the endoplasmic reticulum linoleoyl desaturase. J Biol Chem 268: 16345–16351 [PubMed] [Google Scholar]
- Browse J, McCourt P, Somerville CR (1985) A mutant of Arabidopsis lacking a chloroplast-specific lipid. Science 277: 763–765 [DOI] [PubMed] [Google Scholar]
- Cao H, Glazebrook J, Clarke JD, Volko S, Dong X (1997) The Arabidopsis NPR1 gene that controls systemic acquired resistance encodes a novel protein containing ankyrin repeats. Cell 88: 57–63 [DOI] [PubMed] [Google Scholar]
- Century KS, Shapiro AD, Repetti PP, Dahlbeck D, Holub E, Staskawicz BJ (1997) NDR1, a pathogen-induced component required for Arabidopsis disease resistance. Science 278: 1963–1965 [DOI] [PubMed] [Google Scholar]
- Chandra-Shekara AC, Gupte M, Navarre DA, Raina S, Raina R, Klessig D, Kachroo P (2006) Light-dependent hypersensitive response and resistance signaling to turnip crinkle virus in Arabidopsis. Plant J (in press) [DOI] [PubMed]
- Chandra-Shekara AC, Navarre D, Kachroo A, Kang H-G, Klessig DF, Kachroo P (2004) Signaling requirements and role of salicylic acid in HRT- and rrt-mediated resistance to turnip crinkle virus in Arabidopsis. Plant J 40: 647–659 [DOI] [PubMed] [Google Scholar]
- Dahmer ML, Fleming PD, Collins GB, Hildebrand DF (1989) A rapid screening for determining the lipid composition of soybean seeds. J Am Oil Chem Soc 66: 543–548 [Google Scholar]
- De Jong CF, Laxalt AM, Bargmann BOR, de Wit PJGM, Joosten MHAJ, Munnik T (2004) Phosphatidic acid accumulation is an early response in the Cf-4/Avr4 interaction. Plant J 39: 1–12 [DOI] [PubMed] [Google Scholar]
- Delaney TP, Uknes S, Vernooij B, Friedrich L, Weymann K, Negrotto D, Gaffney T, Gut-Rella M, Kessmann H, Ward E, et al (1994) A central role of salicylic acid in plant disease resistance. Science 266: 1247–1250 [DOI] [PubMed] [Google Scholar]
- Dormann P, Hoffmann-Benning S, Balbo I, Benning C (1995) Isolation and characterization of an Arabidopsis mutant deficient in the thylakoid lipid digalactosyl diacylglycerol. Plant Cell 7: 1801–1810 [DOI] [PMC free article] [PubMed] [Google Scholar]
- Durrant WE, Dong X (2004) Systemic acquired resistance. Annu Rev Phytopathol 42: 185–209 [DOI] [PubMed] [Google Scholar]
- Eastmond PJ (2004) Glycerol-insensitive Arabidopsis mutants: gli1 seedlings lack glycerol kinase, accumulate glycerol and are more resistant to abiotic stress. Plant J 37: 617–625 [DOI] [PubMed] [Google Scholar]
- Falcone DL, Gibson S, Lemieux B, Somerville C (1994) Identification of a gene that complements an Arabidopsis mutant deficient in chloroplast ω-6 desaturase activity. Plant Physiol 106: 1453–1459 [DOI] [PMC free article] [PubMed] [Google Scholar]
- Falk A, Feys BJ, Frost LN, Jones JDG, Daniels MJ, Parker JE (1999) EDS1, an essential component of R gene mediated disease resistance in Arabidopsis has homology to eukaryotic lipases. Proc Natl Acad Sci USA 96: 3292–3297 [DOI] [PMC free article] [PubMed] [Google Scholar]
- Gaffney T, Friedrich L, Vernooij B, Negrotto D, Nye G, Uknes S, Ward E, Kessmann H, Ryals JA (1993) Requirement of salicylic acid for the induction of systemic acquired resistance. Science 261: 754–756 [DOI] [PubMed] [Google Scholar]
- Gibson S, Arondel V, Iba K, Somerville C (1994) Cloning of a temperature-regulated gene encoding a chloroplast ω-3 desaturase from Arabidopsis thaliana. Plant Physiol 106: 1615–1621 [DOI] [PMC free article] [PubMed] [Google Scholar]
- He Y, Fukushige H, Hildebrand DF, Gan S (2002) Evidence supporting a role of jasmonic acid in Arabidopsis leaf senescence. Plant Physiol 128: 876–884 [DOI] [PMC free article] [PubMed] [Google Scholar]
- Iba K, Gibson S, Nishiuchi T, Fuse T, Nishimura M, Arondel V, Hugly S, Somervllle C (1993) A gene encoding a chloroplast omega-3 fatty acid desaturase complements alterations in fatty acid desaturation and chloroplast copy number of the fad7 mutant of Arabidopsis thaliana. J Biol Chem 268: 24099–24105 [PubMed] [Google Scholar]
- Jirage D, Tootle TL, Reuber TL, Frost LN, Feys BJ, Parker JE, Ausubel FM, Glazebrook J (1999) Arabidopsis thaliana PAD4 encodes a lipase-like gene that is important for salicylic acid signaling. Proc Natl Acad Sci USA 96: 13583–13588 [DOI] [PMC free article] [PubMed] [Google Scholar]
- Kachroo P, Kachroo A, Lapchyk L, Hildebrand D, Klessig D (2003. a) Restoration of defective cross talk in ssi2 mutants: role of salicylic acid, jasmonic acid and fatty acids in SSI2-mediated signaling. Mol Plant Microbe Interact 16: 1022–1029 [DOI] [PubMed] [Google Scholar]
- Kachroo A, Lapchyk L, Fukushigae H, Hildebrand D, Klessig DF, Kachroo P (2003. b) Plastidial fatty acid signaling modulates salicylic acid- and jasmonic acid-mediated defense pathways in the Arabidopsis ssi2 mutant. Plant Cell 15: 2952–2965 [DOI] [PMC free article] [PubMed] [Google Scholar]
- Kachroo P, Shanklin J, Shah J, Whittle EJ, Klessig DF (2001) A fatty acid desaturase modulates the activation of defense signaling pathways in plants. Proc Natl Acad Sci USA 98: 9448–9453 [DOI] [PMC free article] [PubMed] [Google Scholar]
- Kachroo A, Venugopal SC, Lapchyk L, Falcone D, Hildebrand D, Kachroo P (2004) Oleic acid levels regulated by glycerolipid metabolism modulate defense gene expression in Arabidopsis. Proc Natl Acad Sci USA 101: 5152–5157 [DOI] [PMC free article] [PubMed] [Google Scholar]
- Kang L, Li J, Zhao T, Xiao F, Tang X, Thilmony R, He S, Zhou JM (2003) Interplay of the Arabidopsis nonhost resistance gene NHO1 with bacterial virulence. Proc Natl Acad Sci USA 100: 3519–3524 [DOI] [PMC free article] [PubMed] [Google Scholar]
- Klaus D, Hartel H, Fitzpatrick LM, Froehlich JE, Hubert J, Benning C, Dormann P (2002) Digalactosyldiacylglycerol synthesis in chloroplasts of the Arabidopsis dgd1 mutant. Plant Physiol 128: 885–895 [DOI] [PMC free article] [PubMed] [Google Scholar]
- Kunst L, Browse J, Somerville C (1988) Altered regulation of lipid biosynthesis in a mutant of Arabidopsis deficient in chloroplast glycerol-3-phosphate acyltransferase activity. Proc Natl Acad Sci USA 85: 4143–4147 [DOI] [PMC free article] [PubMed] [Google Scholar]
- Kunst L, Browse J, Somerville C (1989) A mutant of Arabidopsis deficient in desaturation of palmitic acid in leaf lipids. Plant Physiol 91: 401–408 [DOI] [PMC free article] [PubMed] [Google Scholar]
- Li C, Liu G, Xu C, Lee GI, Bauer P, Ling HQ, Ganal MW, Howe GA (2003) The tomato suppressor of prosystemin-mediated responses2 gene encodes a fatty acid desaturase required for the biosynthesis of jasmonic acid and the production of a systemic wound signal for defense gene expression. Plant Cell 15: 1646–1661 [DOI] [PMC free article] [PubMed] [Google Scholar]
- McDowell JM, Dhandaydham M, Long TA, Aarts MG, Goff S, Holub EB, Dangl JL (1998) Intragenic recombination and diversifying selection contribute to the evolution of downy mildew resistance at the RPP8 locus of Arabidopsis. Plant Cell 10: 1861–1874 [DOI] [PMC free article] [PubMed] [Google Scholar]
- Miquel M (2003) What's new about glycerol metabolism in plants? In N Murata, M Yamada, I Nishida, H Okuyama, J Sekiya, W Hajime, eds, Advanced Research on Plant Lipids. Kluwer Academic Publishers, Dordrecht, The Netherlands, pp 45–47
- Miquel M, Browse J (1992) Arabidopsis mutant deficient in polyunsaturated fatty acid synthesis: biochemical and genetic characterization of a plant oleoyl-phospatidylcholine desaturase. J Biol Chem 267: 1502–1509 [PubMed] [Google Scholar]
- Miquel M, Cassagne C, Browse J (1998) A new class of Arabidopsis mutants with reduced hexadecatrienoic acid fatty acid levels. Plant Physiol 117: 923–930 [DOI] [PMC free article] [PubMed] [Google Scholar]
- Nandi A, Welti R, Shah J (2004) The Arabidopsis thaliana dihydroxyacetone phosphate reductase gene SUPPRESSSOR OF FATTY ACID DESATURASE DEFICIENCY1 is required for glycerolipid metabolism and for the activation of systemic acquired resistance. Plant Cell 16: 465–477 [DOI] [PMC free article] [PubMed] [Google Scholar]
- Nawrath C, Heck S, Parinthawong N, Metraux JP (2002) EDS5, an essential component of salicylic acid-dependent signaling for disease resistance in Arabidopsis, is a member of the MATE transporter family. Plant Cell 14: 275–286 [DOI] [PMC free article] [PubMed] [Google Scholar]
- Ohlrogge J, Browse J (1995) Lipid biosynthesis. Plant Cell 7: 957–970 [DOI] [PMC free article] [PubMed] [Google Scholar]
- Ryals J, Weymann K, Lawton K, Friedrich L, Ellis D, Steiner HY, Johnson J, Delaney TP, Jesse T, Vos P, et al (1997) The Arabidopsis NIM1 protein shows homology to the mammalian transcription factor inhibitor I kappa B. Plant Cell 9: 425–439 [DOI] [PMC free article] [PubMed] [Google Scholar]
- Shah J, Kachroo P, Nandi A, Klessig DF (2001) A recessive mutation in the Arabidopsis SSI2 gene confers SA- and NPR1-independent expression of PR genes and resistance against bacterial and oomycete pathogens. Plant J 25: 563–574 [DOI] [PubMed] [Google Scholar]
- Shah J, Tsui F, Klessig DF (1997) Characterization of a salicylic acid-insensitive mutant (sai1) of Arabidopsis thaliana, identified in a selective screen utilizing the SA-inducible expression of the tms2 gene. Mol Plant Microbe Interact 1: 69–78 [DOI] [PubMed] [Google Scholar]
- Shen W, Wei Y, Dauk M, Zheng Z, Zou J (2003) Identification of a mitochondrial glycerol-3-phosphate dehydrogenase from Arabidopsis thaliana: evidence for a mitochondrial glycerol-3-phosphate shuttle in plants. FEBS Lett 536: 92–96 [DOI] [PubMed] [Google Scholar]
- Vijayan P, Shockey J, Levesque CA, Cook RJ, Browse J (1998) A role for jasmonate in pathogen defence of Arabidopsis. Proc Natl Acad Sci USA 95: 7209–7214 [DOI] [PMC free article] [PubMed] [Google Scholar]
- Weber H (2002) Fatty acid derived signals in plants. Trends Plant Sci 7: 217–224 [DOI] [PubMed] [Google Scholar]
- Wei Y, Periappuram C, Datla R, Selvaraj G, Zou J (2001) Molecular and biochemical characterization of a plastidic glycerol-3-phosphate dehydrogenase from Arabidopsis. Plant Physiol Biochem 39: 841–848 [Google Scholar]
- Welti R, Li W, Li M, Sang Y, Biesiada H, Zhou HE, Rajashekar CB, Williams TD, Wang X (2002) Profiling membrane lipids in plant stress responses: role of phospholipase D alpha in freezing-induced lipid changes in Arabidopsis. J Biol Chem 277: 31994–32002 [DOI] [PubMed] [Google Scholar]
- Wildermuth MC, Dewdney J, Wu G, Ausubel MS (2001) Isochorismate synthase is required to synthesize salicylic acid for plant defence. Nature 414: 562–571 [DOI] [PubMed] [Google Scholar]
- Yaeno T, Matsuda O, Iba K (2004) Role of chloroplast trienoic fatty acids in plant disease defense responses. Plant J 40: 931–941 [DOI] [PubMed] [Google Scholar]
- Yamamotoj S, Katagiri M, Maeno H, Hayaishi O (1965) Salicylate hydroxylase, a monooxygenase requiring flavin adenine dinucleotide: purification and general properties. J Biol Chem 240: 3408–3413 [PubMed] [Google Scholar]
- Zhang W, Wang C, Qin C, Wood T, Olafsdottir G, Welti R, Wang X (2003) The oleate-stimulated phospholipase D, PLD, and phosphatidic acid decrease H2O2-induced cell death in Arabidopsis. Plant Cell 15: 2285–2295 [DOI] [PMC free article] [PubMed] [Google Scholar]
Associated Data
This section collects any data citations, data availability statements, or supplementary materials included in this article.
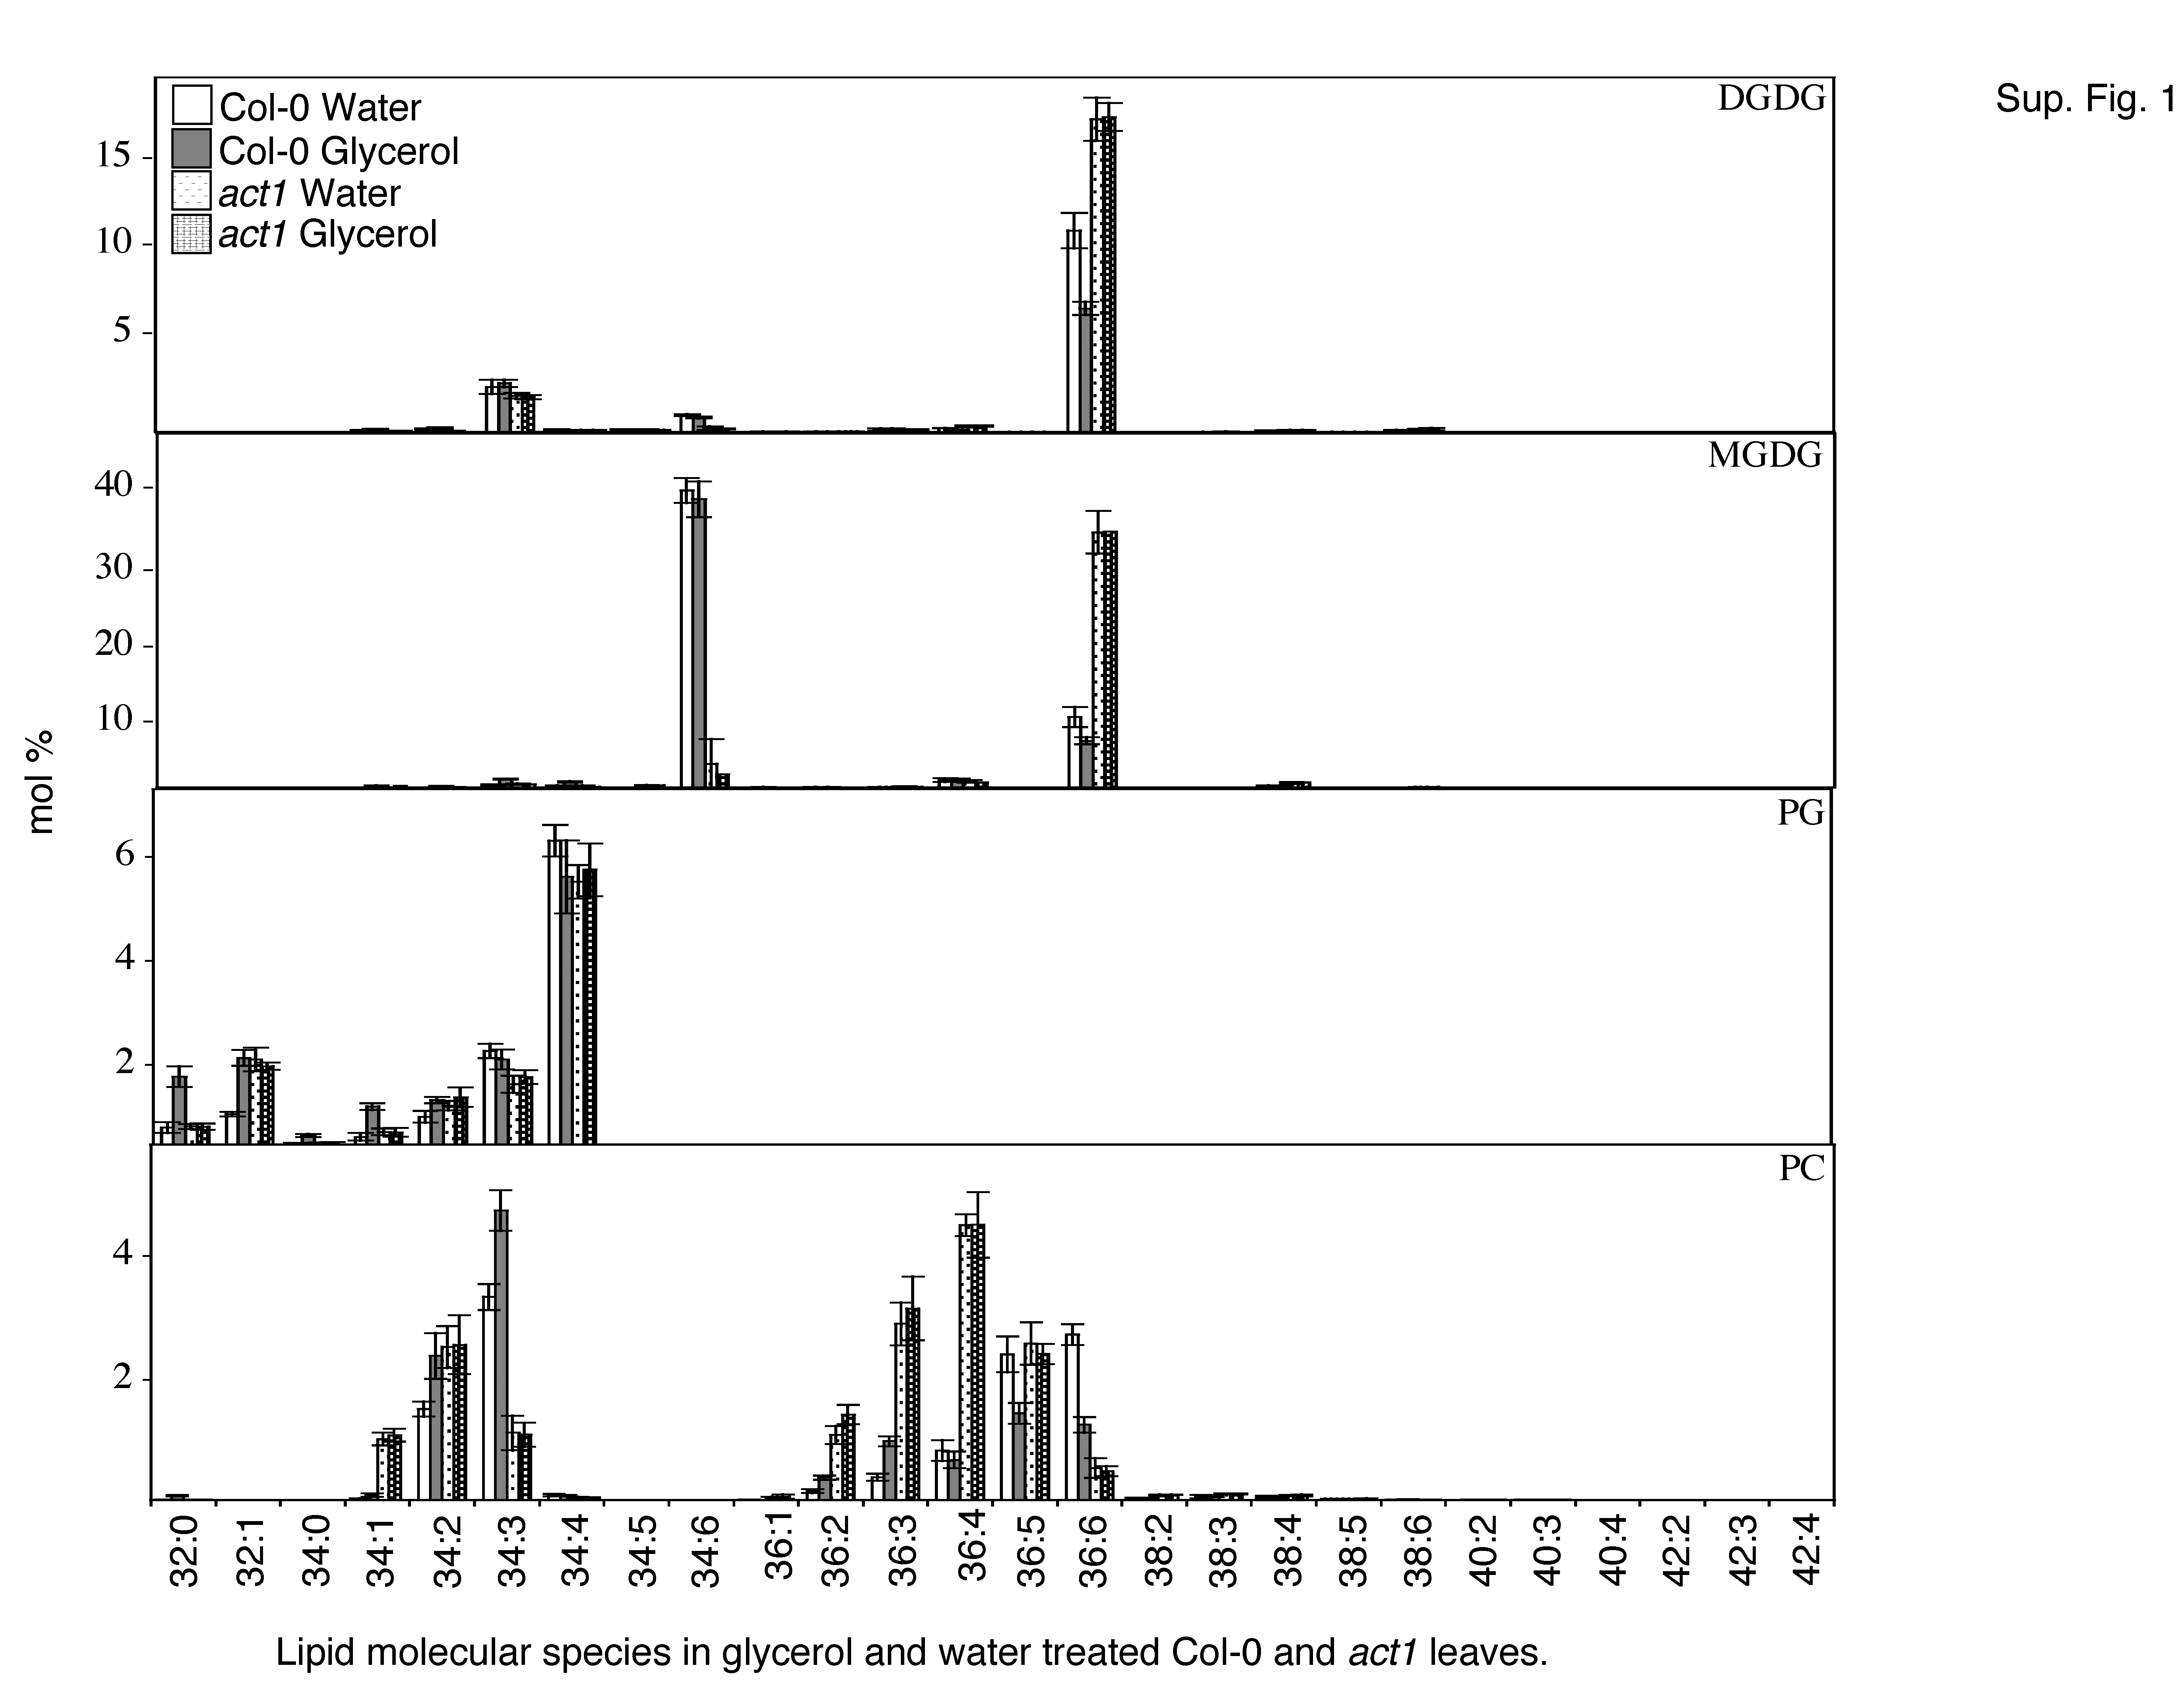
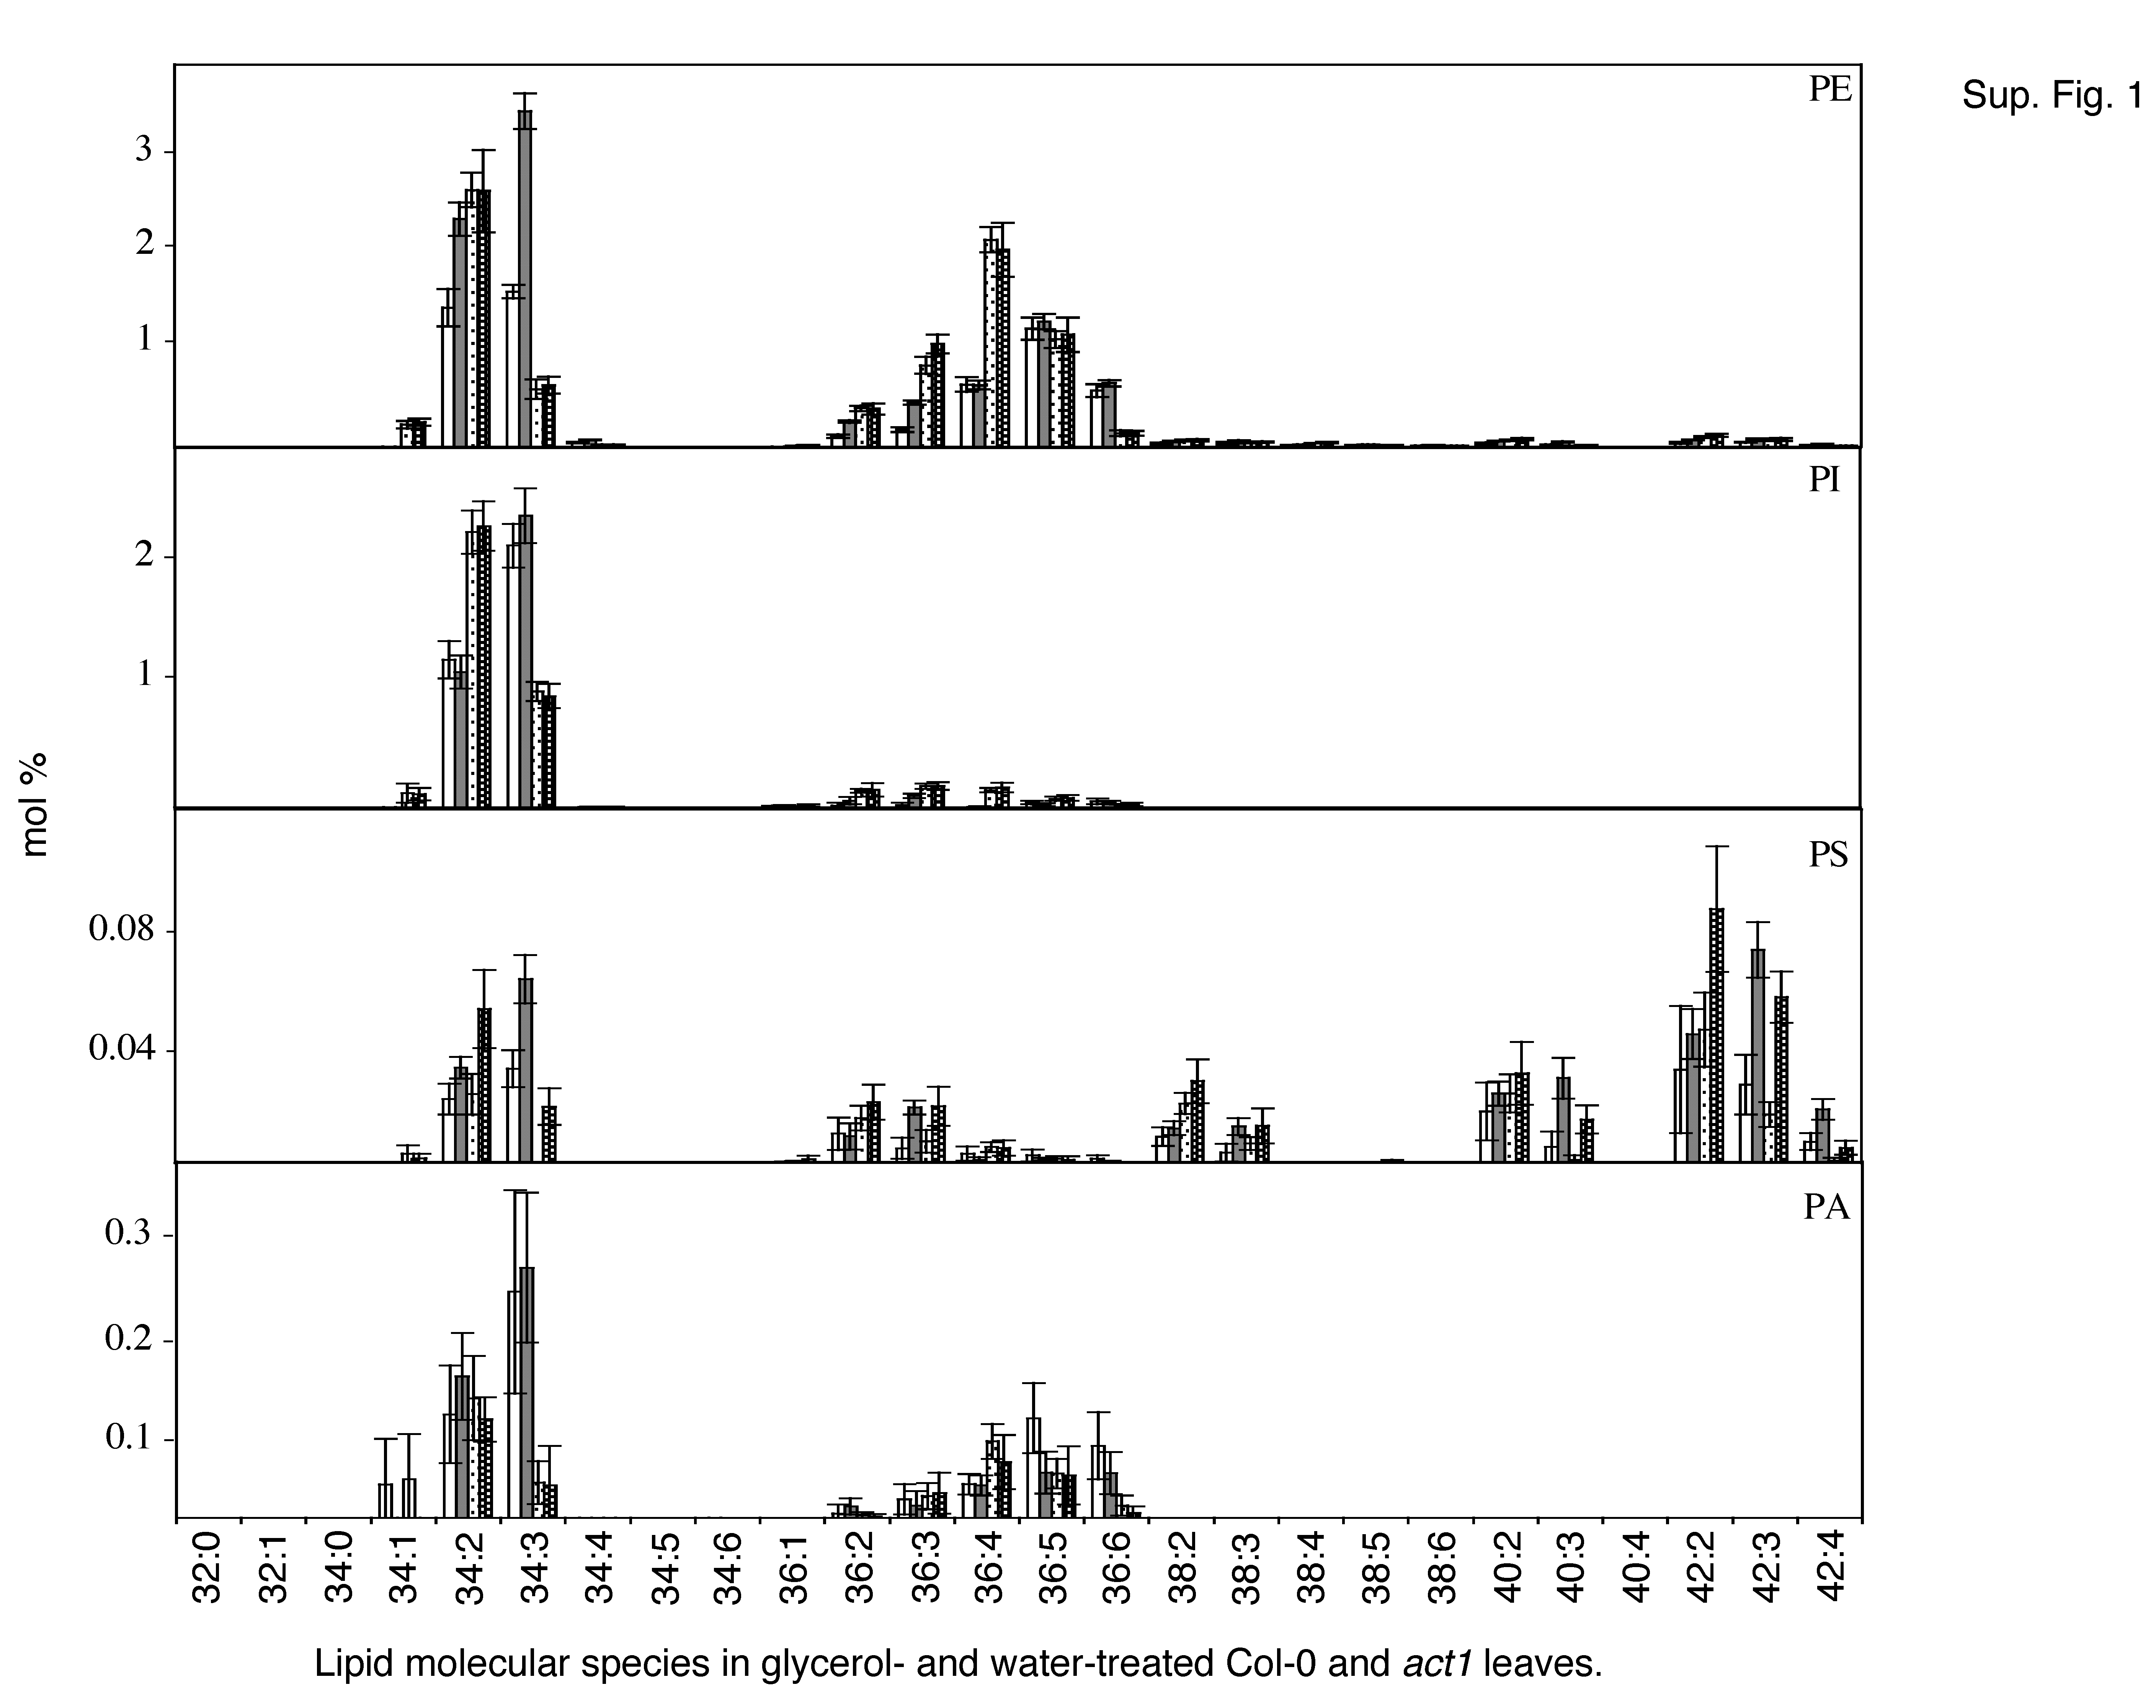