Abstract
Electron cryo-microscopy of ‘single particles’ is a powerful method to determine the three-dimensional (3D) architectures of complex cellular assemblies. The pyruvate dehydrogenase multi-enzyme complex couples the activity of three component enzymes (E1, E2 and E3) in the oxidative decarboxylation of pyruvate to generate acetyl-CoA, linking glycolysis and the tricarboxylic acid cycle. We report here a 3D model for an 11 MDa, icosahedral pyruvate dehydrogenase sub-complex, obtained by combining a 28 Å structure derived from electron cryo-microscopy with previously determined atomic coordinates of the individual E1 and E2 components. A key feature is that the E1 molecules are located on the periphery of the assembly in an orientation that allows each of the 60 mobile lipoyl domains tethered to the inner E2 core to access multiple E1 and E2 active sites from inside the icosahedral complex. This unexpected architecture provides a highly efficient mechanism for active site coupling and catalytic rate enhancement by the motion of the lipoyl domains in the restricted annular region between the inner core and outer shell of the complex.
Keywords: electron microscopy/molecular machine/pyruvate dehydrogenase/single particle analysis/three-dimensional reconstruction
Introduction
Multi-enzyme complexes in the 2-oxo acid dehydrogenase family of multi-functional enzymes catalyse multi-step oxidative decarboxylations that furnish several of the cornerstones of energy metabolism in many cell types (Reed and Hackert, 1990; Perham 1991, 2000). They are crucial to the glycolytic pathway, the tricarboxylic acid cycle and the metabolism of branched-chain amino acids. Their dysfunction leads to several well recognized metabolic disorders, among them lactic acidosis, maple syrup urine disease and primary biliary cirrhosis (Patel and Harris, 1995; Yeaman et al., 2000; Nellis and Danner, 2001). They have been the subject of intense investigation and have achieved the status of a paradigm in the study of multi-step catalysis. Nevertheless, while an impressive understanding of the structures and activities of their individual component enzymes has been obtained, no overall detailed architecture has been established that permits a properly integrated picture of their mode of action.
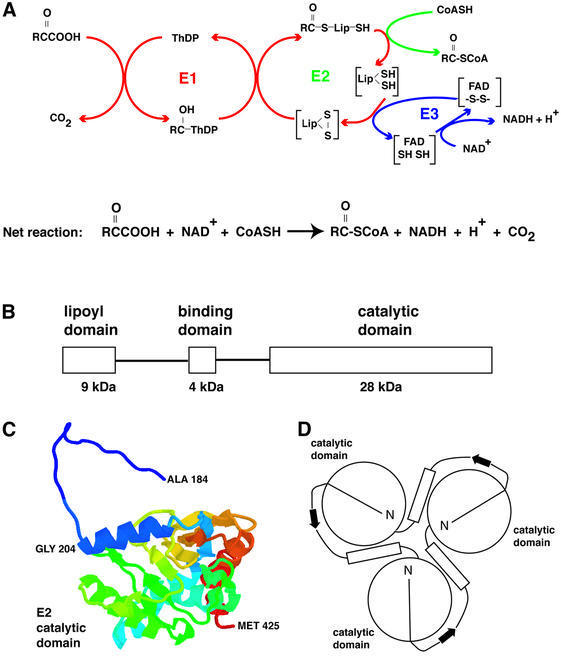
Like the pyruvate dehydrogenase (PDH) complexes of eukaryotes and of other Gram-positive bacteria, the Bacillus stearothermophilus PDH complex (Figure 1) is assembled around a core of 60 dihydrolipoyl acetyltransferase (E2) chains arranged with icosahedral symmetry (Reed and Hackert, 1990; Perham, 1991). Each E2 chain consists of three domains: (i) an N-terminal 9 kDa lipoyl domain (Dardel et al., 1993), which visits the active sites of the pyruvate decarboxylase (E1) component and then those of E2 and dihydrolipoyl dehydrogenase (E3); (ii) a 4 kDa peripheral subunit-binding domain to which E1 and E3 bind tightly and mutually exclusively (Dardel et al., 1993; Kalia et al., 1993; Lessard and Perham, 1995; Lessard et al., 1996); and (iii) a C-terminal 28 kDa catalytic (acetyltransferase) domain, 60 copies of which assemble to form the icosahedral inner core (Izard et al., 1999). These domains are linked by stretches of extended, conformationally flexible polypeptide chain (Reed and Hackert, 1990; Perham, 1991; Green et al., 1992).
Fig. 1. (A) Schematic diagram of the reaction mechanism of a 2-oxo acid dehydrogenase multienzyme complex. R is CH3 in the case of the PDH complex; ThDP, thiamin diphosphate; Lip, lipoic acid. (B) Schematic illustration of the three domains of the E2 chain that are connected by flexible linkers. (C) Atomic model for the B.stearothermophilus E2 catalytic domain monomer (Izard et al., 1999), and (D) schematic view of the trimer as proposed by Mattevi et al. (1992). Residues 184–200 form an extended, hook-like segment that was thought to stabilize the packing of the trimers. This interpretation is inconsistent with our findings for the size of the E1E2 complex (for details, see the text).
In the native PDH complex, E1 and E2 coordinate to transfer an acetyl group derived from the oxidative decarboxylation of pyruvate (catalysed by E1) to CoA via a dihydrolipoyl group covalently attached to a lysine residue in the lipoyl domain of E2, whereas E3 regenerates an oxidized lipoyl domain to complete the cycle (Figure 1). E1 is the rate-determining enzyme of the complex (Danson et al., 1978; Cate et al., 1980; Berg et al., 1998) and is present in substantial molar excess over E3 in the native complex (Reed and Hackert, 1990; Perham, 1991, 2000). The lipoyl group must be attached to the lipoyl domain of the parent PDH complex if it is to serve as a substrate for E1 (kcat/Km raised by a factor of 104), and the domain thus serves both to present the lipoyl group to E1 for reductive acetylation and to confer specificity on it (Graham et al., 1989; Berg et al., 1998), thereby providing an elegant basis for substrate channelling in the complex (Perham, 1991).
The native E1E2E3 complex, as well as sub-complexes assembled in vitro from E1 and E2, or E3 and E2, have proven to be too heterogeneous, and/or too innately flexible, for analysis by X-ray crystallographic methods. Electron microscopic analyses of the E1E2 and the E2E3 complexes from both mammalian and bacterial species (Wagenknecht et al., 1990, 1991) have suggested that E1 and E3 may be located as much as 60 Å from the ordered inner part of the E2 core, although E3 appears more closely associated with the inner core in the case of the PDH complex of Saccharomyces cerevisiae, where an additional protein (E3BP) in the E2 core is responsible for its binding (Stoops et al., 1997). Such investigations have provided valuable information about the overall size of various complexes, but have not been at a sufficiently high resolution to deduce the locations and relative orientations of the E1, E2 and E3 molecules in the complex. Here, we report the determination of a structural model for the icosahedral E1E2 complex (11 000 kDa) from B.stearothermophilus using electron cryo-microscopy. By positioning the previously determined structures of E1 and the three domains of E2 into the model, we have arrived at an atomic interpretation for the entire E1E2 complex.
Results
Three-dimensional (3D) structure of the E2 inner core
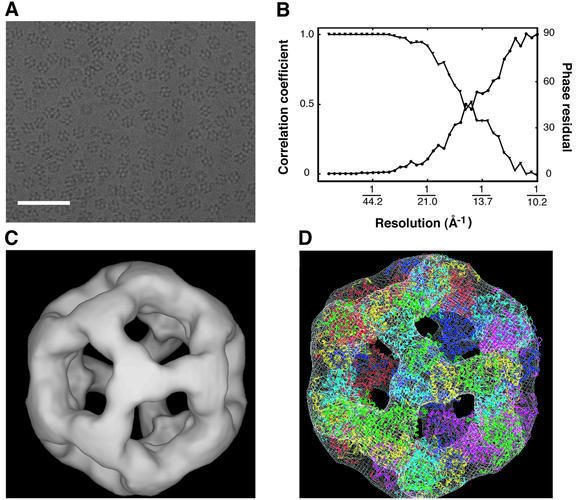
The icosahedral complex comprised of 60 copies of a truncated B.stearothermophilus E2 chain containing only the 28 kDa acetyltransferase catalytic domain (the E2 inner core) is well ordered, and its structure has been established from X-ray crystallographic data (Figure 1C; Izard et al., 1999). We first analysed the structure of this same assembly by electron microscopy to develop, refine and test methods used for the analysis of the much larger E1E2 complex. An image recorded from a frozen– hydrated specimen of the E2 inner core is shown in Figure 2A. A range of molecular orientations is evident, including those which show 2-, 3- and 5-fold symmetries characteristic of icosahedral particles. The final 3D model was constructed using 4458 images as described in the Materials and methods section, and the resolution of this map was determined by comparing the Fourier shell correlation coefficient (FSC) and Fourier shell phase residual (FSPR) between two random halves of the data set (Figure 2B). The two estimates agree well and show that the FSC is ∼0.5, and the FSPR is ∼45° at 14.5 Å. The structure of the E2 inner core at this resolution (Figure 2C) is in excellent agreement with the X-ray crystallographic model obtained for the same complex at 4.5 Å resolution, as shown by the superposition in Figure 2D.
Fig. 2. (A) An image recorded from a frozen–hydrated specimen of the icosahedral E2 inner core consisting of 60 acetyltransferase domains. The scale bar represents 1000 Å. (B) Plot of the FSC (triangles) and the corresponding FSPR (circles) at different resolutions. The values in the plot reflect the resolution-dependence of the agreement between two halves of the set of 4458 molecular images used to construct the refined model. The resolution (∼14.5 Å) at which the FSC drops to 0.5 and the FSPR increases to 45° is conventionally taken to represent the resolution limit of the reconstruction. (C) Surface representation of the refined model for the E2 catalytic domain complex as viewed from the 3-fold axis. (D) Superposition of the model derived from our electron microscopic analysis with the atomic model obtained by Izard et al. (1999), based on X-ray crystallographic analyses from 3D crystals of the E2 catalytic domain complex. The docking was carried out manually in the crystallographic program O (Jones et al., 1991). The complex is ∼225 Å in diameter.
Architecture of the E1E2 complex
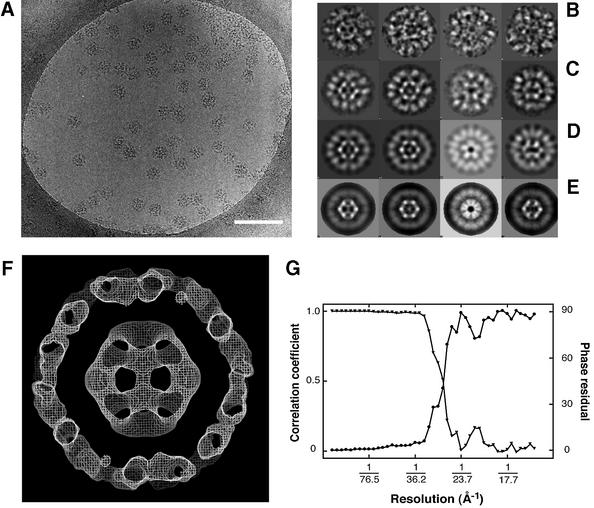
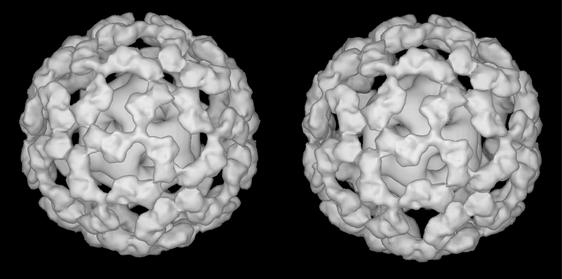
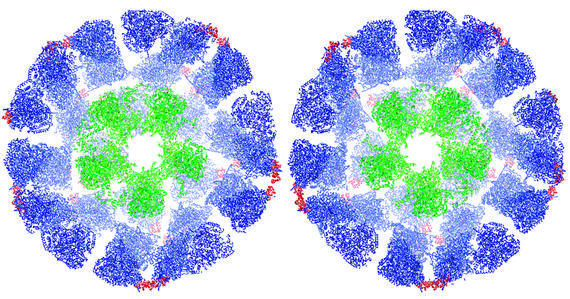
As a first step towards defining the detailed architecture of the native complex, we have analysed the structure of the E1E2 complex assembled in vitro with a defined 1:1 stoichiometry, i.e. 60 E1 (α2β2) heterotetramers per E2 core (Lessard et al., 1998). A representative electron micrograph of this complex is shown in Figure 3A. The two-dimensional projections of the complex are much larger and more intricate than those of the truncated E2 inner core. Inspection of the individual molecular images (Figure 3B) shows features that would be expected from the presence of an inner core of E2 catalytic domains surrounded by an outer shell of bound E1 heterotetramers. A total of 2279 particles taken from 30 micrographs were processed to obtain distinct class-averaged images. A representative panel of these class averages (Figure 3C) shows that they correspond well to the views of the original filtered particles (Figure 3B). An initial 3D model was generated with imposed icosahedral symmetry using the IMAGIC-V package (van Heel et al., 1996). Some of the projections of this model are shown in Figure 3D, which also match well to the class-averaged views. Following refinement with FREALIGN (Grigorieff, 1998), the projections (Figure 3E) calculated from the refined model show an improved resolution of the E2 inner core, verifying that the refinement procedure further improved the alignment of the individual images. As expected, the structure of the core is also clearly visualized in a central section from the 3D map (Figure 3F), which is at a resolution of ∼28 Å (Figure 3G). A stereo surface view of the refined 3D structure of the E1E2 complex is shown in Figure 4.
Fig. 3. (A) Electron micrograph recorded from a frozen–hydrated specimen of the E1E2 complex. The scale bar represents 2000 Å. (B) Gallery of molecular images of the E1E2 complex after filtering to suppress noise in the image, and inverting the density as an initial correction for the effects of the microscope CTF. Class averaged views (C) of the set of molecular images, two-dimensional projections (D) of the initial 3D model, and two- dimensional projections (E) of the refined 3D model, each shown in about the same orientation as the corresponding molecular images in (B). (F) A central slab of density from the refined 3D model of the E1E2 complex, which is ∼475 Å in diameter. The section shows that the structure of the E2 core is correctly recovered in the model of the E1E2 complex. (G) Plot of the FSC (triangles) and the corresponding FSPR (circles) at different resolutions.
Fig. 4. Stereo view of a surface-rendered representation of the refined 3D model of the E1E2 complex.
Docking of E1 and E2 into the map for the E1E2 complex
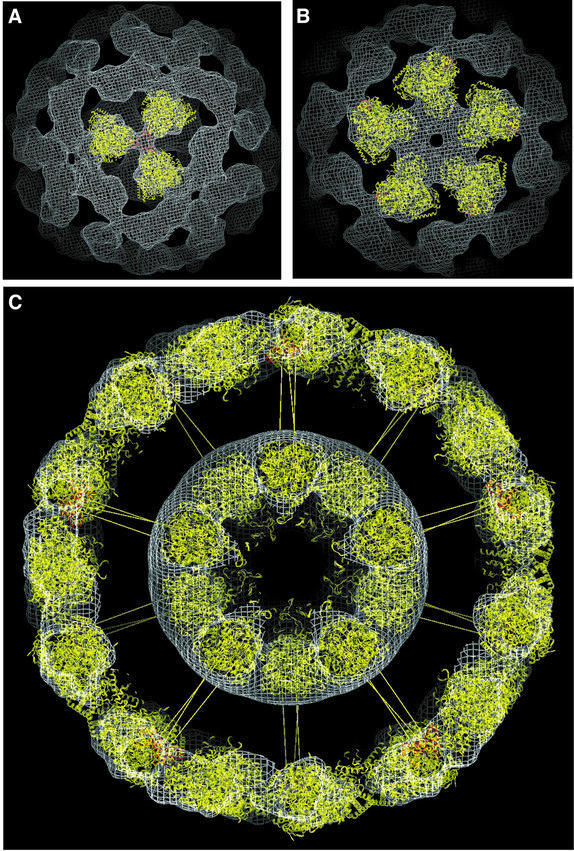
The 3D structure of the inner core visible in the E1E2 complex (Figure 4) is essentially identical to that obtained for the naked core composed of E2 catalytic domains (Figure 2). The coordinates for the E2 catalytic domain complex could therefore be positioned into the inner core of the E1E2 complex without ambiguity. For manual fitting of coordinates into the outer density, we tested the fit of E1 by visual inspection over the full angular range by rotation along two mutually perpendicular axes. The E1 α2β2 heterotetramer has the overall shape of a flattened pear, with its narrower dimensions at the end where the two β-subunits are located (Ævarsson et al., 1999). Because of the asymmetric features of the outer shell of density (Figures 3F and 4), orientations of E1 where the long axis of the molecule pointed in the radial direction could be eliminated. Similarly, because the narrow end of the density features point towards the 3-fold vertex (Figure 4), orientations of E1 in which the β-subunits point towards the 5-fold vertex were also considered to be unlikely. The final orientation was obtained by optimizing the fit of the coordinates into the density over a wide range of contour values. In this orientation, the E1 α2β2 heterotetramer is arranged with its long axis lying along the outer surface, with its β-subunits pointing towards the 3-fold vertex and with one of its two active sites directly facing into the annular region between the inner core and the outer shell (Figure 5A and B).
Fig. 5. (A and B) Views from the 3- and 5-fold axes of the manual fit of atomic coordinates of the backbone Cα atoms of a single E1 α2β2 tetramer into the density of the 3D map of the E1E2 complex generated by electron microscopy. The E2 peripheral subunit-binding domains are shown in red. (C) Sectioned view of the density for the E1E2 complex with 60 manually-docked copies each of the atomic coordinates of the E1 α2β2 tetramer, the E2 catalytic domain and the E2 peripheral subunit-binding domain. Sixty radial spokes have been included to illustrate the probable location of the linker domain connecting the peripheral subunit-binding and catalytic domains of the E2 chain.
We positioned the peripheral subunit-binding domain (shown in red) into the region of extra density between the β-subunits of each E1 tetramer and the 3-fold vertex (Figure 5A) so that the binding domain was next to the C-terminus of one of the E1 β-subunits close to the 2-fold axis of the E1 tetramer. This placement is in accordance with biochemical findings that: (i) a single E2 peripheral subunit-binding domain interacts with the E1 β-subunits, not with the E1 α-subunits (Lessard and Perham, 1995; Lessard et al., 1996); (ii) insertion of a hexahistidine tag at the C-terminus of the β-subunit (at the apex of the narrow end of E1) disrupts the binding interaction (Ævarsson et al., 2000); and (iii) the binding interaction is very tight (Kd= 0.32 nM) (Lessard et al., 1996) so the E1 and the peripheral subunit-binding domain are likely to move as a single unit. Moreover, the peripheral subunit-binding domain is connected to the catalytic domain by a linker segment of the E2 chain, with the attachment point very close to the 3-fold vertex of the inner core. These linker segments must form the spokes that connect the vertices of the 3-fold axes of the inner and outer icosahedral layers across a gap of ∼90 Å. Although we have drawn in these linkers to illustrate this idea (Figure 5C), their presence is not evident in the density map, likely because they contribute a very small fraction to the overall mass of the complex and they are in an extended, flexible conformation (Radford et al., 1989). The geometrical relationship between the docked E1 and the E2 catalytic domain turns out to have important implications for the range of movement of the swinging lipoyl domain of the E2 chain, as discussed in the next section.
In addition to the manual fitting procedures documented above, we also carried out automated fitting procedures to obtain an objective measure of confidence about the validity of the manual fit. Using a grid-threading Monte Carlo approach (see Materials and methods), the complete map for the E1E2 complex was searched with the density corresponding to a single E1 α2β2 tetramer to locate the best fits. Identical results were obtained whether the searches were carried out in the presence or absence of the peripheral subunit-binding domain positioned next to the C-terminus of one of the E1 β-subunits close to the 2-fold axis, as described above. The lack of influence on the docking results of the peripheral subunit-binding domain is not unexpected, since it has only 2.5% of the mass of the E1 α2β2 tetramer. Since the lipoyl domain is likely to interact only transiently with E1 (Perham, 1991), a ternary complex of the lipoyl domain, the peripheral subunit-binding domain and E1 were not considered.
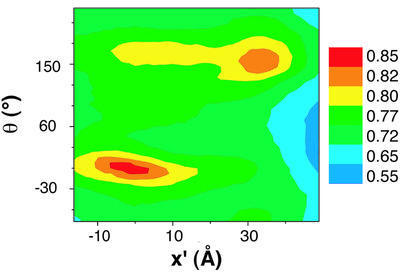
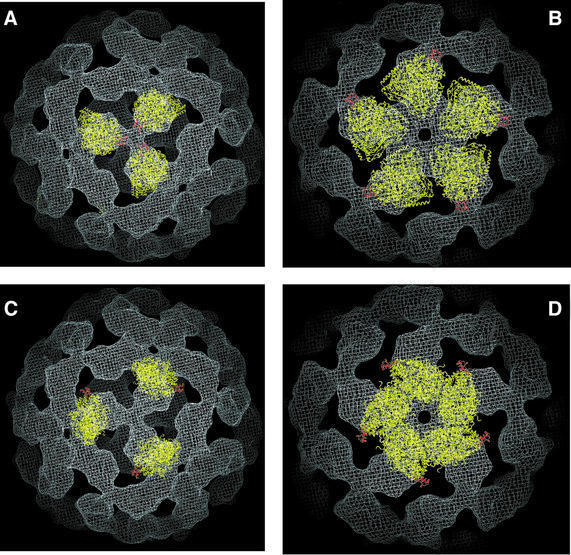
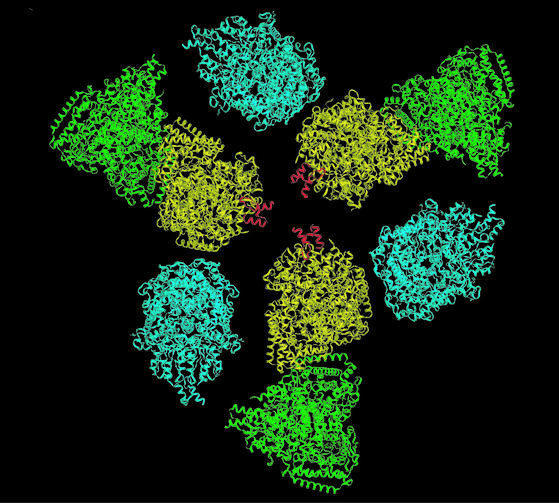
The automated procedure identified only two minima into which all starting positions converged. The spatial relationship between these positions is indicated in the plot shown in Figure 6, which also indicates the correlation coefficients describing the quality of the fits. In Figure 7, we present views from the 3- and 5-fold axes obtained for the best fit (Figure 7A and B) and second-best fit (Figure 7C and D) identified by the automated search. The remarkable similarity between the best automated fit and the manual fit provides greater confidence in the general validity of the fit than one might have had from one fitting procedure alone, especially as the manual fitting was performed before the automated fitting procedure was undertaken.
Fig. 6. Contour plot of the core-weighted correlation function describing the locations of the two best fits of E1 to the outer density, based on the automated Monte Carlo search performed as described in the text. X′ corresponds to the net spatial translation (x, y, z) from the best to the second-best fit, while θ′ corresponds to the net 3D rotation (θ, φ, χ) angle from the best fit (global minimum) to the second-best fit.
Fig. 7. View of the docked E1 molecules (in yellow) and E2 peripheral subunit-binding domains (in red) from 3-fold (A and C) and 5-fold (B and D) vertices. The views in (A) and (B) are for the best fit obtained by automated docking, while the views in (C) and (D) are for the second-best fit.
In the second-best fit identified by the automated procedure, the E1 tetramer is pushed towards the 5-fold vertex, covering some regions of the density not sampled by either the global minimum or the best manual fit. In this orientation, the long axis of E1 is still along the surface of the icosahedron, but it is translated towards the 5-fold vertex relative to the global minimum fit. The path from the best to the second-best fit involves a swiveling motion of E1 around an axis perpendicular to the icosahedral surface, with very little movement of the location and orientation of the E1 active site relative to the inner core. Interestingly, while neither the best nor the second-best fit appears to span the outer density fully, the fits in Figure 7 show that almost all regions of the outer density are included in one or other of the two orientations of E1. Our working hypothesis based on these findings is that the two orientations reflect stable positions for the E1 tetramer in the E1E2 complex. Since each E1 molecule in the complex may sample both orientations over time, the smear of the outer density in our 3D reconstruction probably reflects the averaged contribution to the structure from these two populations.
Discussion
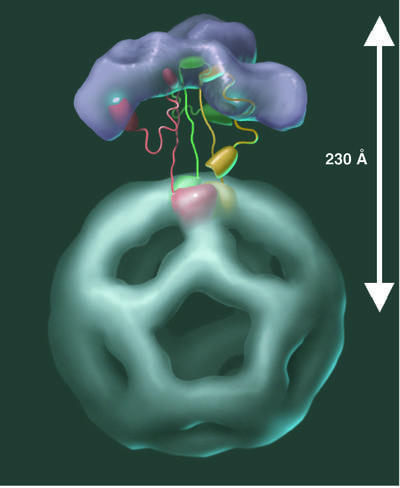
Previous speculations on the structure of the PDH complex (Mande et al., 1996; Ævarsson et al., 1999; Perham, 2000) have placed the lipoyl domain at or near the periphery of the complex, interdigitating between E1 and E3 molecules and sampling a large region of space in order to access the active sites of E1, E2 and E3. Furthermore, it has been generally assumed that the E1 and E3 molecules would be disordered relative to the icosahedral core. How 60 lipoyl domains tethered at the ends of long, flexible linkers avoid becoming entangled while migrating between three different active sites has remained a fascinating question. An important insight from our model is that the E1 molecules are not randomly oriented on the periphery, but are reasonably well localized relative to the E2 catalytic core. Of the two active sites in each E1 tetramer, the channel leading to the one on the inside surface is directly accessible from the annular space between the shell of E1 molecules and the surface of the inner core (Figure 8). This is true for both orientations identified by the automated docking. A lipoyl domain tethered in the annular space is thus free to follow a remarkably simple and partially constrained swinging motion, on its visits to the active sites of E1 and E2; the angle over which each of the linker regions is required to swing need be no greater than 90° in the vertical plane. Since the distance between the E2 catalytic domain and the peripheral subunit-binding domain is ∼95 Å in our model, the length of the linker region between the peripheral subunit-binding domain and the lipoyl domain (∼50 amino acids) is more than sufficient to allow the lipoyl domain to access both E1 and E2 active sites.
Fig. 8. Model for active-site coupling in the E1E2 complex. Three E1 tetramers (in purple) are shown located above the corresponding trimer of E2 catalytic domains in the icosahedral core. Three full-length E2 molecules are shown, colored red, green and yellow, respectively. The lipoyl domain of each E2 molecule shuttles between the active sites of E1 and those of E2. The lipoyl domain of the red E2 is shown attached to an E1 active site. The yellow and green lipoyl domains of the other E2 molecules are shown in intermediate positions in the annular region between the core and the outer E1 layer. Selected E1 and E2 active sites are shown as white ovals, although the lipoyl domain can reach additional sites in the complex (for details, see text).
The size of the complex
What determines the size of the E1E2 complex? The observed spacing of 90 Å between the inner and outer shells has important and interesting consequences for the size of the complex and the linkage between the peripheral subunit-binding domain and acetyltransferase domains of E2. NMR and crystallographic studies have indicated that the lipoyl domain extends from residue 1–79 (Dardel et al., 1993), the peripheral subunit-binding domain from residue 128–166 (Kalia et al., 1993; Mande et al., 1996), and the catalytic (acetyltransferase) domain from residue 184–427 (Izard et al., 1999). Thus, the linker region connecting the peripheral subunit-binding domain and catalytic domains would be predicted to be no longer than ∼50 Å, corresponding to the length of a maximally extended polypeptide chain containing ∼15 amino acids. This conclusion is clearly at variance with our estimate of ∼95 Å as the shortest distance between the E1 β-subunit and the catalytic domain. To achieve this length, the linker region must be at least ∼30 residues long, with the polypeptide backbone close to its fully extended conformation. From inspection of the structure and fold of the peripheral subunit-binding domain, and in keeping with sequence alignments of peripheral subunit-binding domains from other organisms, it is clear that the linker region cannot begin much before residue 170. In the structure reported for the B.stearothermophilus E2 catalytic core domain (Figure 1C; Izard et al., 1999), which rests in part on the structure of the homologous core domain of the octahedral Azotobacter vinelandii PDH complex (Mattevi et al., 1992), residues 184–203 are in a relatively extended, hook-like conformation, projecting from one E2 acetyltransferase domain across the surface of a neighbour in the trimer, whereas residues 204–425, beginning with an α-helix, form a much more compact folded structure. The hook-like region was thought to contribute to the stabilization of the E2 trimers (Figure 1D; Mattevi et al., 1992). However, it is now clear from our analysis that in the E1E2 complex, the region between residues 184 and 203 cannot belong to the catalytic domain, but must instead constitute part of the linker region between the catalytic and peripheral subunit-binding domains. The observed size of the E1E2 complex is therefore close to the maximal extension of this linker region (Figure 5). This conclusion is also consistent with the finding from NMR studies that most of the X-Pro peptide bonds present in such linker regions are in the all-trans rather than cis configuration, indicative of an extended conformation of the chain (Radford et al., 1989).
What prevents collapse of the outer E1 shell towards the core? The smearing of the outer density, as well as the results from the automated docking are consistent with significant mobility of the E1 domain along the outer surface, allowing it to sample at least two distinct, preferred positions. However, the density of packing along the surface is sufficiently high that any significant decrease in radius would force steric interactions between neighbouring E1 tetramers. Inspection of the structure suggests that inward movements of as little as 10–15 Å would result in ‘locking’ the structure because of intermolecular contacts. Thus, the structural elements inherent in our model provide an understanding of how the gap between the inner core and the outer shell is preserved, despite the considerable flexibility of the complex. Preservation of this gap to a width that is ∼2× the length of the lipoyl domain is likely to be crucial to the mechanism of substrate channelling; it provides enough room for the lipoyl domain to swing around by 180°, while restricting the angular search space required by the lipoyl domain to move effectively between the E1 and E2 active sites (Figures 5 and 8). This goes a long way towards explaining the catalytic rate enhancement of a factor of ≥100 achieved by tethering the lipoyl domains in E2 (Berg et al., 1998; Perham, 2000).
Active site coupling
An intriguing feature of our model of the E1E2 complex is that the ‘pivot’ of the swinging lipoyl domain of a particular E2 chain is at roughly the same distance (∼105 Å) from all three of the E2 active sites in the acetyltransferase trimer located at the inner 3-fold vertex. A lipoyl domain emerging from the E1 active site can reach the three E2 active sites in the trimer directly below (located at a distance of ∼105 Å from the pivot), and three additional E2 sites (located within ∼140 Å of the pivot). Furthermore, one of the active sites of each of six E1 tetramers is within ∼120 Å of this pivot point, with an additional three E1 active sites located within a distance of ∼140 Å (Figure 9). Thus, it is easily envisaged how a single lipoyl domain could visit the active sites of as many as nine E1 molecules on the outer shell of the complex, even though differences in the efficiency of coupling between them might be expected. This is a conservative estimate based on the location of E1 at the best fit identified by the automated docking procedure; the number is likely to be even higher if one takes into account the length of the lipoyl domain itself in addition to that of the linker region, and the increased range afforded when the E1 molecules are situated at the position corresponding to the second-best fit. We note that the lipoyl domain could also potentially reach the E1 active sites on the outer edge of the E1E2 complex, although we would predict from our structural model that the site facing the annular region would be preferentially accessible.
Fig. 9. View of the complex from one of the outer 3-fold vertices, showing multiple copies of the E1 α2β2 tetramer. A lipoyl domain originating from one of the three E2 molecules at the inner 3-fold vertex can potentially reach the active sites of 9 E1 tetramers, which are located in the immediate vicinity (colored yellow), <120 Å (colored blue) or <140 Å (colored green) away from the pivot point of the swinging arm.
It is clear that the structure we propose here obviates any need for a strict stoichiometric relation between the numbers of E1, E2 and E3 catalytic sites in the native PDH complex, as observed previously (Reed and Hackert, 1990; Perham, 1991, 2000). Moreover, since the decarboxylation of pyruvate by E1 is the rate-limiting step in the overall reaction, this special arrangement can explain why a gradual excision of lipoyl domains is not accompanied by corresponding decreases in PDH activity (Reed and Hackert, 1990; Perham, 1991) and why a PDH complex with optimal activity contains relatively few E3 molecules, for example ∼42–48 E1 and ∼6–12 E3 for each E2 icosahedral core (Domingo et al., 1999). Furthermore, it can explain why a single E1 molecule on an E2 core can catalyse the reductive acetylation of many, if not all, of the lipoyl domains in the E2 core (Bates et al., 1977; Collins and Reed, 1977; Packman et al., 1983), though this may also require a system of rapid intramolecular transacetylation between neighbouring lipoyl domains (Perham, 2000). The surprising degree of order in the E1 tetramers in our structure also suggests that there may be stabilizing interactions that help order them around the core. A native PDH complex that contains typically 70–80% E1 is likely to show very similar patterns of order, albeit with some disorder in the areas where the E3 enzymes insert.
Since the completion of our work, Zhou et al. (2001) have reported a 3D reconstruction of an icosahedral PDH complex from bovine kidney at a resolution of ∼35 Å. For their model construction they used 162 individual molecular images, each with an average E1 occupancy of ∼30% (i.e. only ∼20 of the 60 potential peripheral subunit-binding domains of E2 were occupied by E1 tetramers). In contrast, our analysis has been carried out using 2279 molecular images at an E1 occupancy of ∼100%. The model proposed by Zhou et al. (2001) differs from our model in several important respects. For example, the E1 tetramers are arranged much nearer to the inner E2 core (at a distance of ∼50 Å), with their long axes close to the radial direction of the icosahedron with the E1 α-subunits pointing towards the 3-fold icosahedral axis. These features, together with the concomitant linker arrangement needed to connect the E2 core to the peripheral subunit-binding domain/E1 complex, constricts the interior regions of low density between the E2 core and the E1 outer layer. The model of Zhou et al. cannot easily account for the well documented insensitivity of the overall catalytic activity to the inactivation of a significant fraction of E1, or to the excision of lipoyl domains from E2. A key feature of our model is the unrestricted annular region of low density between the inner core and the outer E1 shell, which we propose to be the critical feature underlying the mechanism of active site coupling. In principle, we cannot exclude that species differences may be responsible for some variation in architecture of the two enzyme complexes. However, this alone is unlikely to account for the observed differences, given some of the unexplained aspects of their model. For example, their complexes also contain about six or so E3 dimers, which bind to an additional protein, E3BP, in the E2 core. There is no visible density in their model for either the E3 binding protein or E3 at their proposed locations in the complex. Moreover, density at the 3-fold axis is proposed to arise from unoccupied linker regions, which is contradictory to biophysical evidence that these are extended and flexible (Radford et al., 1989; Green et al., 1992).
In summary, our determination of the overall architecture of the B.stearothermophilus E1E2 complex (Figure 10) has provided new insights into the nature of the molecular interactions that affect the size and functioning of the intact enzyme. The location of the E1 molecules, bound to the peripheral subunit-binding domains of the E2 as an external shell, suggests a simple model for the motion of the swinging lipoyl domains in the enzyme. In addition, the proposed structure offers a physical explanation of some paradoxical features of the catalytic mechanism, and may have implications for the structure and function of other multifunctional catalytic machines that employ swinging arms incorporated in swinging domains, among them fatty acid and polyketide synthases and biotin-dependent carboxylases (Perham, 2000).
Fig. 10. Stereo view of an atomic representation of the complete E1E2 complex. The E2 catalytic and peripheral subunit-binding domains as well as the E1 α2β2 tetramers are shown. The positions of the E1 α2β2 tetramers and the peripheral subunit-binding domains are from the best fit identified by the automated procedure. For visual clarity, only the back half of the model is presented. The E2 catalytic domains, the peripheral subunit-binding domains and the E1 tetramers are colored green, red and purple, respectively.
Materials and methods
Sample preparation
The B.stearothermophilus dihydrolipoyl acetyltransferase domain (residues 173–427 of the E2 chain; 28 kDa), assembled as the native icosahedral inner core of the E2 component (1800 kDa), was purified as described previously (Allen and Perham, 1997). Samples of the purified protein (3 mg/ml) in 50 mM sodium phosphate buffer pH 7.0, were frozen in liquid nitrogen and stored at –70°C until required. Samples of the full E2 core decorated with 60 E1 heterotetramers (α2β2) were prepared by reassembly from the full, intact E2 and E1 components generated as recombinant protein products of B.stearothermophilus genes over-expressed in Escherichia coli, also as described previously (Lessard et al., 1998).
Electron microscopy
Untilted images of frozen–hydrated specimens of the E2 core complex were recorded typically at 45 000× magnification using electron doses of ∼10 e–/Å2 with either a Phillips CM12 electron microscope operating at 120 kV, a Hitachi HF2000 field emission gun electron microscope operating at 200 kV, or a JEOL SFF3000 field emission gun electron microscope operating at 300 kV. E1E2 images were recorded under similar conditions on an FEI Tecnai 12 microscope operating at 120 kV at a magnification of 52 000×. Images were recorded over a range of underfocus values to minimize loss of information caused by the contrast transfer function (CTF) of the microscopes. Image quality was assessed with an optical diffractometer, and images displaying minimal drift and minimal astigmatism were digitized on a flat-bed Zeiss-SCAI scanner using a step size of 7 µm. The pixels were binned 2 × 2 to obtain a final pixel size of 14 µm, corresponding to a distance of 3.11 Å in the specimen plane for E2CD and 2.69 Å for E1E2. Estimates for underfocus values of each image were determined computationally using the MRC image processing programs (Crowther et al., 1996).
Image processing and generation of the 3D model
An initial model was constructed using the IMAGIC image processing package (van Heel et al., 1996). For the E2 catalytic domain, 2000 images of well-separated and visually-intact molecules of the same size were selected from three films recorded using the CM12 microscope at defocus values of ∼2 µm. For E1E2, 2279 molecular images, selected from 30 films recorded at underfocus levels ranging from 0.7 to 2 µm on the Tecnai-12 microscope, were used. The images were filtered to retain information over spatial frequencies in the 100–30 Å range, and aligned translationally against a rotational average of all the non-aligned images. A new reference was calculated from the aligned images and used to iterate the alignment procedure. After five additional cycles, the aligned images were subjected to multivariate statistical analysis, and then partitioned into 50 classes using automatic classification (van Heel, 1989). Members of each class were averaged together and classes with the lowest internal variance and well-defined projection views were used as new references for multi-reference alignment (van Heel and Stöffler-Meilicke, 1985) in which individual particles are matched to the best image in the reference set, leading to improved alignment parameters. The alignment step, multivariate analysis and classification steps were iterated for five additional cycles.
The three Eulerian angles defining the geometrical relationship between pairs of characteristic two-dimensional projections were then determined using the angular reconstitution method (van Heel, 1987) with the additional constraint of imposed icosahedral symmetry. The oriented projections were used to calculate a 3D model using an exact back-projection filtering algorithm (Harauz and van Heel, 1986). Following refinement of the Euler angles of the class average projections, views having the lowest error in the angular parameters were used to calculate a 3D map. A set of 35 reprojections of the model that evenly sampled the icosahedral asymmetric triangle was calculated. The model was then refined further by multi-reference alignment of the data set to the reprojections of the 3D structure derived in the previous round, followed by classification, determination of the projection orientations, and the calculation of a new 3D map. This refinement procedure was iterated four times until convergence was achieved.
The resolution of the E1E2 model is limited mainly by the disorder of the complex and the intrinsic heterogeneity of its components. On the other hand, the E2 core domain is much more ordered, and its resolution is limited mainly by the exclusion of data in the micrograph beyond ∼30 Å, which corresponds to the first zero of the CTF of the CM-12 microscope at defocus values of ∼2 µm. We refined both models using a revised version of the program FREALIGN (Grigorieff, 1998), which refines the orientations and centers of particles, corrects for the CTF of each input image and calculates a 3D reconstruction. For E1E2, a final resolution of 28 Å was obtained using the 2279 molecular images obtained with the Tecnai-12 microscope. For the E2 core domain, the CTF-corrected model was used as a reference to determine and refine the orientations of 2458 additional molecular images, some of which were recorded on field emission gun microscopes operating at 200 and 300 kV. All images were corrected for the measured defocus and astigmatism values, as well as for slight differences in magnification in the micrographs recorded on the different microscopes. Spatial frequencies in the resolution range between 200 and 30 Å were used to find the best alignment of the individual images. Since the phase residuals corresponding to different projection views showed noticeable variation, particles could not be excluded simply on the basis of higher phase residuals. No molecular images were therefore excluded from the reconstruction, and the weight of each particle contributing to the final structure was set to be equal. The Eulerian angles corresponding to each of the particles were plotted to assess the spread of molecular orientations. In both cases, excellent coverage over the angular range of the asymmetric triangle was observed, although a slight clustering near the 2- and 3-fold axes was observed for the E1E2 images. Uniform and extensive coverage of the asymmetric triangle gives rise to 3D models that are evenly sampled along all axes, and also minimizes potential model errors that are introduced by aberrant particle images, whose corresponding Eulerian angles could be difficult to determine with accuracy.
It is clear that individual E1E2 particles can deviate from strict icosahedral symmetry and that the E1 subunits must have a degree of flexibility. However, this flexibility is constrained by the length and extension of the linker region, which connects the inner and outer cores, and by the presence of the 60 E1 subunits that surround each E2 inner core. We imposed icosahedral symmetry to improve the alignment of the most highly ordered parts of the structure (i.e. the inner core), which, in turn, would better align the base of the linkers that connect directly to the peripheral subunit-binding domains and bound E1 molecules. So while the individual particle images represent snapshots of the outer E1 subunits in a range of positions, the averaged structure, derived from positional information from over 136 000 individual E1 tetramers, provides information to deduce the mean position(s) of the E1 subunits.
Docking of the coordinates for E1 and E2 intothe density map
Atomic models for the B.stearothermophilus E2 core icosahedral complex and the peripheral subunit-binding domain were obtained from the crystallographic work of Izard et al. (1999) (Protein Data Bank entry 1B5S) and Mande et al. (1996) (PDB entry 1EBD), while an atomic model for the B.stearothermophilus lipoyl domain was obtained from the NMR work of Dardel et al. (1993) (PDB entry 1LAB). Since atomic coordinates of the B.stearothermophilus E1 enzyme are not available, the coordinates of the closely related E1 α2β2 tetramer from Pseudomonas putida (Ævarsson et al., 1999) (PDB entry 1QS0) were used. Sequence alignment of the two enzymes (Hawkins et al., 1990) indicates the presence of additional amino acid segments 42–51, 178–182 and 375–380 in the P.putida E1 α-subunit and 187–192 in its β-subunit, which are not present in the B.stearothermophilus E1 enzyme. A model for the B.stearothermophilus E1 enzyme was therefore obtained by omitting these residues from the P.putida structure. Fitting of the coordinates was carried out as described below using both the original P.putida coordinates and the derived model for B.stearothermophilus E1; the final docked positions are indistinguishable for both sets of coordinates.
Since the occupancy of E1 in the complex used in our studies is known to be ∼100% (Lessard et al., 1998), we made the assumption that the 60 ‘blobs’ of density on the periphery represented the contribution from 60 E1 α2β2 tetramers. Both manual and automated fitting methods were used to position the E2 and E1 structures into the density map. The manual fitting, carried out in the environment of the crystallographic program O (Jones et al., 1991), was completed before we initiated automated fitting. Automated fitting was carried out using a grid-threading Monte Carlo method (Wu et al., 2002), which is described briefly below. The transformation space was spliced into 5 × 5 × 5 grids and orientation space was spliced into 3 × 3 × 3 grids. At each grid point, a 1000-step Monte Carlo search was performed with a reduced temperature of 0.01, initial transformational step size of 15 Å and initial rotational step size of 30°. A core-weighted correlation CWln(ρ), as defined below, was used to describe the match of the density from each E1 to that observed in the map of the E1E2 complex:
where, ρ1and ρn represent the density distribution of an individual E1 α2β2 tetramer map and that of the complex map, respectively. The top bar indicates a core-weighted average as below:
and δ is the core-weighted fluctuation calculated as:
The weighting function, wln is calculated from the core-indices of the E1 density map and the complex, c1 and cn:
where b is a small but non-zero constant, 0.001, to ensure w1n = 0 wherever c1 = 0. The core-index of an electron density map defines the shortest distance from each grid point to the accessible surface of the image. In turn, the accessible surface is determined according to the Laplacian-filtered density calculated as indicated below:
The accessible surface is a continuous surface, which is defined by the collection of the outermost grid points whose ∇2ρijk = 0 when going inward towards a density maximum. We define the region enclosed by the accessible surface as the ‘core’. All grids located outside this core region have core indices of 0. For grids inside the accessible surface, the core indices are 1 more than the minimum core index of neighbouring grids. Thus, the core index cijk is defined as:
The local minima identified in each Monte Carlo search were found to converge to one of the two final positions indicated in Figure 6.
Acknowledgments
Acknowledgements
This work was supported by grants from the National Cancer Institute intramural program to J.L.S.M and to S.S., and by a research grant from the Biotechnology and Biological Sciences Research Council to R.N.P.
References
- Ævarsson A., Seger,K., Turley,S., Sokatch,J.R. and Hol,W.G.J. (1999) Crystal structure of 2-oxoisovalerate and dehydrogenase and the architecture of 2-oxo acid dehydrogenase multienzyme complexes. Nat. Struct. Biol., 6, 785–792. [DOI] [PubMed] [Google Scholar]
- Ævarsson A., Chuang,J.L., Wynn,R.M., Turley,S., Chuang,D.T. and Hol,W.G.J. (2000) Crystal structure of human branched-chain α-ketoacid dehydrogenase and the molecular basis of multienzyme complex deficiency in maple syrup urine disease. Structure, 8, 277–291. [DOI] [PubMed] [Google Scholar]
- Allen M.D. and Perham,R.N. (1997) The catalytic domain of dihydrolipoyl acetyltransferase from the pyruvate dehydrogenase multienzyme complex of Bacillus stearothermophilus. Expression, purification and reversible denaturation. FEBS Lett., 413, 339–343. [DOI] [PubMed] [Google Scholar]
- Bates D.L., Danson,M.J., Hale,G., Hooper,E.A. and Perham,R.N. (1977) Self-assembly and catalytic activity of the pyruvate dehydrogenase multienzyme complex of Escherichia coli. Nature, 268, 313–316. [DOI] [PubMed] [Google Scholar]
- Berg A., Westphal,A.H., Bosma,H.J. and de Kok,A. (1998) Kinetics and specificity of reductive acylation of wild-type and mutated lipoyl domains of 2-oxo-acid dehydrogenase complexes from Azotobacter vinelandii. Eur. J. Biochem., 252, 45–50. [DOI] [PubMed] [Google Scholar]
- Cate R.L., Roche,T.E. and Davis,L.C. (1980) Rapid intersite transfer of acetyl groups and movement of pyruvate dehydrogenase component in the kidney pyruvate dehydrogenase complex. J. Biol. Chem., 255, 7556–7662. [PubMed] [Google Scholar]
- Collins J.H. and Reed,L.J. (1977) Acyl group and electron pair relay system: a network of interacting lipoyl moieties in the pyruvate and α-ketogluterate dehydrogenase complexes from Escherichia coli. Proc. Natl Acad. Sci. USA, 74, 4223–4227. [DOI] [PMC free article] [PubMed] [Google Scholar]
- Crowther R.A., Henderson,R. and Smith,J.M. (1996) MRC image processing programs. J. Struct. Biol., 116, 9–16. [DOI] [PubMed] [Google Scholar]
- Danson M.J., Fersht,A.R. and Perham,R.N. (1978) Rapid intramolecular coupling of active sites in the pyruvate dehydrogenase complex of Escherichia coli: mechanism for rate enhancement in a multimeric structure. Proc. Natl Acad. Sci. USA, 75, 5386–5390. [DOI] [PMC free article] [PubMed] [Google Scholar]
- Dardel F., Davis,A.L., Laue,E.D. and Perham,R.N. (1993) Three-dimensional structure of the lipoyl domain from Bacillus stearothermophilus pyruvate dehydrogenase multienzyme complex. J. Mol. Biol., 229, 1037–1048. [DOI] [PubMed] [Google Scholar]
- Domingo G.J., Chauhan,H.J., Lessard,I.A.D., Fuller,C. and Perham,R.N. (1999) Self-assembly and catalytic activity of the pyruvate dehydro genase multienzyme complex from Bacillus stearothermophilus. Eur. J. Biochem., 266, 1136–1146. [DOI] [PubMed] [Google Scholar]
- Graham L.D., Packman,L.C. and Perham,R.N. (1989). Kinetics and specificity of reductive acylation of lipoyl domains from 2-oxo acid dehydrogenase multienzyme complexes. Biochemistry, 28, 1574–1581. [DOI] [PubMed] [Google Scholar]
- Green J.D.F., Perham,R.N., Ullrich,S.J. and Appella,E. (1992) Con formational studies of the interdomain linker peptides in the dihydrolipoyl acetyltransferase component of the pyruvate dehydrogenase multienzyme complex of Escherichia coli. J. Biol. Chem., 267, 23484–23488. [PubMed] [Google Scholar]
- Grigorieff N. (1998) Three-dimensional structure of bovine NADH: ubiquinone oxidoreductase (complex I) at 22 Å in ice. J. Mol. Biol., 277, 1033–1046. [DOI] [PubMed] [Google Scholar]
- Harauz G. and van Heel,M. (1986) Exact filters for general geometry three dimensional reconstruction. Optik, 73, 146–156. [Google Scholar]
- Hawkins C.F., Borges,A. and Perham,R.N. (1990) Cloning and sequence analysis of the genes encoding the α and β subunits of the E1 component of the pyruvate dehydrogenase multienzyme complex of Bacillus stearothermophilus. Eur. J. Biochem., 191, 337–346. [DOI] [PubMed] [Google Scholar]
- Izard T., Ævarsson,A., Allen,M.D., Westphal,A.H., Perham,R.N., de Kok,A. and Hol,W.G.J. (1999) Principles of quasi-equivalence and Euclidean geometry govern the assembly of cubic and dodecahedral cores of pyruvate dehydrogenase complexes. Proc. Natl Acad. Sci. USA, 96, 1240–1245. [DOI] [PMC free article] [PubMed] [Google Scholar]
- Jones T.A., Zou,J.Y., Cowan,S.W. and Kjeldgaard,M. (1991) Improved methods for building protein models in electron density maps and the location of errors in these models. Acta Crystallogr. A, 47, 110–119. [DOI] [PubMed] [Google Scholar]
- Kalia Y.N., Brocklehurst,S.M., Hipps,D.S., Appella,E., Sakaguchi,K. and Perham,R.N. (1993). The high resolution structure of the peripheral subunit-binding domain of dihydrolipoamide acetyltrans ferase from the pyruvate dehydrogenase multienzyme complex of Bacillus stearothermophilus. J. Mol. Biol., 230, 323–341. [DOI] [PubMed] [Google Scholar]
- Lessard I.A.D. and Perham,R.N. (1995) Interaction of component enzymes with the peripheral subunit-binding domain of the pyruvate dehydrogenase multienzyme complex from Bacillus stearothermo philus: stoichiometry and specificity in self assembly. Biochem. J., 306, 727–733. [DOI] [PMC free article] [PubMed] [Google Scholar]
- Lessard I.A.D., Fuller,C. and Perham,R.N. (1996) Competitive interaction of component enzymes with the peripheral subunit-binding domain of the pyruvate dehydrogenase multienzyme complex of Bacillus stearothermophilus: kinetic analysis using surface plasmon resonance detection. Biochemistry, 35, 16863–16870. [DOI] [PubMed] [Google Scholar]
- Lessard I.A.D., Domingo,G.J., Borges,A. and Perham,R.N. (1998) Expression of genes encoding the E2 and E3 components of the Bacillus stearothermophilus pyruvate dehydrogenase complex and the stoichiometry of subunit interaction in assembly in vitro. Eur. J. Biochem., 258, 491–501. [DOI] [PubMed] [Google Scholar]
- Mande S.S., Sarfaty,S., Allen,M.D., Perham,R.N. and Hol,W.G.J. (1996) Protein–protein interactions in the pyruvate dehydrogenase multienzyme complex: dihydrolipoamide dehydrogenase complexed with the binding domain of dihydrolipoamide acetyltransferase. Structure, 4, 277–286. [DOI] [PubMed] [Google Scholar]
- Mattevi A., Obmolova,G., Schulze,E., Kalk,K.H., Westphal,A.H., de Kok,A. and Hol,W.G.J. (1992) Atomic structure of the cubic core of the pyruvate dehydrogenase multienzyme complex. Science, 255, 1544–1550. [DOI] [PubMed] [Google Scholar]
- Nellis M.M. and Danner,D.J. (2001) Gene preferences in maple syrup urine disease. Am. J. Hum. Genet., 68, 232–237. [DOI] [PMC free article] [PubMed] [Google Scholar]
- Packman L.C., Stanley,C.J. and Perham,R.N. (1983) Temperature-dependence of intramolecular coupling of active sites in pyruvate dehydrogenase multienzyme complexes. Biochem. J., 213, 331–338. [DOI] [PMC free article] [PubMed] [Google Scholar]
- Patel M.S. and Harris,R.A. (1995) Mammalian α-keto acid dehydro genase complexes—gene regulation and genetic defects. FASEB J., 9, 1164–1172. [DOI] [PubMed] [Google Scholar]
- Perham R.N. (1991) Domains, motifs, and linkers in 2-oxo acid dehydrogenase multienzyme complexes: a paradigm in the design of a multifunctional protein. Biochemistry, 30, 8501–8512. [DOI] [PubMed] [Google Scholar]
- Perham R.N. (2000) Swinging arms and swinging domains in multifunctional enzymes: catalytic machines for multistep reactions. Annu. Rev. Biochem., 69, 961–1004. [DOI] [PubMed] [Google Scholar]
- Radford S.E., Laue,E.D., Perham,R.N., Martin,S.R. and Appella,E. (1989) Conformational flexibility and folding of synthetic peptides representing an interdomain segment of polypeptide chain in the pyruvate dehydrogenase multienzyme complex of Escherichia coli. J. Biol. Chem., 264, 767–775. [PubMed] [Google Scholar]
- Reed L.J. and Hackert,M.L. (1990) Structure–function relationships in dihydrolipoamide acyltransferases. J. Biol. Chem., 265, 8971–8974. [PubMed] [Google Scholar]
- Stoops J.K., Cheng,R.H., Yazdi,M.A., Maaeng,C.-Y., Schroeter,J.P., Klueppelberg,U., Kolodziej,S.J., Baker,T.S. and Reed,L.J. (1997) On the unique structural organization of the Saccharomyces cerevisiae pyruvate dehydrogenase complex. J. Biol. Chem., 272, 5757–5764. [DOI] [PMC free article] [PubMed] [Google Scholar]
- van Heel M. (1987) Angular reconstitution: a posteriori assignment of projection directions for 3D reconstruction. Ultramicroscopy, 21, 111–124. [DOI] [PubMed] [Google Scholar]
- van Heel M. (1989) Classification of very large electron microscopical image data sets. Optik, 82, 114–126. [Google Scholar]
- van Heel M. and Stöffler-Meilicke,M. (1985) Characteristic views of E.coli and B.stearothermophilus 30S ribosomal subunits in the electron microscope. EMBO J., 4, 2389–2395. [DOI] [PMC free article] [PubMed] [Google Scholar]
- van Heel M., Harauz,G., Orlova,E.V., Schmidt,R. and Schatz,M. (1996) A new generation of the IMAGIC image processing system. J. Struct. Biol., 116, 17–24. [DOI] [PubMed] [Google Scholar]
- Wagenknecht T., Grassucci,R. and Schaak,D. (1990) Cryoelectron microscopy of frozen–hydrated α-ketoacid dehydrogenase com plexes from Escherichia coli. J. Biol. Chem., 265, 22402–22408. [PubMed] [Google Scholar]
- Wagenknecht T., Grassucci,R., Radke,G.A. and Roche,T.E. (1991) Cryoelectron microscopy of mammalian pyruvate dehydrogenase complex. J. Biol. Chem., 266, 24650–24656. [PubMed] [Google Scholar]
- Wu X., Milne,J.L.S., Borgnia,M.J., Rostapshov,A.V., Subramaniam,S. and Brooks,B.R. (2002) A core-weighted fitting method for docking atomic structures into low resolution maps: application to cryo-electron microscopy. J. Struct. Biol., in press. [DOI] [PMC free article] [PubMed] [Google Scholar]
- Yeaman S.J., Kirby,J.A. and Jones,D.E.J. (2000) Autoreactive responses to pyruvate dehydrogenase complex in the pathogenesis of primary biliary cirrhosis. Immunol. Rev., 174, 238–249. [DOI] [PubMed] [Google Scholar]
- Zhou H., McCarthy,D.B., O’Connor,C.M., Reed,L.J. and Stoops,J.K. (2001) The remarkable structural and functional organization of the eukaryotic pyruvate dehydrogenase complexes. Proc. Natl Acad. Sci. USA, 98, 14802–14807. [DOI] [PMC free article] [PubMed] [Google Scholar]


