Abstract
In mammals, toxic electrolytes of endogenous and exogenous origin are excreted through the urine and bile. Before excretion, these compounds cross numerous cellular membranes in a transporter-mediated manner. However, the protein transporters involved in the final excretion step are poorly understood. Here, we show that MATE1, a human and mouse orthologue of the multidrug and toxin extrusion family conferring multidrug resistance on bacteria, is primarily expressed in the kidney and liver, where it is localized to the luminal membranes of the urinary tubules and bile canaliculi. When expressed in HEK293 cells, MATE1 mediates H+-coupled electroneutral exchange of tetraethylammonium and 1-methyl-4-phenylpyridinium. Its substrate specificity is similar to those of renal and hepatic H+-coupled organic cations (OCs) export. Thus, MATE1 appears to be the long searched for polyspecific OC exporter that directly transports toxic OCs into urine and bile.
Keywords: multidrug and toxin extrusion, multidrug export, urinary tubule, bile canaliculi
Living organisms must deal with environmental toxins, metabolic waste products, and, primarily in humans, drugs with extremely diverse structures to remain viable. In mammals, these toxic organic compounds are mainly excreted through the kidney and liver. Renal excretion involves glomerular filtration and/or tubular secretion. Toxic organic compounds are taken up at the basolateral membranes of tubule cells, followed by excretion out of the cells at the brush-border membranes (1–7). Hepatocytes also absorb toxic organic compounds at the sinusoidal membranes and excrete them through the bile canaliculi (1–7). Although it has been concluded from a large number of biochemical and physiological studies that a transporter(s) is principally responsible for the final step of excretion of organic cations (OCs), its molecular identity remains unknown (5–7). The putative OC exporter mediates electroneutral H+/OCs exchange (5–7). Furthermore, it recognizes a wide variety of OCs including cationic drugs, some vitamins, and many endogenous compounds such as choline and dopamine and, thus, should be regarded as a multidrug or polyspecific exporter (5–7). Therefore, we hypothesized that mammalian orthologue(s) of bacterial multidrug transporters, if any, are responsible for the extrusion of OCs.
Bacterial multidrug transporters have been classified into several groups, which include the major facilitator superfamily, the small multidrug resistance family, the resistance nodulation cell division family, the ATP binding cassette family, and the multidrug and toxin extrusion (MATE) family (8–10). Of them, the MATE family is the most recently classified multidrug resistance-conferring protein family (8–10). Although the overall properties of the MATE family have not been elucidated, some MATE-type proteins mediate H+- or Na+-coupled export of cationic drugs in bacteria (8–10).
Here, we identify human and mouse MATE orthologues, MATE1 and MATE2. We present evidence that MATE1 is predominantly expressed in kidney and liver and responsible for the final step of excretion of OCs through exchange of protons.
Materials and Methods
cDNAs. cDNA of human MATE1 (hMATE1, GenBank accession no. NP-060712) was cloned by RT-PCR from human brain RNA. After synthesis, the cDNA solution was diluted ×10 and added to the PCR buffer, which contained 0.6 mM total dNTPs (150 μM each dNTP), 25 pmol of each primer, and 1.5 units of AmpliTaq Gold DNA polymerase (PerkinElmer). Amplification was carried out with 35 temperature cycles consisting of denaturation at 94°C for 30 s, annealing at 56°C for 30 s, and extension at 72°C for 1 min. The amplification products (1,804 bp) were analyzed by agarose gel electrophoresis. The primers used were based on database sequences (GenBank accession no. AK001709) 5′-GGCCGGTACCCGCGAGTCACATGGAAGCTC-3′ (sense) and 5′-CACTTCTAGACCTGTGAATTGTGTGTAAGC-3′ (antisense). The DNA fragment was digested with KpnI and XbaI, and then cloned into pBluescriptKS(+). The sequence of hMATE1 was confirmed to be free of errors by comparing it with the human genome sequence. cDNAs of human MATE2 (hMATE2, GenBank accession no. NP-690872), mouse MATE1 (mMATE1, GenBank accession no. AAH31436) and mouse MATE2 (mMATE2, GenBank accession no. XP_354611) were also cloned as above.
Mutagenesis. Point mutation E273Q was introduced into the wild-type hMATE1 by means of the overlap extension method employing the 5′-GGCCCACCACTGCATGCACAGCATGAGC-3′ oligonucleotide according to the published procedure (11).
Northern Blot Analysis. Human and mouse multiple-tissue Northern blots were purchased from Clontech. For Northern analysis, nucleotide fragments encoding the N-terminal region of hMATE1 (nucleotides 10–601; 592 bp), the C-terminal region of hMATE2 (nucleotides 1412–1712; 301 bp), the C-terminal region of mMATE1 (nucleotides 1336–1599; 264 bp), and the C-terminal region of mMATE2 (nucleotides 1087–1648; 562 bp) generated by PCR and labeled with 32P-dCTP by using DNA labeling kit (Roche Molecular Biochemicals) were used as hybridization probes. Hybridization was performed at 68°C for 1 h in Express Hyb hydridization buffer (Clontech), with washing under high-stringency conditions at 50°C.
Antibodies. Site-specific rabbit (JW) polyclonal antibodies against hMATE1 and mMATE1 were prepared by repeated injections of GST-fusion polypeptides encoding amino acid residues N461–R546 of hMATE1 (NWKKACQQAQVHANLKVNNVPRSGNSALPQDPLHPGCPENLEGILTNDVGKTGEPQSDQQMRQEEPLPEHPQDGAKLSRKQLVLRR) and amino acid residues P495–Q532 of mMATE1 (PESHGEIMMTDLEKKRRDSVGPADEPATSFAYPSKGQQ).
Western Blot Analysis. Human tissue samples were obtained from CosmoBio. Total membrane fractions of mouse (ddY) tissues (≈1 g wet weight each) were isolated, suspended in 20 mM Mops-Tris, pH. 7.0, 0.3 M sucrose, 5 mM EDTA, and protease inhibitors (pepstatin A, leupeptin, antipain, and chymostatin at 10 μg/ml each), and then homogenized. The postnuclear supernatant was centrifuged at 100,000 × g for 1 h, and the pellet was suspended in the same buffer and used as a protein sample after denaturation with buffer containing 1% SDS and 10% 2-mercaptoethanol. Samples (100 μg of protein for human and 200 μg of protein for mouse) were subjected to electrophoresis; Western blotting was performed subsequently as described (12).
Immunohistochemistry. Human paraffin tissue sections were obtained from Biochain. Immunohistochemical analysis was performed by the HRP-DAB method or indirect immunofluorescence microscopy as described (12). The primary antibody treatment was performed at a concentration of 1 μg/ml or diluted ×1,000 in PBS containing 0.5% BSA for 1 h at room temperature. Specimens were then examined under either an Olympus BX60 microscope or an Olympus FV300 confocal laser microscope.
Immunoelectron Microscopy. The preembedding silver enhancement immunogold method was used as described (12). Mice (ddY) were anesthetized with ether and then perfused intracardially with saline, followed by 4% paraformaldehyde in 0.1 M phosphate buffer, pH 7.4. The kidneys were isolated and washed with PBS. The organs were successively infiltrated with 30% sucrose in PBS, embedded in OTC compound (Sakura FineTek), sectioned at 6 μm thickness, and then mounted on silanized slides. The sections were incubated in 0.1 M sodium phosphate buffer (pH 7.4) containing 0.25% saponin and 5% BSA for 30 min and then in a blocking solution composed of 0.005% saponin, 10% BSA, 10% goat serum, and 0.1% cold water fish gelatin (Sigma) for 30 min. The sections were incubated with rabbit anti-mMATE1 antiserum diluted ×1,000 with the blocking solution overnight at 4°C. After extensively washing the sections with the buffer containing 0.005% saponin, the sections were incubated in the blocking solution containing goat anti-rabbit IgG gold conjugate (gold particle diameter, 1.4 nm) for 2 h, washed six times with the buffer, and then fixed with 1% glutaraldehyde for 10 min. After washing again, the gold labeling was intensified by using a silver enhancement kit (HQ silver Nanoprobes) for 5 min at room temperature. The sections were postfixed with 0.5% OsO4 for 90 min. Ultrathin sections were made and doubly stained with uranyl acetate and lead citrate, and were examined under a Hitachi H-7100 electron microscope.
Transport Assay. cDNA encoding hMATE1 was subcloned into the expression vector pcDNA3.1(+) (Invitrogen); this plasmid, pcDNA/hMATE1, was used to transfect HEK293 cells by the lipofection using TransIT reagent (Mirus). HEK293 cells were grown in DMEM containing 10% FCS, penicillin, and streptomycin at 37°C under 5% CO2 as described (13). Twenty-four hours later, 10 μg of pcDNA3.1/hMATE1 or the vector pcDNA3.1 were used per transfection (1.5 × 10⁶ cells on a 10-cm dish). The cells were grown for 2 days, harvested, and suspended in transport assay medium containing 125 mM NaCl, 4.8 mM KCl, 5.6 mM d-glucose, 1.2 mM CaCl2, 1.2 mM KH2PO4, 1.2 mM MgSO4, and 25 mM Tricine (pH 8.0). Cells were incubated at 37°C for 5 min; the transport assay was initiated by adding 50 μM radiolabeled tetraethylammonium (TEA) (5 KBq per assay) (PerkinElmer Life Science) as described (13). At appropriate times, aliquots of the mixture (200 μl) were filtered through 0.45-μm HA membrane filters (Millipore). Each filter was washed with ice-cold medium, and the radioactivity remaining on the filter was counted.
Results and Discussion
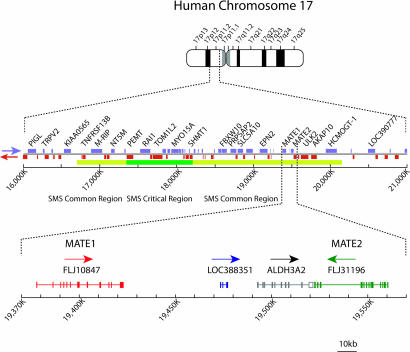
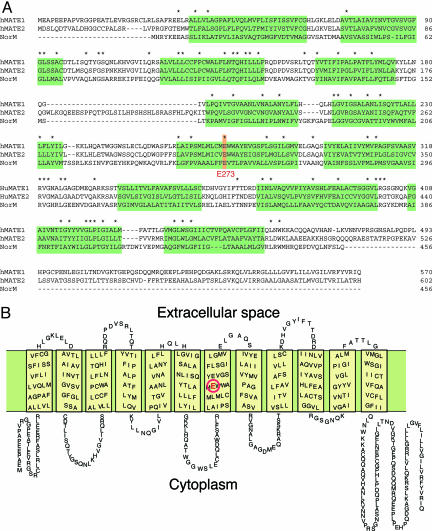
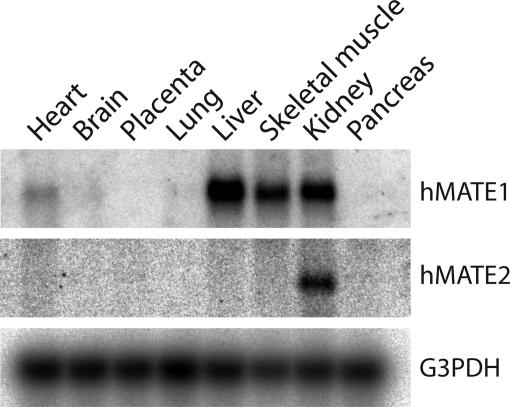
Gene Organization and Expression of Human MATEs. We searched for mammalian orthologues of bacterial MATE-type multidrug transporters in genomic databases. Upon screening the entire working draft of the human genome database, we found two genes encoding orthologues of bacterial MATE family. The genes are located in tandem on chromosome 17, and the gene products are designated hMATE1 (GenBank accession no. NP-060712) and hMATE2 (GenBank accession no. NP-690872) (Fig. 1). The deduced amino acid sequences of hMATE1 and hMATE2 exhibit 19.8% and 18.6% identity to that of the NorM Na+/multidrug antiporter in Vibrio parahaemolyticus, a prototype of the MATE family (14) (Fig. 2A). A hydropathy plot of hMATE1 predicts 12 transmembrane domains (Fig. 2B). Northern blot analysis of human tissues revealed that the gene encoding hMATE1 is primarily expressed in kidney, liver, and skeletal muscle as a 4.1-kb transcript. The expression in the other organs examined was below the detection limit (Fig. 3). In contrast, the gene encoding hMATE2 is expressed as a 3.2-kb transcript in kidney but not in liver (Fig. 3).
Fig. 1.
Chromosomal localization and gene organization of hMATE1 and hMATE2.
Fig. 2.
Amino acid sequences of hMATE1 and hMATE2. (A) The amino acid sequences of the proteins are aligned with that of NorM (14). Identical sequences are indicated by asterisks. Predicted transmembrane regions are shaded. (B) Putative secondary structure of hMATE1. A glutamate residue (E273) that is essential for the transport activity is shown in red (16).
Fig. 3.
Expression of hMATE1 and hMATE2 in humans. Northern blot analysis revealed that the expression of hMATE1 (Top) was predominantly in the kidney, liver, and skeletal muscle, and that of hMATE2 (Middle) was primarily in kidney. Expression of G3PDH was also shown as a loading control (Bottom).
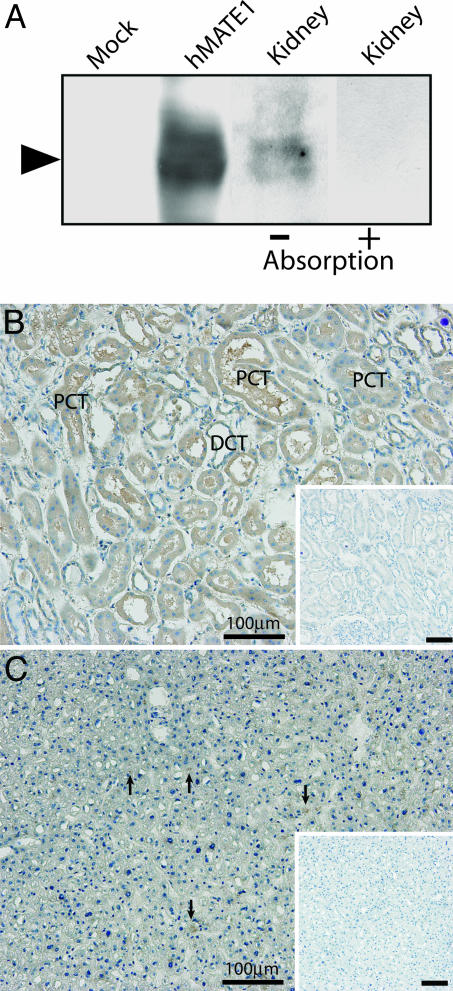
Renal and Hepatic Localization of hMATE1. We attempted to determine the expression and localization of hMATE1 as a candidate H+-coupled OC exporter at the protein level. In Western blot analysis, site-specific polyclonal antibodies against the C-terminal region of hMATE1 revealed the broad immunoreactive protein band of the expected size (≈62 kDa) in human kidney membranes (Fig. 4A). The preabsorbed antibodies did not yield the immunoreactivity (Fig. 4A). Horseradish peroxidase–diaminobenzidine (HRP–DAB) staining of human tissues showed that the antibodies predominantly immunostained the apical regions of the proximal and distal convoluted tubules of the kidney (Fig. 4B) and bile canaliculi (Fig. 4C, arrows).
Fig. 4.
MATE1 is a membrane protein localized to the apical membrane of renal tubule cells and bile canaliculi. (A) Western blot analysis of hMATE1. The antibodies recognized hMATE1 expressed in transfected HEK293 cells and identified an immunological counterpart in human kidney tissue. The preabsorption test was performed by incubating the antibody with hMATE1 polypeptides (N461–R546) (20 μg/ml). Proteins from HEK293 cells transfected with pcDNA3.1 vector alone were used as the mock control. (B and C) Immunohistochemical detection of hMATE1 in kidney (B) and liver (C). Sections of human samples were immunostained by the HRP method and counterstained with hematoxylin. (Insets) Background staining with preimmune serum. PCT, proximal convoluted tubule; DCT, distal convoluted tubule. (Scale bars, 100 μm.)
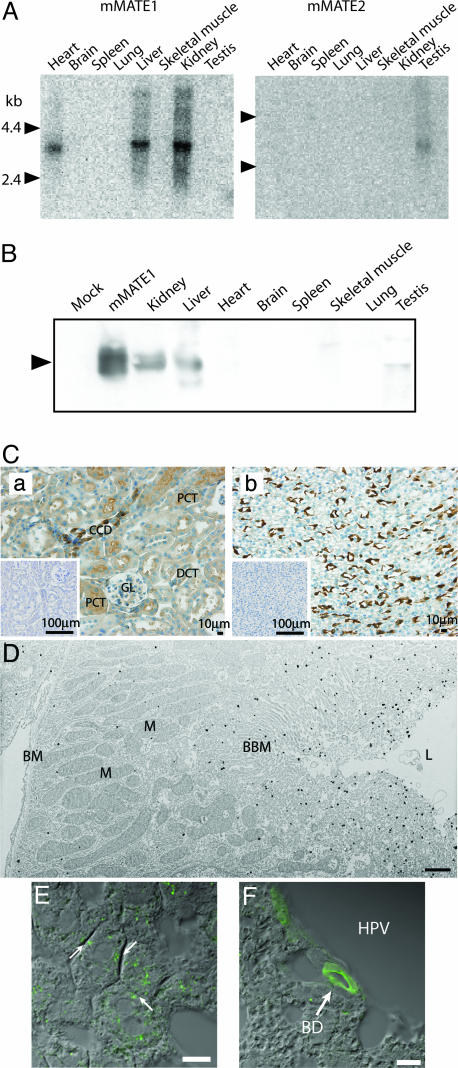
Expression and Localization of mMATE1. Because of the limited availability and quality of human samples for studies on the subcellular localization of MATE1, we investigated mouse homologues. Genes encoding mouse homologues are located in tandem on chromosome 11 and the gene products are designated mMATE1 (GenBank accession no. AAH31436) and mMATE2 (GenBank accession no. XP_354611) (Fig. 8, which is published as supporting information on the PNAS web site). Their deduced amino acid sequences are 78.1 and 38.1% identical to that of their human counterparts, respectively (Fig. 9, which is published as supporting information on the PNAS web site). Northern blot analysis showed that gene encoding mMATE1 was predominantly expressed in kidney, liver, and heart as a 3.8-kb transcript, whereas that of mMATE2 was specifically expressed in testis as a 3.3-kb transcript (Fig. 5A). In Western blot analysis, site-specific polyclonal antibodies for mMATE1 recognized a single polypeptide of ≈53 kDa in the membranes of the kidney and liver, but the levels were low or below the detection limit in the other organs examined (Fig. 5B). The HRP-DAB staining of a mouse kidney specimen revealed strong immunoreactivity in the apical region of cortical collecting ducts, proximal convoluted tubules (Fig. 5Ca), and thin limb of Henle's loop (Fig. 5Cb). Lower but distinct immunoreactivity was also observed in the distal convoluted tubules and glomerulus (Fig. 5Ca). The localization of mMATE1 in the brush border membrane of proximal tubules was demonstrated by immunoelectron microscopy (Fig. 5D). In the liver, mMATE1 is localized to the bile canaliculi (Fig. 5E) and the apical region of the bile duct (Fig. 5F). Together, these results demonstrated that MATE1 is predominantly found in the kidney and liver and is localized to the renal brush-border membrane and bile canaliculi, which agrees with that of H+/OC exchange activity (5–7).
Fig. 5.
Expression and localization of mMATE1 and mMATE2. (A) Northern blotting revealed that the expression of mMATE1 was predominantly in the kidney and liver (Left) and that of mMATE2 in testis (Right). kb, kilobases. (B) Western blot analysis indicated that the site-specific antibody recognized the mMATE1 polypeptide in kidney and liver of mice (arrow). Little immunoreactivity was observed in testis, and no mMATE1 was observed in membrane fractions prepared from other organs. (C) HRP-DAB immunostaining revealed that mMATE1 was localized to the renal cortex (a) and medulla (b). GL, glomerulus; PCT, proximal convoluted tubule; DCT, distal convoluted tubule; CCD, cortical collecting duct. (Scale bars, 100 μm.) (D) In immunoelectron micrographs, mMATE1 was observed in the apical membrane of renal proximal tubules. BBM, brush border membrane; BM, basal membrane; M, mitochondrion; L, lumen. (Scale bar, 1 μm.) (E and F) In liver, mMATE1 (green) was localized to the canalicular membrane (E) and the apical membrane of the bile duct (F), as revealed by indirect immunofluorescent microscopy. BD, interlobular bile duct; HPV, hepatic portal vein. Pictures merged with Nomarski images are shown. (Scale bars, 10 μm.)
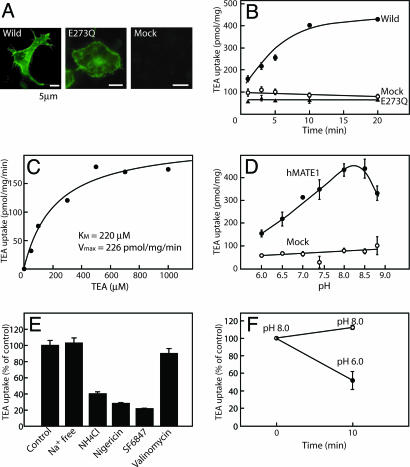
MATE1 Mediates a H+-Coupled Electroneutral OC Exchange. To answer the question whether MATE1 exhibits H+-coupled OC transport, we measured the pH-dependent translocation of OCs across the plasma membranes of hMATE1-expressing HEK293 cells. This approach allowed us to study the luminal efflux of OCs as a classical cellular uptake (13). Upon expression of hMATE1, the protein predominantly localized at the plasma membrane region (Fig. 6A). Some immunoractivity was also observed in the internal organelles. The hMATE1-expressing cells exhibited time-dependent transport activity toward TEA, a typical substrate for the H+-coupled OC exporter (2, 15), whereas MOCK control cells did not (Fig. 6B). Mutated hMATE1 with the amino acid replacement E273Q (Glu-273 to Gln), the counterpart of an essential amino acid residue found in the bacterial NorM protein (16), also predominantly localized at the plasma membrane region but lacked detectable MATE1-dependent TEA transport activity (Fig. 6 A and B). The transport activity of the wild type was saturable, with a Km value for TEA of 220 μM (Fig. 6C). The transport also showed pH dependence: the transport activity was lower at pH 6.0, increased at higher extracellular pH, and became maximal at around pH 8.0–8.5 (Fig. 6D). Na+ was not required for transport activity (Fig. 6E). The addition of 5 μM valinomycin in the presence of 65 mM KCl, which causes membrane depolarization, did not affect the TEA uptake, whereas 10 mM ammonium chloride inhibited the uptake by 60%. In addition, 10 μM SF6847, a proton conductor, and 5 μM nigericin in the presence of KCl, which dissipates the pH gradient, decreased the uptake to the level of MOCK control (Fig. 6E). Furthermore, TEA taken up by the cells was released upon an acute decrease in extracellular pH to 6.0 by means of acid pulse (Fig. 6F). Together, these results indicated that hMATE1 mediated electroneutral H+/TEA exchange. The pharmacology of the cis-inhibition of TEA transport was similar to that of renal H+-coupled OC export (1–7): it is strongly inhibited by cimetidine, quinidine, or verapamil, less so by nicotine or choline, but not at all by organic anions such as p-aminohippurate (PAH) and uric acid (Table 1). Similar pH-dependent transport was observed for 1-methyl-4-phenylpyridinium (MPP), another well known substrate of the H+-coupled OC export (5); the Km and Vmax measured were 16 μM and 170 pmol/min per mg of protein, respectively. Thus, MATE1 exhibited properties equivalent to those of the putative renal H+-coupled OC exporter.
Fig. 6.
MATE1 mediates electroneutral H+/TEA exchange. (A) Presence of wild-type and E273Q mutated hMATE1 in HEK293 cells, as revealed by indirect immunofluorescence microscopy. No immunoreactivity was observed in a mock control, which was from HEK293 cells transfected with pcDNA3.1 vector alone. (B) Time course of TEA (50 μM) uptake at pH 8.0 by HEK293 cells expressing hMATE1, the E273Q mutant, or a mock control. (C) Dose dependence of TEA uptake at pH 8.0. The values obtained at the indicated concentrations from the mock control cells were subtracted from the corresponding values obtained from cells expressing wild-type hMATE1. (D) pH dependence of TEA uptake. HEK293 cells expressing wild-type hMATE or a mock control were incubated at the indicated pH, and TEA uptake was then measured. (E) The effect of Na+ on TEA uptake was examined in buffer containing 65 mM KCl and 65 mM NaCl (control) or in buffer containing 130 mM KCl (Na+ free). The requirement of a membrane potential or pH gradient for TEA uptake was also examined at pH 8.0 in the absence or presence of 10 mM ammonium chloride, 5 μM nigericin, 10 μM SF6847, or 5 μM valinomycin in buffer containing 65 mM KCl and 65 mM NaCl (control). (F) pH-dependent extrusion of TEA. hMATE1-expressing cells were incubated with 50 μM radiolabeled TEA as in Fig. 2B for 10 min. Then, the cells were transferred to buffer with the indicated pH (time 0) and incubated for a further 10 min and the remaining radioactivity then assayed. Error bars are the standard deviation of three samples.
Table 1. Cis-inhibition of TEA transport by hMATE1.
| Compound | mM | Transport, % of control |
|---|---|---|
| Mock control | 18.6 ± 1.2 | |
| No addition (Control) | 100.0 ± 1.9 | |
| Cimetidine | 0.01 | 55.1 ± 7.4** |
| 0.1 | 26.4 ± 8.7** | |
| Quinidine | 0.01 | 47.0 ± 2.1** |
| 0.05 | 22.8 ± 8.9** | |
| 0.1 | 10.2 ± 4.2** | |
| Procainamide | 0.1 | 69.5 ± 0.8** |
| Verapamil | 0.1 | 24.7 ± 7.4** |
| Guanidine | 0.5 | 94.6 ± 7.6 |
| Carnitine | 5 | 103.4 ± 6.4 |
| TEA | 5 | 19.0 ± 1.8** |
| MPP | 0.1 | 73.4 ± 8.4* |
| 5 | 11.2 ± 0.3** | |
| Nicotine | 0.1 | 70.4 ± 5.0* |
| 5 | 23.1 ± 4.3** | |
| Serotonin | 0.1 | 83.5 ± 8.0* |
| Rhodamine123 | 0.01 | 22.5 ± 6.4** |
| NMN | 1 | 94.7 ± 1.9 |
| Choline | 5 | 69.6 ± 4.1** |
| Corticosterone | 0.1 | 26.6 ± 6.7** |
| Lactate | 10 | 103.1 ± 8.8 |
| Succinate | 10 | 106.6 ± 4.2 |
| Salicylate | 10 | 98.2 ± 4.8 |
| PAH | 5 | 108.4 ± 2.7 |
| Probenecid | 1 | 106.9 ± 7.9 |
| Urate | 1 | 102.4 ± 2.7 |
Cis-inhibition of TEA uptake revealed the substrate specificity of MATE1. The uptake of 50 μM radiolabeled TEA by hMATE1-expressing HEK293 cells at pH 8.0 was determined after 20 min in the presence or absence of the listed compounds at the indicated concentrations. The values were expressed as percentages of radiolabeled TEA uptake under control conditions (no test substance added). NMN, N-methyl nicotinamide; PAH, p-aminohippurate. Data are means ± SEM, n = 3-9. *, P < 0.05; **, P < 0.001, compared with the uptake in the absence of the compound (control).
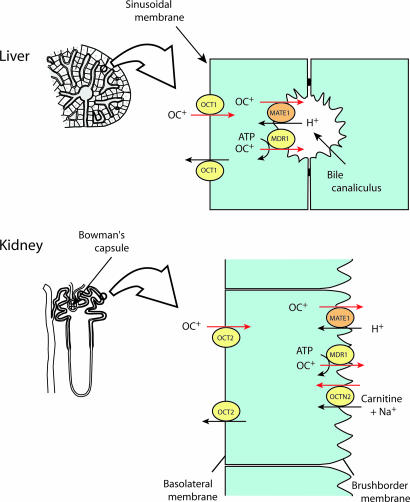
MATE1 as an OC Exporter at the Final Step of Excretion. Based on this information, we conclude that MATE1 is the long searched for H+-coupled OC exporter that mediates the final step of excretion of OCs in kidney and liver (Fig. 7). Our findings contribute to the understanding of the transporters underlying the excretion of toxic OCs from the body: OCs are taken up by organic cation transporter 1 (OCT1) or OCT2 in the renal tubule cells and hepatocytes (4–7), and then excreted out of the cells through a cooperation between MATE1 and P-glycoprotein (Fig. 7). The H+-coupled electroneutral transport should be important for permeation of OCs against potential difference across the plasma membrane. The cis-inhibition experiment suggested that MATE1 recognized various kinds of physiological metabolites, such as corticosterone, as transport substrates (Table 1). Because MATE1 and MATE2 were expressed in organs other than kidney and liver (Figs. 3 and 5A), the function of mammalian MATE-type transporters may not be limited to the excretion of OCs, but may also act as molecular devices that allow homeostasis of electrolytes through efficient and regulated transportation of physiological metabolites of various sizes, structures, and hydrophobicity.
Fig. 7.
MATE1 is a polyspecific OC exporter at the final step of OC excretion. In liver, hepatocytes take up OCs at the sinusoidal membrane through an organic cation transporter 1 (OCT1), and then extrude them across the bile canaliculi by a combination of MATE1 and a multidrug resistance protein 1 (MDR1). In kidney, OCs are taken up by the renal tubular cells mainly through an organic cation transporter 2 (OCT2) located in the basolateral membrane and secreted by different transporters including MATE1, MDR1, and OCTN2 (OCT isoform).
It is noteworthy that the MATE genes are among the ≈80 genes located in the commonly deleted region in Smith–Magenis syndrome, a genomic disorder of chromosome 17p11.2 involving multiple congenital anomalies and mild mental retardation (17, 18). Most of the abnormalities in this syndrome are ascribed to hemizygosity for the retinoic acid-induced 1 gene (RAI1). The absence of short stature and visceral abnormalities in patients with point mutations in this gene suggest that hemizygosity for one or more other genes in this region explain these two features of the deletion syndrome (19, 20). Whether hemizygosity for hMATE1 (and also hMATE2) has any physiological significance or contributes to some of the features of this disorder remain to be determined. Nonetheless, the discovery of MATE1 provides a molecular target for studies on the interactions between exogenous toxins, drugs, and endogenous metabolites that could have a relationship to developmental and metabolic abnormalities.
Our results demonstrated the conservative nature of the MATE superfamily as a polyspecific OC exporter. It is quite likely that the resistance to drugs and endogenous toxic metabolites observed in plants can be attributed to their MATE homologues (21–23). The MATE family is one of the fundamental OC exporters in nature and has a wide variety of roles through the excretion or sequestration of OCs and related compounds.
Supplementary Material
Acknowledgments
We thank Dr. Akitsugu Yamamoto for valuable discussion. This work was supported in part by Japanese Ministry of Education, Science, Sport, and Culture Grant-in-Aid for Research 16017264.
Author contributions: M.O., H.O., and Y.M. designed research; M.O., T.M., R.M., S.A., H.O., and Y.M. performed research; and M.O., H.O., and Y.M. wrote the paper.
Conflict of interest statement: No conflicts declared.
This paper was submitted directly (Track II) to the PNAS office.
Abbreviations: OC, organic cation; MATE, multidrug and toxin extrusion; hMATE, human mate; TEA, tetraethylammonium.
References
- 1.Pritchard, J. B. & Miller, D. S. (1993) Physiol. Rev. 73, 765–796. [DOI] [PubMed] [Google Scholar]
- 2.Ullrich, K. J. (1994) Biochim. Biophys. Acta 1197, 45–62. [DOI] [PubMed] [Google Scholar]
- 3.Oude Elferink, R. P., Meijer, D. K., Kuipers, F., Jansen, P. L., Groen, A. K. & Groothuis, G. M. (1995) Biochim. Biophys. Acta 1241, 215–268. [DOI] [PubMed] [Google Scholar]
- 4.Koepsell, H. (1998) Annu. Rev. Physiol. 60, 243–266. [DOI] [PubMed] [Google Scholar]
- 5.Inui, K. I., Masuda, S. & Saito, H. (2000) Kidney Int. 58, 944–958. [DOI] [PubMed] [Google Scholar]
- 6.Wright, S. H. & Dantzler, W. H. (2004) Physiol. Rev. 84, 987–1049. [DOI] [PubMed] [Google Scholar]
- 7.Koepsell, H. (2004) Trends Pharmacol. Sci. 25, 375–381. [DOI] [PubMed] [Google Scholar]
- 8.Brown, M. H., Paulsen, I. T. & Skurray, R. A. (1999) Mol. Microbiol. 31, 394–395. [DOI] [PubMed] [Google Scholar]
- 9.Putman, M., van Veen, H. W. & Konings, W. N. (2000) Microbiol. Mol. Biol. Rev. 64, 672–693. [DOI] [PMC free article] [PubMed] [Google Scholar]
- 10.Hvorup, R. N., Winnen, B., Chang, A. B., Jiang, Y., Zhou, X. F. & Saier, M. H., Jr. (2003) Eur. J. Biochem. 270, 799–813. [DOI] [PubMed] [Google Scholar]
- 11.Ito, W., Ishiguro, H. & Kurosawa, Y. (1991) Gene 102, 67–70. [DOI] [PubMed] [Google Scholar]
- 12.Morimoto, R., Hayashi, M., Yatsushiro, S., Otsuka, M., Yamamoto, A. & Moriyama, Y. (2003) J. Neurochem. 84, 382–391. [DOI] [PubMed] [Google Scholar]
- 13.Tamai, I., Yabuuchi, H., Nezu, J., Sai, Y., Oku, A., Shimane, M. & Tsuji, A. (1997) FEBS Lett. 419, 107–111. [DOI] [PubMed] [Google Scholar]
- 14.Morita, Y., Kodama, K., Shiota, S., Mine, T., Kataoka, A., Mizushima, T. & Tsuchiya, T. (1998) Antimicrob. Agents Chemother. 42, 1778–1782. [DOI] [PMC free article] [PubMed] [Google Scholar]
- 15.Ullrich, K. J. (1999) Membrane Transporters as Drug Targets (Kluwer Academic/Plenum, New York).
- 16.Otsuka, M., Yasuda, M., Morita, Y., Otsuka, C., Tsuchiya, T., Omote, H. & Moriyama, Y. (2005) J. Bacteriol. 187, 1552–1558. [DOI] [PMC free article] [PubMed] [Google Scholar]
- 17.Smith, A. C., McGavran, L., Robinson, J., Waldstein, G., Macfarlane, J., Zonona, J., Reiss, J., Lahr, M., Allen, L. & Magenis, E. (1986) Am. J. Med. Genet. 24, 393–414. [DOI] [PubMed] [Google Scholar]
- 18.Bi, W., Yan, J., Stankiewicz, P., Park, S. S., Walz, K., Boerkoel, C. F., Potocki, L., Shaffer, L. G., Devriendt, K., Nowaczyk, M. J., et al. (2002) Genome Res. 12, 713–728. [DOI] [PMC free article] [PubMed] [Google Scholar]
- 19.Slager, R. E., Newton, T. L., Vlangos, C. N., Finucane, B. & Elsea, S. H. (2003) Nat. Genet. 33, 466–468. [DOI] [PubMed] [Google Scholar]
- 20.Girirajan, S., Elsas, L. J., Jr., Devriendt, K. & Elsea, S. H. (2005) J. Med. Genet. 42, 820–828. [DOI] [PMC free article] [PubMed] [Google Scholar]
- 21.Debeaujon, I., Peeters, A. J., Leon-Kloosterziel, K. M. & Koornneef, M. (2001) Plant Cell 13, 853–871. [DOI] [PMC free article] [PubMed] [Google Scholar]
- 22.Diener, A. C., Gaxiola, R. A. & Fink, G. R. (2001) Plant Cell 13, 1625–1638. [DOI] [PMC free article] [PubMed] [Google Scholar]
- 23.Nawrath, C., Heck, S., Parinthawong, N. & Metraux, J. P. (2002) Plant Cell 14, 275–286. [DOI] [PMC free article] [PubMed] [Google Scholar]
Associated Data
This section collects any data citations, data availability statements, or supplementary materials included in this article.


