

Abstract
Background
Transgenic (TG) and gene-targeted models have focused on the mouse. Fundamental differences between the mouse and human exist in Ca2+ handling during contraction/relaxation and in alterations in Ca2+ flux during heart failure, with the rabbit more accurately reflecting the human system.
Methods and Results
Cardiac troponin I (cTnI) mutations can cause familial hypertrophic cardiomyopathy. An inhibitory domain mutation, arginine146→glycine (cTnI146Gly) was modeled using TG expression in the rabbit ventricle. cTnI146Gly levels exceeding 40% of total cTnI were perinatal lethal, while replacement levels of 15–25% were well tolerated. cTnI146Gly expression led to a leftward shift in the force-pCa2+ curves with cardiomyocyte disarray, fibrosis and altered connexin43 organization. In isolated cTnI146Gly myocytes, twitch relaxation amplitudes were smaller compared to normal cells but [Ca]i transients and SR Ca2+ load were not different. Detrended Fluctuation Analysis of the QTmax intervals was used to evaluate the cardiac repolarization phase and showed a significantly higher scaling exponent in the TG animals.
Conclusions
Expression of modest amounts of cTnI146Gly led to subtle defects without severely affecting cardiac function. Aberrant connexin organization, subtle morphological deficits as well as an altered fractal pattern of the repolarization phase of TG rabbits, in the absence of entropy or other ECG abnormalities, may indicate an early developing pathology before the onset of more obvious repolarization abnormalities or major alterations in cardiac mechanics.
Keywords: cardiovascular diseases, heart diseases, hypertrophy
Introduction
Familial hypertrophic cardiomyopathy (FHC) displays an autosomal dominant mode of inheritance and a diverse genetic etiology: FHC or a phenocopy can be caused by multiple mutations in genes encoding various contractile, structural, channel and kinase proteins.1,2 Commonly, arrhythmias, particularly ventricular tachycardia and fibrillation, are associated with sudden death.3,4 The absence of multiple FHC models that faithfully recapitulate important aspects of the human disease limits our ability to explore the underlying disease mechanism(s) and develop therapeutic strategies.
Multiple mutations in the inhibitory subunit of cardiac troponin (cTnI) can cause hypertrophic cardiomyopathy (HCM).5,6 Previously, we modeled the cTnIR145G mutation (residue 146 in the human) in TG mice.7 Cardiac functional analysis revealed impaired relaxation and permeabilized cardiac muscle fiber studies showed an increase in Ca2+ sensitivity. These and other data indicate that increased myofibril Ca2+ sensitivity in the cTnI FHC mutations may play a major pathological role.8
The rabbit has advantages, compared to the mouse, for studying cardiovascular disease.9 Substantial differences exist between the mouse and human in the manner in which Ca2+ is handled during contraction/relaxation and in alterations in Ca2+ flux during heart failure, with the rabbit more accurately reflecting the human system.10,11 Human atria express α-myosin heavy chain (MHC) and the ventricles express predominantly β-MHC. The adult rabbit heart reflects this while the mouse expresses α-MHC in both the post natal atria and ventricles.12 That the mouse heart beats approximately ten times faster than the human heart is another limitation as the faster heart rate influences the refractory period associated with the occurrence of arrhythmia.13 To study the pathogenicity and presentation of an FHC cTnI mutation in the rabbit heart we generated rabbits with high and low levels of ventricle-specific expression of cTnIR146G. While high expressing lines died perinatally, a low expressing line survived and appeared outwardly normal. However, the cTnIR146G TG ventricles showed apical myocyte disarray, interstitial fibrosis and mild ventricular hypertrophy at 1.5–2 years. Increased Ca2+ sensitivity was accompanied by altered patterns of connexin deposition at the gap junctions while Detrended Fluctuation Analysis (DFA) of the QTmax intervals in these rabbits showed a higher scaling exponent.
Methods
Isolation and Construction of the Rabbit β-MHC Promoter and TG Constructs
Rabbit β-MHC sequences were obtained from a γEMBL3 genomic library. An EcoRI site was introduced into the β-MHC promoter and a polyadenylation signal placed downstream of the site (Figure 1). After insertion of the transgenes, DNA was digested free of vector sequence with NotI, purified and used to generate TG rabbits. The rabbit cTnI cDNA was isolated using RT-PCR and an arginine→glycine missense mutation at position 146 made using PCR mutagenesis. A FLAG-epitope tag was introduced at the N-terminus by PCR. A wildtype cTnI construct (cTnIWT) was also made so that TG rabbits expressing FLAG-tagged cTnI at the same levels as the mutant cTnI could serve as controls.
Figure 1.

Transgenic modulation in the rabbit heart. A, Construct organization. The promoter region was isolated and an EcoRI site introduced as a unique cloning site in the non-coding region of exon 3. A fragment containing the human growth hormone polyadenylation signal (hGH polyA) was inserted and the reporter gene cat used to measure transcriptional activity. B–D, Rabbit β-MHC promoter activity. Cardiac muscle (B), the slow skeletal diaphragm and soleus muscles (C), and other muscle and non muscle tissues were examined (D). E, Embryonic day 10 shows staining in the ventricle and outflow tract as well as minor staining in the atrium. A; atrium, V; ventricle, OT; outflow tract. F, G, Immunohistochemistry showed no signal in the NTG ventricle (F) and uniform CAT staining in the TG apex (G). Tissues were derived from 5 week animals (n=3–4). LV, left ventricle; RV, right ventricle; Latr, left atria; Ratr, right atria; Dia, diaphragm; Sol, soleus muscle; Bic, biceps muscle; Tibi, tibial muscle; Mas, masseter muscle; Ton, tongue; Sto, stomach; S.In, small intestine; Lun, lung; Liv, liver; Sple, spleen.
Isolated Cardiomyocytes
Isolated myocytes were loaded with Indo-1 or Fluo-3, bathed in normal Tyrode solution with 2–2.5 mM/L Ca2+ and stimulated at 0.5 Hz. Twitch fluorescence transients were recorded with a microscope-based photometer and converted to [Ca]i using standard methods.14 Contraction was recorded by video edge detection and expressed as the fractional change in resting cell length. Caffeine (10 mM/L) was applied to some cells to measure SR Ca2+ loading and allow analysis of Ca2+ fluxes contributing to Ca2+ transient decay.15 Comparisons were based on data from 8–33 cells from 5 rabbits of either genotype. The significance level for differences of means was P≤0.05.
Detrended Fluctuation Analysis (DFA) of the QTmax Intervals
Four TG and four NTG rabbits at approximately 21 months were used. The digital ECGs were obtained over 5 minutes duration and the QTmax intervals (onset of QRS to T wave peak) and R-R intervals measured. Uncorrected heart rate values of QTmax intervals were used for the analysis of repolarization variability assessment.16 DFA and the entropy of the QTmax intervals using approximate and sample entropy methods were also evaluated. The data were analyzed by these nonlinear methods in order to assess possible abnormal changes of the heart rate dynamics. The standard deviation (SD) of QTmax (QTmax−SD) and the square root of the mean squared differences of successive repolarization intervals (QTmax−RMSSD) were calculated using standard methods of variability analysis.
Miscellaneous Methods
Myofibrillar sample preparation, gel preparation, electrophoretic conditions, and gel staining have been described.17 Western analyses were performed using anti-TnI, anti-GAPDH (Chemicon International, CA), anti-FLAG (Sigma, MI), anti-connexin43 (Zymed Laboratories Inc, CA), and [Ser 368] anti-phospho-connexin43 (Cell Signaling Technologies, MA). Immunohistochemistry and fiber isolation and analyses have been described.18 Quantitative analysis of interstitial fibrosis was measured in formalin-fixed and paraffin-embedded tissue sections using Sirius red F3BA and Fast green FCF.19 After the dye was eluted from the tissue sections, the absorbance at 540 and 605 nm were determined for Sirius red F3BA and Fast green FCF binding protein, respectively.
Results
Ventricle-restricted Transgenic Expression in the Rabbit
Previous transgenic studies affecting the rabbit heart’s protein complement used the mouse β-MHC promoter.9,20 While the mouse promoter does show striated muscle specific expression, it does not completely mimic endogenous β-MHC expression in the rabbit.20 Therefore, we isolated and tested the rabbit β-MHC promoter in an attempt to drive high levels of transgene expression in the rabbit ventricle. The basic promoter construct consists of approximately 6000 bp of sequence upstream of the transcriptional start site, as well as the exons that encode the 5′ untranslated region. A polyadenylation signaling sequence, derived from the human growth hormone gene, is inserted downstream of the unique EcoRI restriction enzyme site, into which the various transgenes can be inserted (Figure 1A). In preliminary experiments, the gene encoding chloramphenicol acetyltransferase was used to titrate promoter activity. Multiple lines were generated and chloramphenicol acetyltransferase expression (CAT) determined. The promoter drove high levels of expression in all regions of the ventricle in a copy number dependent manner as well as in muscles containing slow type fibers (Figure 1B–D). In the atria, no expression was detected in three lines and only very low expression in one line showing high copy numbers (428H, 39 copies), suggesting that the rabbit β-MHC promoter drives predominantly ventricular specific transcription, mimicking endogenous expression. Expression was stable throughout the juvenile and adult periods and the expression patterns were conserved across multiple lines (data not shown). CAT expression was also determined during embryogenesis. At embryonic day 10, robust expression occurred in the ventricle and outflow tract, with relatively low levels of expression in the atria (Figure 1E), a pattern consistent with endogenous promoter activity in the mouse21 and rabbit (James and Robbins, unpublished data). To determine homogeneity of CAT expression in the post-birth ventricle, in situ immunohistochemistry was performed on different regions. Transgene expression was homogenous throughout (Figure 1F, G) and the data show that the rabbit β-MHC promoter efficiently drives ventricular-restricted and slow type skeletal muscle transgene expression.
Cardiac TnIR146G Transgenic Expression
We used the rabbit β-MHC promoter to create rabbits in which cTnI was partially replaced by either cTnIR146G or cTnIWT in the ventricle (Figure 2A). Three cTnIR146G TG founders and one cTnIWT TG line were generated. In lines 52 and 71, with copy numbers of 5 and 4 respectively, the mutant protein accounted for greater than 50% of total cTnI by the neonatal stage (Figure 2C). As described by us and others for both cTnI and other contractile proteins, increases observed at the RNA level are not translated into absolute increases of protein.7,22 Rather, endogenous protein levels are reduced such that contractile protein stoichiometry is conserved, resulting in replacement of the endogenous protein with the transgenically encoded species (Figure 2B).23 In both lines, death occurred within one week after birth. No obvious phenotype presented in the cTnIWT line, in which the TG protein replaced 64% of the endogenous cTnI (Figure 2C) indicating that TG expression of cTnI, by itself was not lethal. At the time of death, the pups from both lines 52 and 71 showed symptoms consistent with heart failure and electron microscopy confirmed major sarcomere disruption and contractures (data not shown). Premature death was also observed in the severely affected cTnIR146G TG mice,7 confirming that greater than 40–50% replacement with cTnIR146G is lethal.
Figure 2.

cTnIR146G protein levels in TG rabbit hearts at 6 months. A, TG constructs for expressing either wild type (WT) cTnI or cTnIR146G. B, Conservation of overall cTnI and sarcomeric protein levels in the TG animals. Shown is a PAGE analysis that compares the NTG and line 51 sarcomeric proteins. As expected from previous experiments with cardiac specific expression of the sarcomeric proteins,7,23 the absolute levels are conserved. Line 15 ( cTnIWT) proteins were indistinguishable as well (data not shown). C, Three cTnIR146G lines (lines 51, 52 and 71) and one WT line (line 15) expressed high levels of TG protein. The degree of replacement at the neonatal stage is shown. D, E, At 6 months in line 51 cTnIR146G made up approximately 28% of the total cTnI complement. E, Equal amounts of cTnIR146G were detected in both the LV and RV.
Line 51, with a copy number of 2 and protein replacement of 28% (Figure 2C, D) was asymptomatic. Mutant protein levels were maintained equally in both adult ventricles (Figure 2E). In the young adults, no obvious cardiac remodeling occurred (Table 1) nor were there any histological abnormalities (data not shown). However, by 18 months, there was significant fibrosis in the septum and apex and isolated areas of myocyte disarray (Figure 3), while no abnormalities could be detected in either the NTG or cTnIWT transgenic hearts. Interestingly, histological abnormalities were only detected in focal areas of the ventricle despite a uniform mutant protein distribution. Echocardiography detected a slight but significant increase in LV wall thickness, as well as increased septal thickness and improved fractional shortening (Table 2).
TABLE 1.
Tissue Weights and Hemodynamic Parameters
| BW (kg) | LA/BW (g/kg) | RA/BW (g/kg) | LV/BW (g/kg) | RV/BW (g/kg) | HR (bpm) | LVSP (mmHg) | LVEDP (mmHg) | +dP/dtmax (mmHgsec−1) | −dP/dtmin (mmHgsec−1) | |
|---|---|---|---|---|---|---|---|---|---|---|
| NTG | 3.1 ± 0.1 | 0.09 ± 0.01 | 0.07 ± 0.01 | 1.36 ± 0.09 | 0.34 ± 0.04 | 234 ± 32 | 76 ± 12 | 6 ± 1 | 2119 ± 246 | 2181 ± 177 |
| TG | 3.4 ± 0.2 | 0.10 ± 0.01 | 0.07 ± 0.01 | 1.19 ± 0.04 | 0.31 ± 0.02 | 248 ± 14 | 69 ± 6 | 5 ± 2 | 2396 ± 206 | 2119 ± 249 |
Values are mean ± SEM. n=8 (groups contain 3–4 males and 3–4 females at 6 months). BW, body weight; LA, left atria; RA, right atria; LV, left ventricle; RV, right ventricle. LVSP, left ventricular systolic pressure: LVEDP, left ventricular end-diastolic pressure.
Figure 3.

A, Apical and septal sections from 18 month NTG, cTnIWT (WT) and cTnIR146G (R146G) hearts. Sections were stained with Masson’s trichrome. Scale bar = 125μm. B, Interstitial fibrosis was quantitated using Sirius red F3BA and Fast green FCF as described in Methods. LV, left ventricle; Sep, septum; RV, right ventricle. *P<0.05 vs. NTG.
TABLE 2.
Echocardiographic Parameters
| BW (kg) | Septum (cm) | Septum/BW (cm/kg) | PW (cm) | PW/BW (cm/kg) | LVED (cm) | LVED/BW (cm/kg) | LVES (cm) | LVES/BW (cm/kg) | SF (%) | LV mass/BW (gm/kg) | |
|---|---|---|---|---|---|---|---|---|---|---|---|
| NTG | 4.4 ± 0.4 | 0.29 ± 0.01 | 68.4 ± 3.8 | 0.28 ± 0.01 | 65.4 ± 3.7 | 1.33 ± 0.02 | 0.31 ± 0.02 | 0.86 ± 0.02 | 0.19 ± 0.01 | 34.9 ± 1.3 | 1.03 ± 0.05 |
| TG | 4.1 ± 0.2 | 0.35 ± 0.01*** | 83.6 ± 2.0** | 0.30 ± 0.01 | 72.8 ± 1.6* | 1.36 ± 0.04 | 0.33 ± 0.01 | 0.79 ± 0.03 | 0.2 ± 0.01 | 41.8 ±0.9 *** | 1.26 ± 0.05** |
Groups consist of 2 year males. Values are mean ± SEM. n=3. BW, body weight; Septum, septal wall thickness; PW, posterior wall thickness; LVED, left ventricular end-diastolic dimension; LVES, left ventricular end-systolic dimension; SF, shortening fraction; LV mass, left ventricular mass.
P<0.05,
P<0.01,
P<0.001
Fiber and Cardiomyocyte Studies
In the cTnIR146G TG mice, functional analyses revealed impaired relaxation and fiber studies showed an increase in Ca2+ sensitivity.7 In vitro reconstitution experiments have shown that FHC cTnI mutations (cTnIR146G and cTnIR162W) resulted in reduced inhibition of myosin ATPase by the troponin complex and increased Ca2+ sensitivity of actin-tropomyosin-activated myosin ATPase activity.8 To determine the effect of cTnIR146G on the development of force, we generated force-pCa2+ curves using permeabilized muscle fibers. To obtain a dose response, neonatal fibers were used, as line 52, in which 55% replacement was obtained, died between 5–9 days after birth. Prior to the development of overt heart failure in this line, fibers were isolated from the LV papillary muscles and compared with fibers derived from line 51 (28% replacement) and NTG animals. A marked leftward shift of the force-pCa2+ curve was observed in line 52 and a slight leftward shift was seen in line 51 (Figure 4), indicating that the mutant protein affected myofibrillar Ca2+ sensitivity in a dose dependent but non linear manner.
Figure 4.
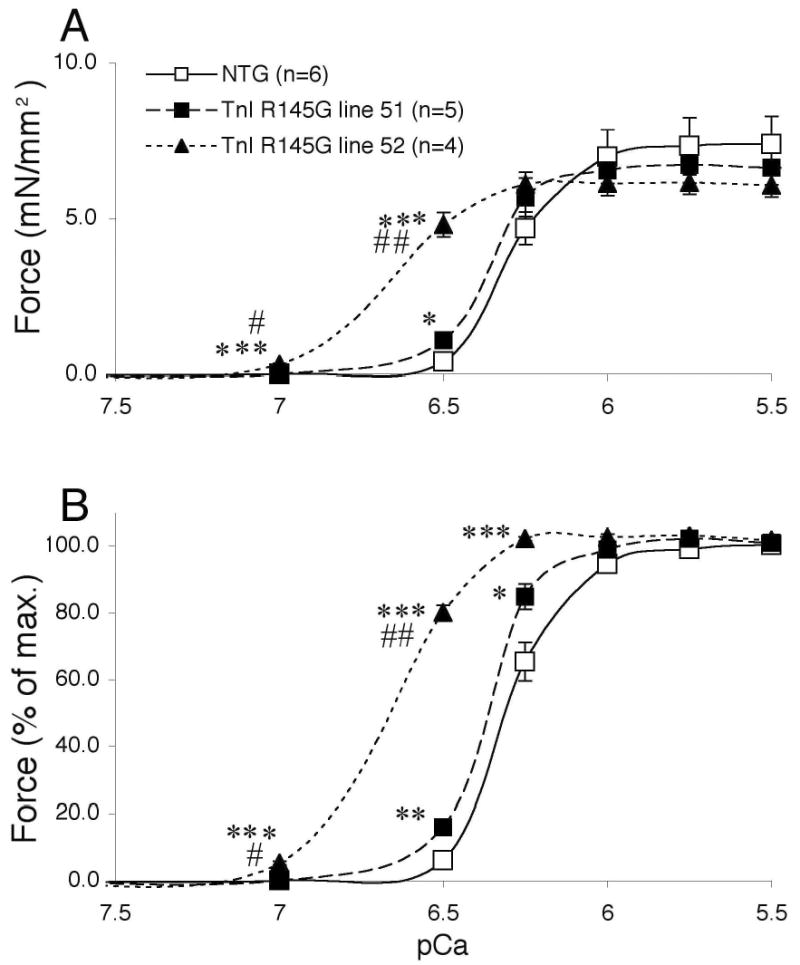
Force-pCa2+ curves of skinned fibers from ventricular papillary muscle. A, Force and B, normalized force were graphed. The ventricular skinned fibers were obtained from neonatal left ventricular trabeculae. Data were analyzed by one way ANOVA. No alterations in maximum shortening velocity were observed (data not shown). *P<0.05 vs. NTG, **P<0.01 vs. NTG, ***P<0.001, #P<0.05 vs. line 51 and ##P<0.01 vs. line 51.
Despite the changes in Ca2+ sensitivity, functional parameters determined by cardiac catheterization were conserved at 6 months (Table 1) with modestly enhanced cardiac function apparent by 2 years (Table 2). These increases are consistent with the data obtained in the cTnIR146G TG mice as well as in vitro reconstitution studies.7,8 At the whole organ level it appears that increased Ca2+ sensitivity results in modest increases in cardiac function, mild hypertrophy and focal cardiomyocyte abnormalities.
Data that bear directly on the effect(s) that changes in cTnI have on isolated cardiomyocytes are limited although recent data suggest that, in principle, one should be able to detect alterations in myofilament sensitivity in isolated myocyte experiments.24 Isolated cardiomyocytes were therefore derived from NTG and TG cTnIR146G hearts. Figure 5A shows [Ca]i transients followed by a caffeine-induced Ca2+ transient in a TG myocyte. Peak fractional shortening was not different but there was a trend toward larger [Ca]i transient amplitude in the TG cells (Figure 5B). These relative amplitudes did not give any indication of increased myofilament Ca2+ sensitivity despite the results in skinned fibers. Twitch relaxation kinetics were unaltered while [Ca]i decline was slightly faster in the TG myocytes (Figure 5C). From caffeine-induced Ca2+ transients we inferred that SR Ca2+ loading was not different between TG and NTG (Figure 5D). However, [Ca]i decline was faster in TG cells, indicative of greater Na/Ca2+ exchange (NCX) function in the TG rabbits (Figure 5D). The apparently faster NCX rate may partly explain the faster twitch [Ca]i decline (Figure 5C). [Ca]i transients and contraction were also measured with [Ca]o = 1 mM or 5 mM, and at different frequencies (0.2, 0.5 and 1 Hz) with similar trends. The expected Ca2+ and frequency effects on amplitude and kinetics of the Ca2+ transient and contraction did not differ between the two groups (data not shown).
Figure 5.

Isolated myocyte studies. A, twitch Ca transients and a caffeine-induced Ca2+ transient in a TG myocyte. B, Mean data for twitch parameters at 0.5 Hz steady state are shown for amplitudes of contraction (as % of resting cell length, rcl) and Ca2+ transient (as Δ[Ca]i). C, Kinetics of relaxation half time (t1/2) and time constant (τ) of [Ca]i decline. D, Caffeine-induced Ca2+ transients were analyzed to infer sarcoplasmic reticulum Ca2+ load and NCX function, which is the primary mechanism responsible for the rate of [Ca]i decline in the presence of caffeine.14 *P<0.05 based on Student’s t test, #P<0.05 based on Mann-Whitney test.
We reasoned that despite no increase in mortality or overt presentation of disease, the visible areas of myocyte disarray might lead to subtle alterations in the gap junctions and electrophysiology of the hearts. Connexin43 (Cx43), is the major component of the ventricular gap junction.25 Changes in subcellular distribution or structural remodeling have been correlated with cardiomyocytes in distress, disarray, border infarct zones, acute responses to injury or with the initial stages of compensated hypertrophy.26,27 Absolute levels of Cx43 were significantly increased at 21 months, but their organization at the gap junction was compromised in the cTnIR146G ventricles (Figure 6A, B). Cx43 phosphorylation results in a reduction in gap-junctional intercellular communication28 and we noted that phospho-Cx43 levels were also significantly elevated (Figure 6E). Elevated levels of Cx43 and phospho-Cx43 were found throughout the heart despite the focal pattern of interstitial fibrosis and myocyte disarray, which were largely restricted to the apical and septal regions. Although Cx43 heterogeneity of expression as well as the absolute levels may predispose the heart to arrhythmias26 and increases observed in Cx43 phosphorylation can lead to impaired intracellular conduction,29 ECG studies were inconclusive with no abnormalities presenting (Figure 6C, D). In order to increase the resolution of the study, the cardiac repolarization phase of the digitized ECGs were subjected to Detrended Fluctuation Analysis (Figure 6F). The QTmax interval was significantly higher in the cTnIR146G rabbits compared to the NTG group.
Figure 6.
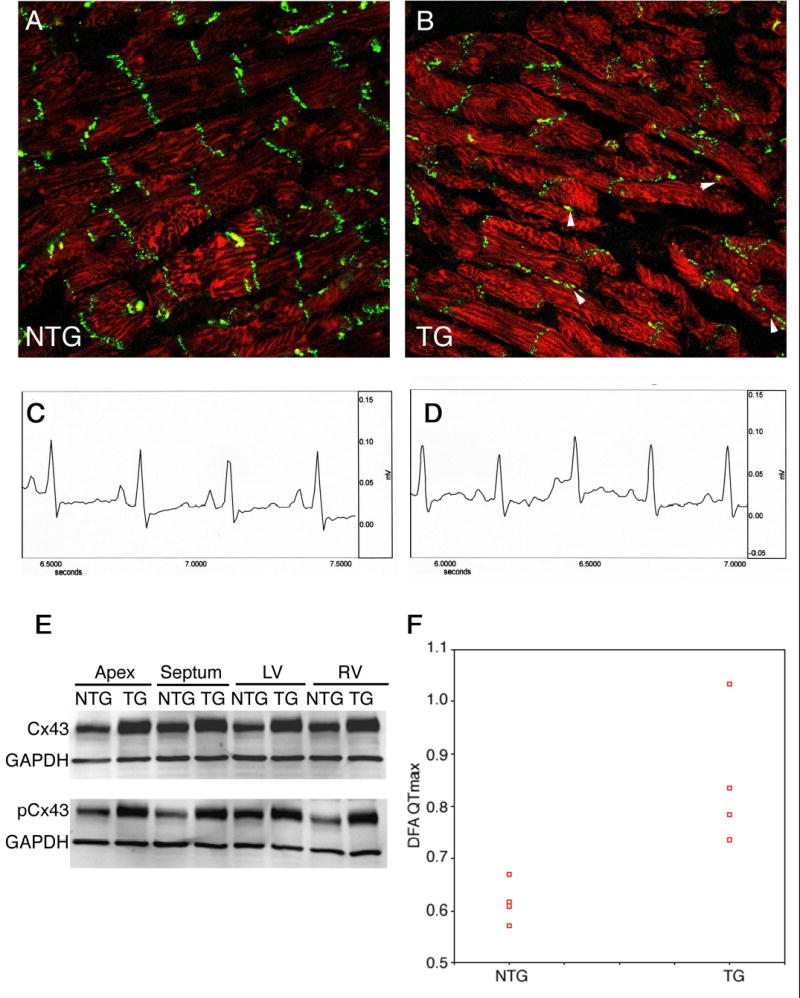
Cx43 expression and phosphorylation. A, B, patterns of Cx43 localization in sections derived from the NTG and 6 month cTnIR146G hearts. Arrowheads; regions of aberrant accumulation of Cx43. C, D, Representative electrocardiograms. Lead I tracing from an NTG and line 51 rabbit, respectively. The time and voltage scales are indicated. E, Western blots of cardiac samples derived from 21 month cTnIR146G and NTG rabbits. Both total and phospho-Cx43 were elevated in the cTnIR146G hearts. The broadening of the TG bands in the top panel is due to the retarded migration of the phosphorylated species, which, if small amounts of protein are electrophoresed, can be resolved from the nonphosphorylated species. F, Detrended fluctuation analysis in the NTG and TG rabbits. DFA of NTG and TG groups was used to quantify the fractal correlation properties of the R-R interval data. This method is a modified root mean square analysis of a random walk. (α = 0.85 ± 0.13, α = 0.62 ± 0.04, respectively, P = 0.015)
Discussion
Patients suffering from FHC as a result of mutations in cTnI are often asymptomatic with the disease being diagnosed only after sudden death occurs. Previously, we constructed cTnIR146G TG mice that, while displaying increased Ca2+ sensitivity never showed hypertrophy or cellular pathology, except in parous females.7 This lack of pathology, even at high replacement levels, is significantly different from the rabbit model as the 2 year aged TG rabbit population that had only 25% replacement displayed significant levels of interstitial fibrosis and focal areas of myocyte disarray as well as the prolongation of the QTmax interval and alterations in Cx43 distribution and phosphorylation. Indeed, rabbits that exhibited replacement levels of 40%, which approached those obtained in the mouse, did not survive past the perinatal period. The relative strengths of the rabbit versus the mouse for studying cardiovascular disease have been discussed above and in other studies.9,20,30,31 Major weaknesses of the rabbit revolve around the time it takes to raise the animals and the innate costs of dealing with a larger animal model. The mouse and rabbit models are compared in Table 3. The data suggest that the rabbit model more closely resembles the human disease relative to the mouse and, considering the cellular pathology and early mortality that distinguishes the two models, may provide a unique tool to investigate the pathogenic mechanisms and evaluate potential therapies.
TABLE 3.
Comparison between the Mouse and Rabbit cTnI Models
| Parameter | TG mouse (line 121)7 | TG rabbit (line 51) |
|---|---|---|
| Protein replacement (%) | 40% | 25% |
| Hypertrophy | No hypertrophy | Slight hypertrophy by 18 months |
| Pathology | No pathology or early mortality, although parous females showed cardiomyocyte hypoxia | Fibrosis and myocyte disarray in the apical and septal regions by 18 months; perinatal mortality in lines with high replacement |
| Cardiac function | +dP/dt is increased and −dP/dt is decreased in a working heart preparation | No physiologically significant changes |
| Ca2+ sensitivity | Increased | Increased |
| EKG | Normal | Normal |
The extent of expression and incorporation of mutant cTnI’s in human cardiomyocytes is not known, although presumably most patients have one mutant allele.5 A recent study using isolated adult rat ventricular myocytes suggested that incorporation of cTnIR146G differed significantly from that of the normal protein. Maximum protein replacement of endogenous cTnI with normal cTnI reached approximately 85% with significantly less replacement (approximately 43%) achieved when cTnIR146G was expressed.32 These results suggest that the capacity of myocytes to express and incorporate cTnIR146G into the sarcomere is significantly impaired compared with normal cTnI. This may be due either to mutant protein instability or to a reduced ability of cTnIR146G, relative to cTnI, to incorporate into myofilaments. Consistent with this hypothesis, an FHC-mutant β-MHC in the soleus represented only 12–23% of the beta myosin.33 The rabbit data shows non viability in lines 52 and 71, where replacement reached 50% and it appears that, for this isoform in the rabbit, 50% replacement is not compatible with life.
The mutation’s lethality in the TG rabbits is clearly dependent upon the degree of replacement by the mutant protein. However, the relationship is not linear but rather exhibits a threshold effect. If the mutant protein is incorporated at more than 50% of the total cTnI, the muscle fibers exhibit a marked increase in Ca2+ sensitivity and all of the F1 rabbits die between 5–7 days after birth. In contrast, line 51, with 28% replacement, shows only a slight increase in muscle fiber Ca2+ sensitivity and no lethality. In vitro reconstitution studies with mixtures of wild type and mutant cTnI’s show that the effects on Ca2+ sensitivity and in vitro motility is complex and non linear.34,35 The data have been interpreted to mean that wild type cTnI can compensate up to a point for the mutant’s compromised ATPase inhibitory ability.35 This consideration and the biphasic nature of the transition observed with mixtures of different cTnI’s emphasize the nonlinearity of the response. This is consistent with the rabbit data, where a relatively mild phenotype is observed in line 51 compared with the other TG lines (52 and 71), as well as with our previous data from the TG mice.7 Although the exact degree of replacement by the mutant protein in FHC patients is unknown, our results may help to explain the underlying mechanism as to why patients with HCM linked to this specific cTnI mutation have a relatively mild phenotype with elderly onset penetration35,36 and show that the limits of substitution tolerated lie below 50%.
The histological and morphological alterations observed in the mutant TG rabbits were asymmetric and progressive. Since rabbit β-MHC promoter activity is relatively uniform in the heart (Figure 1), heterogeneous localization of the mutant protein is an unlikely explanation for the focal defects. The mechanism responsible for the heterogeneity of pathology is unknown. One possible explanation is an increase in contractility, as reflected by a slight enhancement of fractional shortening. Slight, but sustained alterations in regional contractility may compromise myocardial blood flow, triggering regional ischemia and/or hypoxia, which can cause histological and morphological alterations.3,4 As an example, Cx43’s cellular localization as well as its phosphorylation status are responsive to environmental factors; thus, abnormal cardiac function may trigger a focally restricted abnormal pattern of Cx43 expression or post-translational modification.37
The expected increase in myofibril Ca2+ sensitivity as a result of mutant cTnI expression was confirmed in the intact fibers and could play a major role in the induction of the cardiac FHC phenotype. However, the myocyte data (Figure 5) indicate no enhancement of myofilament Ca2+ responsiveness, contrary to our expectation based on the steady state skinned fiber experiments. Indeed, there was a slight tendency in the reverse direction (i.e. reduced sensitivity). This may be a result of the dynamic interplay between Ca2+ binding to the myofilaments and the influence of other cytosolic Ca2+ buffers. Additionally, the sarcomeres are loaded in the fibers whereas the isolated cardiomyocytes constitute an unloaded system and thus, the two preparations are at different points on the length-dependent activation curve. We were not able to detect alterations in either the amounts or phosphorylation patterns of the proteins responsible for Ca2+ handling such as phospholamban or SERCA2a and NCX levels were also unaffected (data not shown).
Histological and morphological alterations such as interstitial fibrosis, myocyte disarray and cardiac hypertrophy can also be arrhythmogenic.3 However, although significant fibrosis could be detected by 18 months (Figure 3), areas of disarray, although apparent, were not widespread. Similarly, although there were spatial changes of Cx43 expression and alterations in the absolute levels of phosphorylated Cx43 in the cTnIR146G rabbits, it is doubtful that these are directly arrhythmogenic and we were unable to detect the presence of malignant ventricular tachyarrhythmia in conscious 2 year cTnIR146G TG rabbits via continuous EKG monitoring. However, DFA, a more sensitive analytical modality, revealed statistically significant alterations in the QTmax intervals (Figure 6F). In cTnIR146G rabbits, the higher α1 parameter compared to the control group may be an early pathologic sign before more obvious ECG changes in repolarization occur. The higher α1 value reflects an altered temporal fractal organization pattern of the QTmax interval. Fractal methods analyze the self-similar fluctuations on multiple different orders of temporal magnitude. Therefore, the TG rabbits demonstrated a more pronounced self-similarity of their repolarization phase, showing an altered pattern compared to NTG rabbits. The clear separation of the study group from the control group with DFA was a reinforcing finding of altered fractal organization pattern. The altered fractal organization pattern with an increased α value, in the absence of entropy or other ECG abnormalities, has been interpreted as a significant sign for a pathologic change in the repolarization phase before the onset of more obvious abnormalities.38 As the TG rabbits age, it will be of interest to monitor them for ventricular tachyarrhythmias.
Acknowledgments
This study was supported by grants from the NIH (JR) and by a Beginning Grant-in-Aid from the American Heart Association (AS).
References
- 1.Marian AJ, Roberts R. The molecular genetic basis for hypertrophic cardiomyopathy. J Mol Cell Cardiol. 2001;33:655–670. doi: 10.1006/jmcc.2001.1340. [DOI] [PMC free article] [PubMed] [Google Scholar]
- 2.Hernandez OM, Housmans PR, Potter JD. Invited Review: pathophysiology of cardiac muscle contraction and relaxation as a result of alterations in thin filament regulation. J Appl Physiol. 2001;90:1125–1136. doi: 10.1152/jappl.2001.90.3.1125. [DOI] [PubMed] [Google Scholar]
- 3.Maron BJ, Bonow RO, Cannon RO, 3rd, Leon MB, Epstein SE. Hypertrophic cardiomyopathy. Interrelations of clinical manifestations, pathophysiology, and therapy (1) N Engl J Med. 1987;316:780–789. doi: 10.1056/NEJM198703263161305. [DOI] [PubMed] [Google Scholar]
- 4.Maron BJ, Bonow RO, Cannon RO, 3rd, Leon MB, Epstein SE. Hypertrophic cardiomyopathy. Interrelations of clinical manifestations, pathophysiology, and therapy (2) N Engl J Med. 1987;316:844–852. doi: 10.1056/NEJM198704023161405. [DOI] [PubMed] [Google Scholar]
- 5.Kimura A, Harada H, Park JE, Nishi H, Satoh M, Takahashi M, Hiroi S, Sasaoka T, Ohbuchi N, Nakamura T, Koyanagi T, Hwang TH, Choo JA, Chung KS, Hasegawa A, Nagai R, Okazaki O, Nakamura H, Matsuzaki M, Sakamoto T, Toshima H, Koga Y, Imaizumi T, Sasazuki T. Mutations in the cardiac troponin I gene associated with hypertrophic cardiomyopathy. Nat Genet. 1997;16:379–382. doi: 10.1038/ng0897-379. [DOI] [PubMed] [Google Scholar]
- 6.Morner S, Richard P, Kazzam E, Hainque B, Schwartz K, Waldenstrom A. Deletion in the cardiac troponin I gene in a family from northern Sweden with hypertrophic cardiomyopathy. J Mol Cell Cardiol. 2000;32:521–525. doi: 10.1006/jmcc.1999.1099. [DOI] [PubMed] [Google Scholar]
- 7.James J, Zhang Y, Osinska H, Sanbe A, Klevitsky R, Hewett TE, Robbins J. Transgenic modeling of a cardiac troponin I mutation linked to familial hypertrophic cardiomyopathy. Circ Res. 2000;87:805–811. doi: 10.1161/01.res.87.9.805. [DOI] [PubMed] [Google Scholar]
- 8.Takahashi-Yanaga F, Morimoto S, Harada K, Minakami R, Shiraishi F, Ohta M, Lu QW, Sasaguri T, Ohtsuki I. Functional consequences of the mutations in human cardiac troponin I gene found in familial hypertrophic cardiomyopathy. J Mol Cell Cardiol. 2001;33:2095–2107. doi: 10.1006/jmcc.2001.1473. [DOI] [PubMed] [Google Scholar]
- 9.Marian AJ, Wu Y, Lim DS, McCluggage M, Youker K, Yu QT, Brugada R, DeMayo F, Quinones M, Roberts R. A transgenic rabbit model for human hypertrophic cardiomyopathy. J Clin Invest. 1999;104:1683–1692. doi: 10.1172/JCI7956. [DOI] [PMC free article] [PubMed] [Google Scholar]
- 10.Bers DM. Cardiac Na/Ca exchange function in rabbit, mouse and man: what’s the difference? J Mol Cell Cardiol. 2002;34:369–373. doi: 10.1006/jmcc.2002.1530. [DOI] [PubMed] [Google Scholar]
- 11.Bers DM. Cardiac excitation-contraction coupling. Nature. 2002;415:198–205. doi: 10.1038/415198a. [DOI] [PubMed] [Google Scholar]
- 12.Everett AW, Clark WA, Chizzonite RA, Zak R. Change in synthesis rates of alpha- and beta-myosin heavy chains in rabbit heart after treatment with thyroid hormone. J Biol Chem. 1983;258:2421–2425. [PubMed] [Google Scholar]
- 13.Boyett MR, Jewell BR. A study of the factors responsible for rate-dependent shortening of the action potential in mammalian ventricular muscle. J Physiol. 1978;285:359–380. doi: 10.1113/jphysiol.1978.sp012576. [DOI] [PMC free article] [PubMed] [Google Scholar]
- 14.Ginsburg KS, Bers DM. Modulation of excitation-contraction coupling by isoproterenol in cardiomyocytes with controlled SR Ca2+ load and Ca2+ current trigger. J Physiol. 2004;556:463–480. doi: 10.1113/jphysiol.2003.055384. [DOI] [PMC free article] [PubMed] [Google Scholar]
- 15.Bassani JW, Bassani RA, Bers DM. Relaxation in rabbit and rat cardiac cells: species-dependent differences in cellular mechanisms. J Physiol. 1994;476:279–293. doi: 10.1113/jphysiol.1994.sp020130. [DOI] [PMC free article] [PubMed] [Google Scholar]
- 16.Perkiomaki JS, Couderc JP, Daubert JP, Zareba W. Temporal complexity of repolarization and mortality in patients with implantable cardioverter defibrillators. Pacing Clin Electrophysiol. 2003;26:1931–1936. doi: 10.1046/j.1460-9592.2003.00298.x. [DOI] [PubMed] [Google Scholar]
- 17.Sanbe A, Fewell JG, Gulick J, Osinska H, Lorenz J, Hall DG, Murray LA, Kimball TR, Witt SA, Robbins J. Abnormal cardiac structure and function in mice expressing nonphosphorylatable cardiac regulatory myosin light chain 2. J Biol Chem. 1999;274:21085–21094. doi: 10.1074/jbc.274.30.21085. [DOI] [PubMed] [Google Scholar]
- 18.Sanbe A, Gulick J, Hanks MC, Liang Q, Osinska H, Robbins J. Reengineering inducible cardiac-specific transgenesis with an attenuated myosin heavy chain promoter. Circ Res. 2003;92:609–616. doi: 10.1161/01.RES.0000065442.64694.9F. [DOI] [PubMed] [Google Scholar]
- 19.Chiu YT, Liu SK, Liu M, Chen SP, Lin YH, Mao SJ, Chu R. Characterization and quantitation of extracellular collagen matrix in myocardium of pigs with spontaneously occurring hypertrophic cardiomyopathy. Cardiovasc Pathol. 1999;8:169–175. doi: 10.1016/s1054-8807(98)00031-3. [DOI] [PubMed] [Google Scholar]
- 20.James J, Sanbe A, Yager K, Martin L, Klevitsky R, Robbins J. Genetic manipulation of the rabbit heart via transgenesis. Circulation. 2000;101:1715–1721. doi: 10.1161/01.cir.101.14.1715. [DOI] [PubMed] [Google Scholar]
- 21.Knotts S, Sanchez A, Rindt H, Robbins J. Developmental modulation of a β myosin heavy chain promoter-driven transgene. Developmental dynamics. 1996;206:182–192. doi: 10.1002/(SICI)1097-0177(199606)206:2<182::AID-AJA7>3.0.CO;2-E. [DOI] [PubMed] [Google Scholar]
- 22.Fewell JG, Hewett TE, Sanbe A, Klevitsky R, Hayes E, Warshaw D, Maughan D, Robbins J. Functional significance of cardiac myosin essential light chain isoform switching in transgenic mice. J Clin Invest. 1998;101:2630–2639. doi: 10.1172/JCI2825. [DOI] [PMC free article] [PubMed] [Google Scholar]
- 23.Sanbe A, Gulick J, Hayes E, Warshaw D, Osinska H, Chan CB, Klevitsky R, Robbins J. Myosin light chain replacement in the heart. Am J Physiol Heart Circ Physiol. 2000;279:H1355–1364. doi: 10.1152/ajpheart.2000.279.3.H1355. [DOI] [PubMed] [Google Scholar]
- 24.Layland J, Grieve DJ, Cave AC, Sparks E, Solaro RJ, Shah AM. Essential role of troponin I in the positive inotropic response to isoprenaline in mouse hearts contracting auxotonically. J Physiol. 2004;556:835–847. doi: 10.1113/jphysiol.2004.061176. [DOI] [PMC free article] [PubMed] [Google Scholar]
- 25.Severs NJ. Cardiac muscle cell interaction: from microanatomy to the molecular make-up of the gap junction. Histol Histopathol. 1995;10:481–501. [PubMed] [Google Scholar]
- 26.Severs NJ, Coppen SR, Dupont E, Yeh HI, Ko YS, Matsushita T. Gap junction alterations in human cardiac disease. Cardiovasc Res. 2004;62:368–377. doi: 10.1016/j.cardiores.2003.12.007. [DOI] [PubMed] [Google Scholar]
- 27.Peters NS. New insights into myocardial arrhythmogenesis: distribution of gap-junctional coupling in normal, ischaemic and hypertrophied human hearts. Clin Sci (Lond) 1996;90:447–452. doi: 10.1042/cs0900447. [DOI] [PubMed] [Google Scholar]
- 28.Ogawa T, Hayashi T, Kyoizumi S, Kusunoki Y, Nakachi K, MacPhee DG, Trosko JE, Kataoka K, Yorioka N. Anisomycin downregulates gap-junctional intercellular communication via the p38 MAP-kinase pathway. J Cell Sci. 2004;117:2087–2096. doi: 10.1242/jcs.01056. [DOI] [PubMed] [Google Scholar]
- 29.Moreno AP, Saez JC, Fishman GI, Spray DC. Human connexin43 gap junction channels. Regulation of unitary conductances by phosphorylation. Circ Res. 1994;74:1050–1057. doi: 10.1161/01.res.74.6.1050. [DOI] [PubMed] [Google Scholar]
- 30.Patel R, Nagueh SF, Tsybouleva N, Abdellatif M, Lutucuta S, Kopelen HA, Quinones MA, Zoghbi WA, Entman ML, Roberts R, Marian AJ. Simvastatin induces regression of cardiac hypertrophy and fibrosis and improves cardiac function in a transgenic rabbit model of human hypertrophic cardiomyopathy. Circulation. 2001;104:317–324. doi: 10.1161/hc2801.094031. [DOI] [PMC free article] [PubMed] [Google Scholar]
- 31.Sanbe A, Gulick JD, Martin L, Yager K, Robbins J. Construction and characterization of cardiac specific promoters for rabbit transgenesis. Circulation. 2000;102:212–218. [Google Scholar]
- 32.Westfall MV, Borton AR, Albayya FP, Metzger JM. Myofilament calcium sensitivity and cardiac disease: insights from troponin I isoforms and mutants. Circ Res. 2002;91:525–531. doi: 10.1161/01.res.0000034710.46739.c0. [DOI] [PubMed] [Google Scholar]
- 33.Nier V, Schultz I, Brenner B, Forssmann W, Raida M. Variability in the ratio of mutant to wildtype myosin heavy chain present in the soleus muscle of patients with familial hypertrophic cardiomyopathy. A new approach for the quantification of mutant to wildtype protein. FEBS Lett. 1999;461:246–252. doi: 10.1016/s0014-5793(99)01433-7. [DOI] [PubMed] [Google Scholar]
- 34.Redwood C, Lohmann K, Bing W, Esposito GM, Elliott K, Abdulrazzak H, Knott A, Purcell I, Marston S, Watkins H. Investigation of a truncated cardiac troponin T that causes familial hypertrophic cardiomyopathy: Ca(2+) regulatory properties of reconstituted thin filaments depend on the ratio of mutant to wild-type protein. Circ Res. 2000;86:1146–1152. doi: 10.1161/01.res.86.11.1146. [DOI] [PubMed] [Google Scholar]
- 35.Elliott K, Watkins H, Redwood CS. Altered regulatory properties of human cardiac troponin I mutants that cause hypertrophic cardiomyopathy. J Biol Chem. 2000;275:22069–22074. doi: 10.1074/jbc.M002502200. [DOI] [PubMed] [Google Scholar]
- 36.Arad M, Seidman JG, Seidman CE. Phenotypic diversity in hypertrophic cardiomyopathy. Hum Mol Genet. 2002;11:2499–2506. doi: 10.1093/hmg/11.20.2499. [DOI] [PubMed] [Google Scholar]
- 37.Beardslee MA, Lerner DL, Tadros PN, Laing JG, Beyer EC, Yamada KA, Kleber AG, Schuessler RB, Saffitz JE. Dephosphorylation and intracellular redistribution of ventricular connexin43 during electrical uncoupling induced by ischemia. Circ Res. 2000;87:656–662. doi: 10.1161/01.res.87.8.656. [DOI] [PubMed] [Google Scholar]
- 38.Miorelli M, Buja G, Melacini P, Fasoli G, Nava A. QT-interval variability in hypertrophic cardiomyopathy patients with cardiac arrest. Int J Cardiology. 1994;45:121–127. doi: 10.1016/0167-5273(94)90267-4. [DOI] [PubMed] [Google Scholar]