Abstract
There is a high incidence of low back pain (LBP) associated with occupations requiring sustained and/or repetitive lumbar flexion (SLF and RLF, respectively), which cause creep of the viscoelastic tissues. The purpose of this study was to determine the effect of creep on lumbar biomechanics and facet joint capsule (FJC) strain. Specimens were flexed for 10 cycles, to a maximum 10 Nm moment at L5-S1, before, immediately after, and 20 min after a 20-min sustained flexion at the same moment magnitude. The creep rates of SLF and RLF were also measured during each phase and compared to the creep rate predicted by the moment relaxation rate function of the lumbar spine. Both SLF and RLF resulted in significantly increased intervertebral motion, as well as significantly increased FJC strains at the L3-4 to L5-S1 joint levels. These parameters remained increased after the 20-min recovery. Creep during SLF occurred significantly faster than creep during RLF. The moment relaxation rate function was able to accurately predict the creep rate of the lumbar spine at the single moment tested. The data suggest that SLF and RLF result in immediate and residual laxity of the joint and stretch of the FJC, which could increase the potential for LBP.
Keywords: Viscoelasticity, Ligaments, Kinematics, Load relaxation
INTRODUCTION
There is a high incidence of low back pain (LBP) disorders associated with occupations requiring sustained lumbar flexion (SLF) and repetitive lumbar flexion.2 Previous studies have shown that prolonged periods of SLF41 or cyclic loading6 resulted in creep of lumbar tissues simultaneously with spasms of the paraspinal musculature. Although the muscles are the primary contributors to lumbar stiffness during motion,9,11,40 the reflexive activation of the multifidi and longissimus muscles is significantly decreased during sustained or repetitive motion,16,35 resulting in creep of the viscoelastic tissues of the spine. Lumbar creep is believed to result in a laxity developed across the intervertebral joint6,24,35,41 and a subsequent desensitization of the afferents in the ligaments, capsules, and discs. McGill and Brown,25 showed that after 20 min of creep followed by 20 min of rest, muscle activity recovered only 50% of its precreep magnitude.
It is still unclear which viscoelastic tissues contribute to intact lumbar spine creep and what affect creep has on subsequent lumbar biomechanics, (e.g. intervertebral rotations and translations). Much work has been done examining creep of the intervertebral disc.15,17–19,31 Other studies have examined the creep of the intact ligamentous lumbar spine during flexion39 and extension.27 However these studies have not directly compared the effect of static and cyclic loading conditions on lumbar creep and also did not address the creep rate of the spine.
Linear7 and quasilinear8 viscoelastic theories predict that the creep rate and the stress relaxation rate of a tissue should be inversely related. In a creep test, the developed strain reduces to a function of time alone:37
| (1) |
where ε0; is the strain and J(t) is the time-varying creep function. There is an analogous function for stress relaxation. The linear viscoelastic theory predicts that the stress relaxation function, G(t), and the creep function, J(t), should be predictable from one another:37
| (2) |
The linear viscoelastic theory is implicit in its form, but an explicit form can be derived using Laplace transforms for use when G(t) and J(t) take the form of a power law:21
| (3) |
| (4) |
As stress and moment are directly related to force, these equations hold for defining a moment relaxation function or a creep function performed under moment control. However, studies on isolated medial collateral ligament in rat30 and rabbit12,37 have shown that experimental creep and load relaxation behaviors, in the “toe” region of the stress-strain curve, are not inversely proportional from one another as predicted by the theory. The ligaments also exhibit decreased creep and relaxation rates with increased stress and strain,12,29 respectively, a phenomenon that cannot be described by the linear viscoelastic theory, which predicts a single rate. These studies have begun examining the appropriateness of using the nonlinear viscoelastic theory, otherwise referred to as the modified superposition principal, for modeling the viscoelastic behavior. In this formulation, the relaxation and creep functions cannot be separated into stress/strain dependent and time dependent parts, and therefore do not have interrelated coefficients.21 It is unknown whether the relaxation rate and creep rate of the ligamentous lumbar spine are interrelated.
The aims of this study were to assess the creep of the lumbar spine resulting from cyclic versus static lumbar flexion and to determine whether a moment relaxation function could be used to predict creep rate. It was hypothesized that static lumbar flexion would result in a faster creep rate of the lumbar spine compared to cyclic lumbar flexion. It was also hypothesized that both static and cyclic flexion would produce a laxity of the intervertebral joint resulting in increased intervertebral kinematics (rotations and translations) and facet joint capsule strain.
METHODS
Unembalmed, human lumbar spine specimens (T12-sacrum; n = 7; mean age: 65.0 ± 12.7 years; sex: 5 males, 2 female) were procured through the National Disease Research Interchange (Philadelphia, PA). Anteroposterior and lateral radiographs of the specimens were taken and examined to ensure that the specimens were free of any bony deformity that might alter their biomechanical properties. Specimens were frozen in sealed bags at −80°C until dissection.
Twenty-four hours prior to dissection, a specimen was transferred from −80°C to −20°C. Twelve hours prior to dissection, the specimen was removed from the −20°C storage units and placed at room temperature to continue thawing. Using a dissecting microscope, specimens were dissected free of all superficial tissues and intrinsic paraspinal muscles, while leaving the facet joint capsules (FJC) and ligaments intact. Specimens were kept moist during dissection by frequent misting with a phosphate buffer solution (PBS) and by keeping all but the capsule being cleared wrapped in saline soaked gauze.
After dissection the sacrum of the specimen was potted in a polyester resin (Bondo®, Bondo Corporation, Atlanta, GA) cast. The specimen was mounted such that the L3 end-plate was horizontal to the testing surface, while retaining the natural lordosis of the specimen. The resin cast was allowed to harden, thereby rigidly fixating the sacrum and maintaining the full range of motion of the lumbosacral joint. The specimen was then returned to −20°C until 12 h prior to testing.
Experimental Protocol
The experimental setup was very similar to that previously described in detail.14,22 Briefly, testing was performed by actuation of the specimen at the T12 joint level. A rigid rod was placed through the center of the T12 vertebral body, attaching T12 to a U-shaped coupler, which was connected in series to a force transducer (Fig. 1). The force transducer (Model 9363-D1-50-20P1; Revere Transducers, Tustin, CA; range±220 N, resolution 0.02 N), was mounted on a linear actuator using a low friction universal joint, such that no moment was induced at the point of load application. The linear actuator consisted of a sled mounted on a precision screw turned by a rotary motor (Model 317; Galil, Inc., Rocklin, CA) and was controlled by a digital, programmable controller (Galil, Inc., model 1704 DCM) with an optical position encoder (MX21-559; Duncan Electronics, Tustin, CA). Actuator movement was controlled by a digital, programmable, proportional, integrative, and derivative (PID) controller (Model 1704; DMC, Galil, Inc., CA; resolution 0.8 μm) operated through a custom Lab-VIEW program (National Instruments, Inc., version 7.1) using ActiveX software.
FIGURE 1.

(A) Schematic of the experimental setup. (a) Two charge coupled device (CCD) cameras were used for optically tracking displacements of markers glued to the facet joint capsule surface and markers fixed to the tranverse processes of the vertebrae. (b) A human cadaveric lumbar spine specimen was fixed to the testing surface, with coordinate axes as shown. (c) A force transducer was used to measure the applied load. The loading apparatus consisted of (d) a displacement controlled linear actuator with (e) an optical position encoder for the determination of actuator position. B) Image of a typical lumbar spine specimen showing the location of the infrared reflective markers relative to the facet joint capsules and transverse processes. White cotton gauze moistened with saline is wrapped around the rest of the spine to minimize dehydration. Reflective markers (6 per capsule, each forming a 3 × 2 array) were adhered to the dorsal surfaces of the L3-4, L4-5, and L5-S1 facet joint capsules, and were used to calculate plane strains relative to the spatial coordinate system shown. Three noncollinear reflective markers were placed into each of the transverse processes from L3 to L5 and were used to calculate rigid body motion (6 degrees of freedom) of the same vertebrae.
Specimens were actuated in 10 cycles of flexion (Pre-SLF) under displacement control at 5 mm s−1 with continual force feedback, reaching a 10-Nm moment at L5-S1. Based on previous studies,14,22 specimens were expected to reach equilibrium during the last 5 of the 10 cycles and the first 5 cycles were used to mechanically precondition the specimen. The moment was continually calculated in software by multiplying the load reading from the force transducer by the previously measured T12 to L5-S1 moment arm. The 10-Nm limit was selected to utilize the specimen’s range of motion while avoiding structural damage to the tissues, which has been reported to occur at 15 Nm.28 When the desired load was reached, the actuator sled returned at the same speed to the initial starting position, corresponding to the neutral position of the spine, and the next cycle began (Fig. 2). At the peak of the 10th cycle, the 10-Nm flexion moment was maintained for 20 min (SLF), while the specimen was allowed to creep. Immediately following SLF, the specimen returned to the neutral position and another 10 flexion cycles to 10 Nm at L5-S1 was performed (Post-SLF). The specimen was then allowed to recover for 20 min in the neutral position25,27 before repeating 10 cycles to 10 Nm (20Post-SLF). Load and displacement data were collected at 50 Hz and streamed to disk.
FIGURE 2.
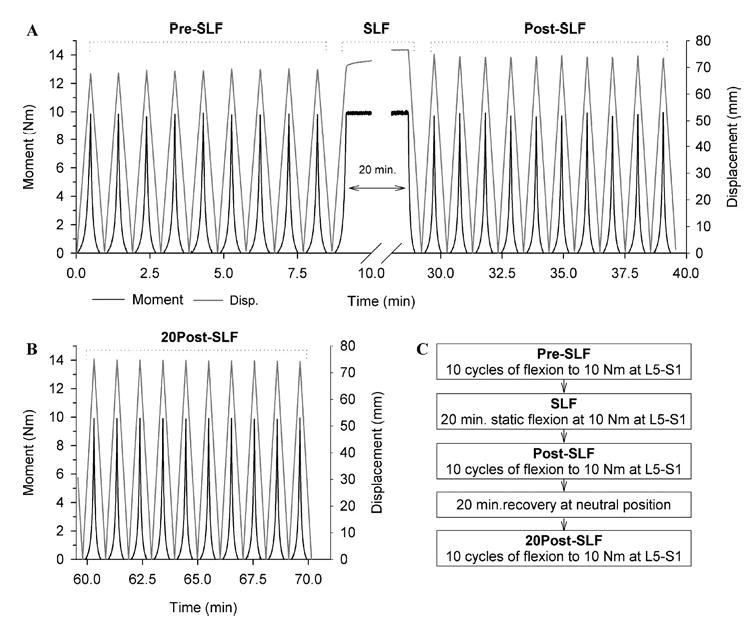
(A) Experimental data from a representative specimen. Specimen was flexed 10 times from its neutral position (0 load) until a 10-Nm bending moment was created at L5-S1 (Pre-SLF). At the peak of the 10th cycle, a static flexed posture was held for 20 min (SLF), while maintaining the 10-Nm bending moment at L5-S1. Immediately following the 20 min of static lumbar flexion, the specimen was cycled 10 more times from neutral to 10 Nm (Post-SLF) and was then allowed to recover for 20 min in the initial neutral position. (B) The specimen was then flexed an additional 10 times (20Post-SLF). (C) Testing sequence for cyclic and static creep protocol.
To measure FJC strains, small infrared markers, arrayed as a three by two matrix, were glued to the right L3-4 to L5-S1 FJC surfaces (Fig. 1), as previously described in detail.14,22 Their three-dimensional centroids were acquired using a commercially available kinematic system (two CCD cameras, Model 50; Qualisys, Inc., Glastonbury, CT) at 50 Hz and streamed to disk. Capsular plane strains, relative to the vertical neutral position of the spine specimen, were calculated using an algorithm that was an extension of a 2D isoparametric finite element method (FEM)13 that accounted for the rotation of the plane.14 The six markers on a given capsule defined six nodes, from which two quadrilateral elements were defined. Plane strains (ɛxx, ɛyy, and ɛxy) were calculated for each node, and the strains for a quadrilateral element were calculated as the means of its respective four nodes. Principal strains, E1 and E2 (defined as the principal strains whose directions were closest to the X-axis and Y-axis, respectively), were calculated for each element using the mean element plane strains. The principal strains from each quadrilateral were averaged to define the mean capsular principal strains.
Kinematics of the L3-L5 vertebrae (6 degrees of freedom: 3 vertebral translations and 3 vertebral rotations) were calculated using the method of Soderkvist and Wedin32 by tracking, using the two camera system, the displacement of three noncollinear markers placed into each of the right transverse processes of L3, L4, and L5. This method calculated the rotation matrix R and the translation vector d using a least-squares approach,
| (5) |
where (x1, x2, x3) are the initial x, y, and z positions, respectively, of the three markers on a single vertebra, and (y1, y2, y3) are the x, y, and z positions, respectively, of the same markers after movement. The intervertebral translations and rotations at L3-4, L4-5 and L5-S1 that were associated with the primary axes for flexion (rotation about the x-axis, and translation along the z-axis, Fig. 1) were computed by subtracting the inferior vertebral motion from the superior vertebral motion.
To minimize the effect of dehydration, the specimens were kept wrapped in saline soaked gauze leaving the right side of the spine, from the spinous process to the lateral edge of the transverse process, exposed from L3 to L5. Specimens were continually misted with saline during testing.
Data Analysis
For each set of cycles, peak data from the last 5 cycles were averaged to yield a representative value describing that state (i.e., Pre-SLF, Post-SLF, and 20Post-SLF). Data from the last 5 s of the sustained flexion moment was averaged to produce representative values describing SLF. The displacement at T12 necessary to create a 10-Nm moment at L5-S1 during each phase of the testing was compared for statistical significance to determine if the spine experienced creep (1-Way repeated measures ANOVA with post-hoc Tukey, α = 0.05). To account for the intrinsic variability between specimens, the FJC strain and intervertebral kinematics were normalized to the Pre-SLF state. The 5th and 95th percentiles (5th–95th%) were computed from the normalized data and compared to the normalized Pre-SLF data to determine whether lumbar flexion affected the FJC strains or intervertebral kinematics.
Cyclic versus Static Creep Rates
To assess the difference in creep rate due to cyclic or static flexion, peak specimen displacements and its corresponding time value was plotted and fit with a power law defining the displacement creep function, JDISP(t.) = (A)tB, for each phase of the protocol (Fig. 3). The coefficient (B) was the rate of displacement creep of the whole specimen29,30 under moment control. The creep rates of the specimens during each phase of the protocol were statistically compared using a Friedman’s test with post-hoc Student-Newman-Keuls (SNK) test(α = 0.05).
FIGURE 3.
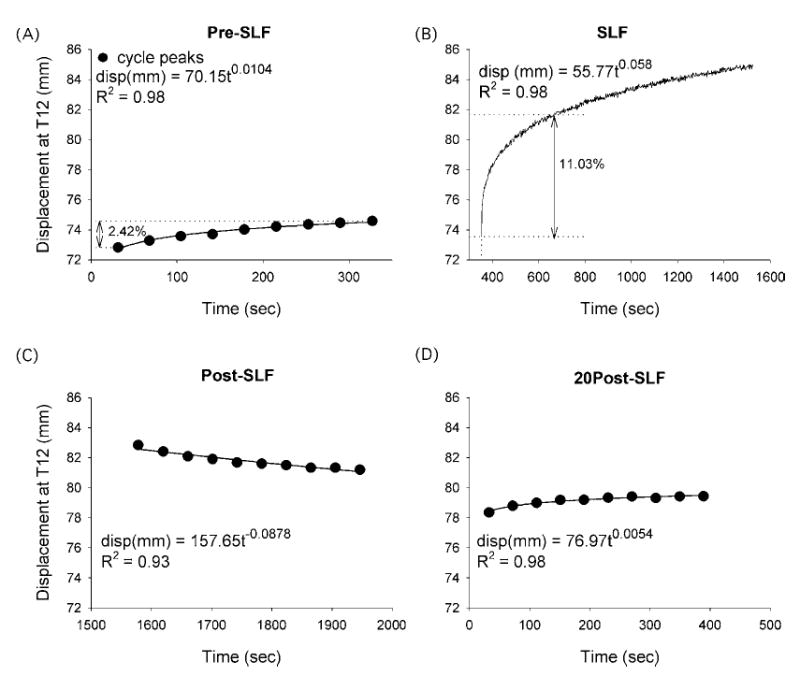
Representative data from a single specimen demonstrating the calculation of creep rate. During the cyclic flexion Pre-SLF (A), Post-SLF (C), and 20Post-SLF (D) phases of the trial, the peak displacement from each cycle from neutral to 10 Nm at L5-S1 was determined and plotted with its corresponding time. B) SLF was a static creep test which maintained a 10-Nm moment at L5-S1. Each data set was regressed with a power law (disp = AtB), where the coefficient, B, was the creep rate. The Post-SLF rate was negative as the displacement decreased with each cycle. The Pre-SLF and SLF plots show the percent creep displacement (2.42% and 11.03%, respectively) that occurred during time periods of the same length (327.1 s).
Moment-Relaxation Rate Function to Predict Creep Rate
Using data previously collected by Ianuzzi et al.,14 a moment relaxation function was defined and used to predict the cyclic creep rate of the lumbar spine. Data used came from lumbar specimens (T12-sacrum; n = 5; mean age: 50.8 ± 11.63 years; sex: 3 males, 2 female) that were not statistically different in age from the specimens used in the creep experiments (unpaired t-test, p = 0.087). The specimens were actuated in 10 cycles of flexion under displacement control reaching peak displacements of 10–40 mm in 10-mm increments. For each displacement, the 10 peak bending moments at L5-S1 and their corresponding times were plotted and regressed using a power law relationship [Eq. (6)] to define the relaxation function (Fig. 4).
FIGURE 4.
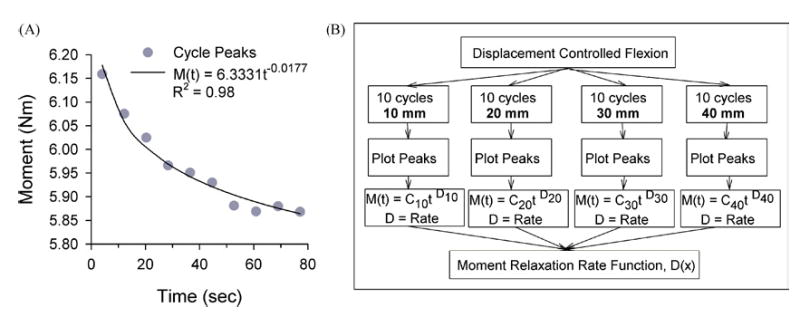
(A) Representative data of the peak moments at L5-S1 during 10 cycles of flexion to 40-mm displacement at T12. Peak moments were regressed with a power fit, M (t) = Ct−D, where the coefficient D is the relaxation rate. (B) Sequence to determine the moment relaxation rate function, D(x) for lumbar spine specimens during displacement controlled flexion. The bending moment-time relationship was plotted and regressed to determine the moment relaxation rate, M(t). The relaxation rates (D) were then plotted as a function of displacement magnitude (x) and regressed to define a Moment Relaxation Rate function, D(x), dependent on peak displacement.
| (6) |
The coefficient (D) was the rate of moment relaxation of the whole specimen.23,29,30
As shown by Provenzano et al.,30 a moment relaxation function, which depends on both time and peak strain (or displacement for this data), can be defined using the single integral formula of the modified superposition method,21 and takes the form of a power law [Eq. (7)],
| (7) |
where GM is the moment relaxation function, x is the displacement, and C(x) is the initial moment at displacement (x), which can be described by a function of any form. The function D(x) describes the displacement-dependent relaxation rate.
To define the displacement-dependent relaxation rate function, D(x), in Eq. (7), the moment relaxation rates [D from Eq. (6)] measured at each peak displacement, were plotted as a function of the peak displacement (x) and regressed23,29,30 with an exponential rise to maximum function [Eq. (8); Fig. 4]
| (8) |
The mean Pre-SLF displacement needed to achieve a 10-Nm moment at L5-S1 was then used in Eq. (8) to find the relaxation rate at that displacement.
The computed relaxation rate was then substituted into Eq. (7), with C(x) equal to 10 Nm. Using the relationship defined in Eq. (2), the computed moment relaxation rate was used to predict the displacement creep rate, B. The predicted creep rate was compared to the actual Pre-SLF creep rate of the specimens.
RESULTS
With the exception of the flexion displacement data, all other data were not normally distributed, and are therefore reported as the median and interquartile (IQR) range (25th–75th percentiles) and the 5th and 95th percentiles were used in place of the confidence interval.
Compared to Pre-SLF data, the flexion displacement of the spine at T12 necessary to create a 10-Nm moment at L5-S1 significantly increased during SLF (% increase: 19.6 ± 3.42; p < 0.001) and remained increased during the Post-SLF cycles (% increase: 15.19 ± 4.38; p < 0.001; Fig. 5). After 20 min of recovery, the flexion displacement was still significantly larger than the Pre-SLF displacement (% increase: 11.82 ± 4.35; p < 0.001), but was reduced compared to the SLF magnitude (p < 0.001).
FIGURE 5.
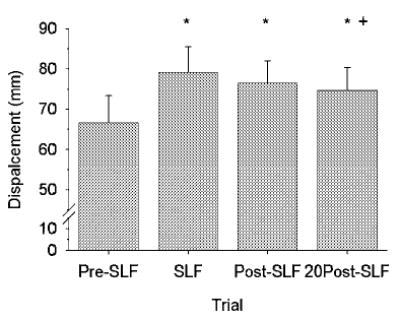
Mean linear displacement of the lumbar specimens (n = 7) at T12 increased during 20 min of static lumbar flexion (SLF), and remained increased during the 10 cycles of flexion immediately following SLF (Post-SLF) and after 20 min of recovery (20Post-SLF). Error bars are standard deviations. * –statistically significant from Pre-SLF displacement, + – statistically significant from SLF (1-Way RM ANOVA with Tukey).
Cyclic versus Static Creep Rates
The flexion displacement of the spine continually increased during the Pre-SLF, SLF, and 20Post-SLF phases of the testing (Fig. 3), and was well fit with a power law (R2 = 0.96 ± 0.04). The rate of creep during SLF occurred significantly faster than during cyclic flexion (SNK, p < 0.05; Fig. 6). Interestingly, the rate of the Post-SLF phase was negative, as the peak cycle displacements were decreasing in magnitude rather than increasing as expected (Figs. 3 and 6). The rate was positive, but very small, during the 20Post-SLF phase of testing. As the displacement of the spine was still statistically increased after a 20-min recovery (Fig. 5), it was likely that the specimens were reaching steady-state during the 20 min of SLF, such that more sustained time at 10 Nm would not provide substantial increases in displacement, but instead the Post-SLF cycles provided brief interludes of recovery from the steady-state value. The small positive rates measured during 20Post-SLF indicate that although the 20 min at the neutral position allowed some recovery, creep occurred more slowly as it approached steady-state.
FIGURE 6.
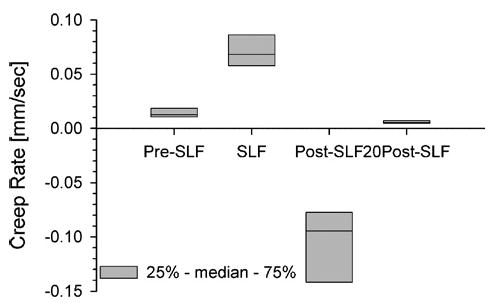
Rate of creep of the lumbar spine while creating a 10-Nm moment at L5-S1. Rate was determined by fitting the peak cyclic displacements – time relationship (Pre-SLF, Post-SLF, 20Post-SLF; see Fig. 3) or continuous displacement-time relationship (SLF) with a power law, Disp(t) = AtB, where (B) is the rate. The rate for Post-SLF was negative indicating that the peak cyclic displacements were decreasing in magnitude. Horizontal line in the box plot indicates median value. All rates were statistically different from one another (Friedman’s test with SNK, p < 0.05).
Lumbar Intervertebral Biomechanics
Intervertebral rotations and translations were increased from the Pre-SLF magnitude during the SLF, Post-SLF, and 20Post-SLF phases (Figs. 7 and 8). At each intervertebral level, the greatest increases were observed during SLF and the 5th–95th% did not contain the Pre-SLF value indicating that the rotations and translations were statistically larger. With the exception of L4-5, the rotations remain increased, that is, the 5th–95th% did not contain the Pre-SLF data, during the Post-SLF and 20Post-SLF phases of the testing. The intervertebral translations remained increased throughout the Post-SLF and 20Post-SLF phases of testing.
FIGURE 7.
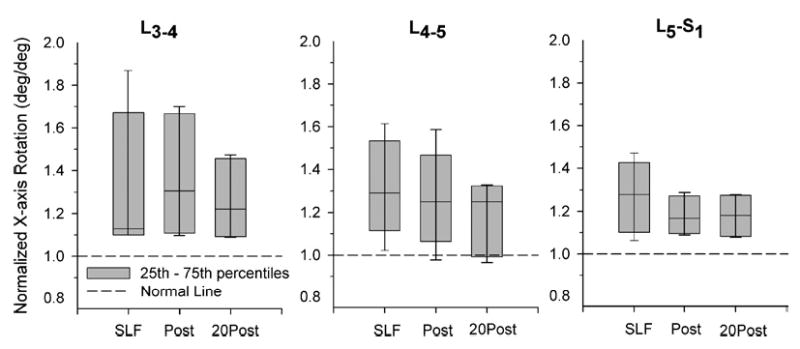
Intervertebral rotations, shown normalized to Pre-SLF magnitudes, about the x-axis (see Fig. 1) were increased during 20 min of static lumbar flexion (SLF), and remained increased during 10 flexion cycles both immediately following SLF (Post) and after a 20-min recovery period (20 Post). Horizontal line in the box plot indicates median value. Bars show the 5th–95th percentiles of the data sets. With the exception of L4-5 Post and 20 Post, the bars do not contain the normalized Pre-SLF data (unity) indicating that the samples are significantly different.
FIGURE 8.
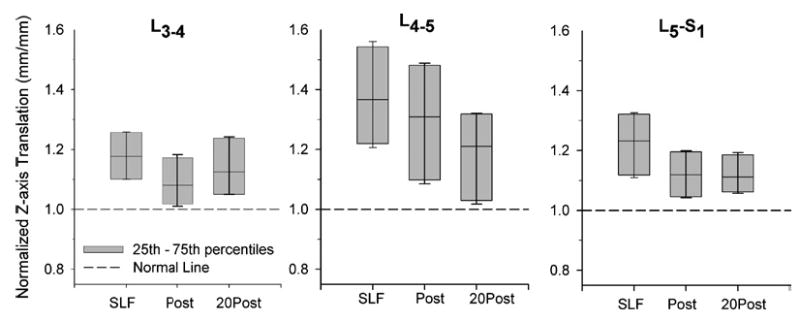
Intervertebral translations, shown normalized to Pre-SLF magnitudes, along the z-axis (see Fig. 1) were increased during 20 min of static lumbar flexion (SLF), and remained increased during 10 flexion cycles both immediately following SLF (Post) and after a 20-min recovery period (20Post). Horizontal line in box plot indicates median value. Bars show the 5th–95th percentiles of the data sets. The bars do not contain the normalized Pre-SLF data (unity) indicating that the samples are significantly different.
Facet Joint Capsule Strains
The FJC strains at L3-4 to L5-S1 were large at the peak displacements while creating a 10-Nm moment at L5-S1 (Table 1). The strains increased from the Pre-SLF magnitudes during SLF, Post-SLF, and 20Post-SLF, i.e. the E2 strains became more positive (increase in capsular length in the cephalic-caudal direction) and the E1 strains became more negative (decrease in capsule width in the medial-lateral direction). Normalization of the strains by the Pre-SLF magnitude show that the FJC’s exhibited significant creep (Fig. 9), ranging from 5 to 55% during the SLF phase. The strains at L3-4 remained increased during all phases of testing and the 5th–95th% did not contain the Pre-SLF values. Strains at L4-5 remained increased during the Post-SLF cycles, but appear to have recovered during the 20-min rest at neutral. The L5-S1 strains were significantly increased during the Post-SLF cycles, but the data were more widely distributed during the 20Post-SLF cycles.
TABLE 1.
Facet joint capsule principal strains, E1 and E2 (which lie closest to the x- and y-axis, respectively).
| L3-4
|
L4-5
|
L5-S1
|
|||||||
|---|---|---|---|---|---|---|---|---|---|
| 25th | Med. | 75th | 25th | Med. | 75th | 25th | Med. | 75th | |
| E1 | |||||||||
| Pre-SLF | −0.12 | −0.10 | −0.09 | −0.10 | −0.08 | −0.07 | −0.08 | −0.05 | −0.05 |
| SLF | −0.15 | −0.12 | −0.10 | −0.11 | −0.10 | −0.10 | −0.10 | −0.07 | −0.07 |
| Post-SLF | −0.14 | −0.11 | −0.10 | −0.09 | −0.09 | −0.09 | −0.10 | −0.06 | −0.06 |
| 20 Post-SLF | −0.15 | −0.15 | −0.10 | −0.08 | −0.08 | −0.07 | −0.11 | −0.08 | −0.06 |
| E2 | |||||||||
| Pre-SLF | 0.08 | 0.13 | 0.17 | 0.10 | 0.12 | 0.18 | 0.07 | 0.08 | 0.10 |
| SLF | 0.11 | 0.15 | 0.20 | 0.13 | 0.15 | 0.21 | 0.09 | 0.11 | 0.12 |
| Post-SLF | 0.11 | 0.15 | 0.22 | 0.11 | 0.13 | 0.13 | 0.09 | 0.09 | 0.10 |
| 20 Post-SLF | 0.10 | 0.18 | 0.19 | 0.10 | 0.10 | 0.12 | 0.06 | 0.09 | 0.12 |
Note. E1 and E2 were large during 10 cycles to 10 Nm at L5-S1 (Pre), during 20 min of static lumbar flexion (SLF), during 10 cycles to 10 Nm after SLF (Post), and after being allowed a 20-min recovery period (20 Post). Strains were not normally distributed and the median (Med.) and interquartile range (25th percentile–75th percentile) are reported instead.
FIGURE 9.
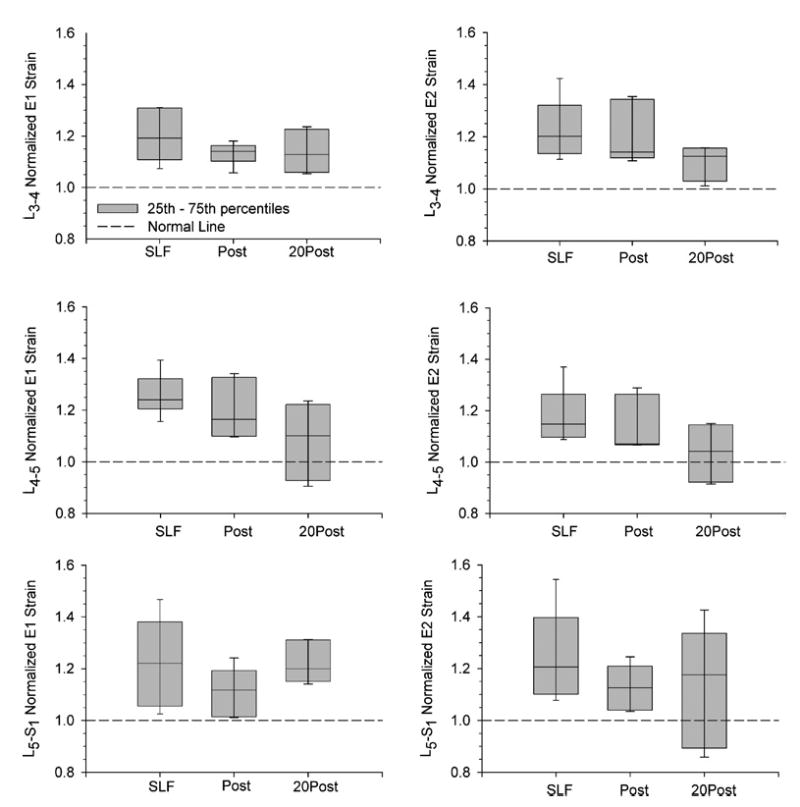
Normalized facet joint capsule principal strains during 20 min of static lumbar flexion (SLF) and 10 cycles immediate post static flexion (Post) were increased compared to their pre-creep magnitude (shown as the dotted line on the graphs). After 20 min of recovery (20 Post), facet capsule strains were still large. Bars on graph show the 5th–95th percentiles of the data. E1 and E2 are the principal strain closes to the x- and y-axis, respectively.
Moment Relaxation Function
The relaxation rates for the five specimens decreased in absolute magnitude with increasing peak displacement (Fig. 10). The range of rates at each displacement was closely distributed and two specimens exhibited identical rates. The rates were well described using an exponential rise to maximum equation, D(x) = −0.4582 + 0.4415(1 − exp−0.2242x), R2 = 0.89. Using a displacement of 66.67 mm, the average displacement necessary to achieve the 10-Nm moment at L5-S1 during the Pre-SLF cycles, the equation predicts a relaxation rate of −0.0167. This moment relaxation rate corresponds to a predicted moment controlled creep rate of 0.0167 by the quasilinear viscoelastic theory,8 which fell within the range of creep rates measured during the Pre-SLF cycles [Fig. 10(B)].
FIGURE 10.
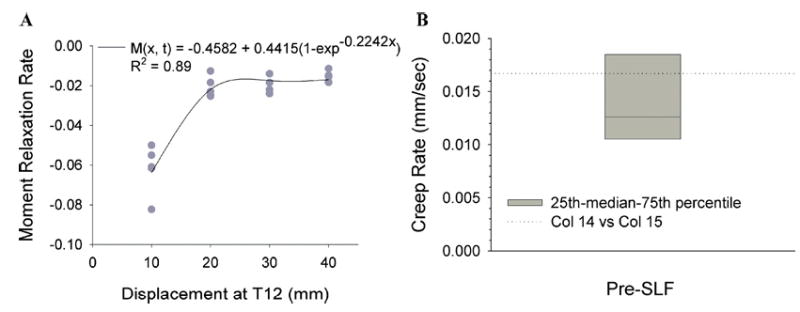
(A) A moment relaxation rate function, D(x), was defined using an exponential rise to maximum equation from a separate data set. Each data point represents a specimen’s (n = 5) moment relaxation rate over 10 cycles at the shown displacement (10–40 mm). The range of relaxation rates from the specimens was small and two specimens exhibited identical rates. (B) The relaxation rate predicted by the moment relaxation function at 66.67 mm, which was the average displacement necessary to create a 10-Nm bending moment at L5-S1, was 0.0167. This rate falls within the range of creep rates observed during the Pre-SLF trials.
DISCUSSION
The data from this study showed that the intact ligamentous lumbar spine creeps during both static and cyclic flexion did not fully recover after 20 min of rest. This corresponded well to the previously published results of lumbar spine flexion creep,39 which also demonstrated that the lumbar spine experienced creep during 20 min of static flexion and did not fully recover during a rest period of the same length. The changes in creep displacement measured in this study were larger than results published for 20 min of sustained lumbar extension,27 in which cadaveric spine specimens crept an average of 6.8–9.6%, depending on age, of its total range of motion, and retained an increase of 3–4% after a 20-min recovery period.
The intervertebral rotations and translations were also increased during cyclic and static flexion and did not fully recover during the 20 min of rest. These data support the hypothesis that creep of the lumbar spine results in a laxity across the intervertebral joint, resulting in increased relative motion (i.e., intervertebral translations and rotations), which could lead to a decrease in mechanical stability and increased potential for low back disorders.36 Under normal loading conditions during motion, the paraspinal muscles are the primary contributors to lumbar stability.40 However it has been shown that prolonged and cyclic loading of the spine decreases the reflexive muscle activity and results in spasms of the paraspinal muscles.6,10,33–36,41
The strain of the facet joint capsules during creep most likely contributes to the initial reflexive stimulation and subsequent spasms observed in multifidus muscle,41 which has insertions on the capsules, during prolonged flexion. Electrical stimulation of the facet joint capsules6,16 has been shown to result in EMG activity of the multifidus at the level of stimulation and 1–2 levels caudally. As the capsules are innervated with low threshold mechanoreceptors,3,4,26 which respond to stretch, the increase in strain could be eliciting a response from its receptors and triggering the contraction of the multifidus muscle. As normal activity of the paraspinal muscles has been shown to take longer than 7 h to fully recover,6,10,24,35,41 any movement performed subsequent to lumbar creep, while the intervertebral joints are lax and the muscle activity is reduced, could be mechanically unstable and have a greater potential to result in injury.
The rate of creep was faster during static flexion compared to cyclic flexion. This rate discrepancy was also observed in the relaxation rate of the lumbar spine segments, with the relaxation rate of static bending being much larger than that of cyclic bending for an isochronal time segment.1 The difference in rates is not unexpected, as cyclic loading provides brief periods of unloading which allow the spine to begin to recover. This does suggest that occupations requiring static postures may have increased potential for disorders compared to occupations requiring repetitive flex-ion for periods of the same length of time.
The relaxation rate of the intact ligamentous spine specimens was nonlinear, similar to the isolated human lumbar facet joint capsule,23 and the isolated medial collateral ligament in the rat29 and the rabbit.12 The relaxation rate decreased with increasing displacement, and hence, could not be described using a linear viscoelastic model. This behavior has been hypothesized to stem from a “wringing-out” effect,29 in which the specimen has decreased water content at higher strain magnitudes, resulting in more elastic behavior. The relaxation rate appeared to reach a steady state from 20 to 40 mm of displacement and was well described by an exponential rise to maximum function. The more consistent rate measured at higher displacement magnitudes was also observed in the rabbit medial collateral ligament.12 From 20 to 40 mm of displacement, the moment-displacement relationship was linear (data not shown) suggesting that those displacements were within the elastic range and could be described using the linear viscoelastic model or quasi-linear viscoelastic model. The moment relaxation rates for small displacements (<10 mm), within the toe-region of the moment-displacement curve, would most likely be faster than the rate measured experimentally at 10 mm.
For a single, large displacement, the moment relaxation rate function was able to predict the creep rate of the spine, which was not initially expected. This suggests that at large, physiologic displacements, a simple viscoelastic linear model with interrelated coefficients might be sufficient to describe lumbar spine viscoelastic behaviors. The ability of the relaxation function to predict the creep rate at the large displacement magnitude is suggested by the fiber recruitment theory.37,38 This theory suggests that as a specimen creeps, there is progressive recruitment of collagen fibers, which have different “crimped” or resting lengths, and has been demonstrated in the rabbit medial collateral ligament.38 At increased displacements, longer bundles are recruited to help carry loads, which decrease the creep rate compared to the relaxation rate, which is a function of a discrete number of fiber bundles. However, as a specimen reaches the end of its physiological range of motion, all of the fiber bundles would be engaged and acting as a discrete unit, allowing creep and relaxation to occur at the same rate. Therefore, it would not be expected that the creep and relaxation rates would be inversely related to each over the entire range of motion of the lumbar spine, but only at larger displacements in the elastic range. It is likely that relaxation does occur faster than creep within the toe-region of the moment-displacement curve.
There were several physiological factors that may have influenced the data presented here, including specimen age, temperature, and hydration level. Older specimens have been shown to creep further in flexion than younger specimens and recover more slowly.39 As the specimens used in this study had an average age of 70 years, the results shown here might be slightly larger than what would be measure for specimens from younger donors. However, age did not affect the extension creep rate of lumbar specimens.27 It has also been shown that testing at laboratory (rather than body) temperature reduces intervertebral disc creep by 10%,20 which may serve to offset the increased creep due to age of the specimens. The amount of creep and recovery exhibited by the specimens may not accurately represent that which would occur in vivo due to the hydration level. The rabbit medial collateral ligament has been shown to have increased relaxation with increased hydration level,5 and one could predict the same effect on creep. The recovery of the lumbar intervertebral disc mechanics is dependent upon fluid imbibition,15 a process that must occur passively in this experiment in the absence of active biological processes. Specimens were kept moist throughout trials, but this does not simulate the conditions in a living person.
In addition to the physiological factors, there were two mechanical factors that may have influenced the results as well. The testing sequence used allowed the specimens to begin to creep during the cycles applied before the static phase of test, such that the SLF phase did not begin at 0% creep. As such, the SLF creep rate measured in this study may not be directly compared to studies which employed only an immediate static load. Also, the specimens were expected to reach a displacement equilibrium within the first five cycles of the Pre-SLF testing based on previous experiments.14,22 However, examination of the cycle peaks from the Pre-SLF phase showed that the specimens were still experiencing increasing displacement over the last five cycles. This suggests that, unlike experiments run under displacement control, more than five cycles are necessary to mechanically precondition the lumbar spine under load control.
The data reported in the current study suggest that the lumbar spine does experience significant creep during both static and cyclic flexion, resulting in increased relative vertebral motion and facet joint capsule strains, which could increase the potential for mechanical instability and or muscle spasms. It also suggests that at large displacements, the lumbar spine can be modeled using a linear viscoelastic model.
Acknowledgments
This study was partially funded by a Sigma-Xi, The Research Society, Grant-in-Aid-of-Research, by NIAMS/NIH AR46865, and by CCCR/NCCAM/NIH AT001701.
References
- 1.Adams MA, Dolan P. Time-dependent changes in the lumbar spine’s resistance to bending. Clin Biomech (Bristol, Avon) 1996;11:194–200. doi: 10.1016/0268-0033(96)00002-2. [DOI] [PubMed] [Google Scholar]
- 2.Bernard, B. P., and L. Fine. Musculoskeletal Disorders and Workplace Factors: Critical Review of Epidemiologic Evidence for Work-Related Musculoskeletal Disorders of the Neck, Upper Extremity, and Low Back, 2nd ed. Bethesda, MD: National Institute for Occupational Safety and Health, 1997.
- 3.Cavanaugh J, Ozaktay A, Yamashita H, Avramov A, Getchell T, King A. Mechanisms of low back pain. Clin Orthop Relat Res. 1997;335:166–180. [PubMed] [Google Scholar]
- 4.Cavanaugh JM, Ozaktay AC, Yamashita HT, King AI. Lumbar facet pain: Biomechanics, neuroanatomy and neurophysiology. J Biomech. 1996;29:1117–1129. doi: 10.1016/0021-9290(96)00023-1. [DOI] [PubMed] [Google Scholar]
- 5.Chimich D, Shrive N, Frank C, Marchuk L, Bray R. Water content alters viscoelastic behaviour of the normal adolescent rabbit medial collateral ligament. J Biomech. 1992;25:831–837. doi: 10.1016/0021-9290(92)90223-n. [DOI] [PubMed] [Google Scholar]
- 6.Claude LN, Solomonow M, Zhou BH, Baratta RV, Zhu MP. Neuromuscular dysfunction elicited by cyclic lumbar flexion. Muscle Nerve. 2003;27:348–358. doi: 10.1002/mus.10318. [DOI] [PubMed] [Google Scholar]
- 7.Findly, W. N., J. W. Lai, and K. Onaran. Creep and Relaxation of Nonlinear Viscoelastic Mateirals, with an Introduction of Linear Viscoelasticity. Amsterdam: North Holland, 1976.
- 8.Fung, Y. Biomechanics: Mechanical Properties of Living Tissues, 2nd ed. New York: Springer-Verlag, 1993.
- 9.Gardner-Morse MG, I, Stokes A. The effects of abdominal muscle coactivation on lumbar spine stability. Spine. 1998;23:86–91. doi: 10.1097/00007632-199801010-00019. [DOI] [PubMed] [Google Scholar]
- 10.Gedalia U, Solomonow M, Zhou BH, Baratta RV, Lu Y, Harris M. Biomechanics of increased exposure to lumbar injury caused by cyclic loading. Part 2. Recovery of reflexive muscular stability with rest. Spine. 1999;24:2461–2467. doi: 10.1097/00007632-199912010-00007. [DOI] [PubMed] [Google Scholar]
- 11.Granata KP, Marras WS. The influence of trunk muscle coactivity on dynamic spinal loads. Spine. 1995;20:913–919. doi: 10.1097/00007632-199504150-00006. [DOI] [PubMed] [Google Scholar]
- 12.Hingorani RV, Provenzano PP, Lakes RS, Escarcega A, Vanderby R., Jr Nonlinear viscoelasticity in rabbit medial collateral ligament. Ann Biomed Eng. 2004;32:306–312. doi: 10.1023/b:abme.0000012751.31686.70. [DOI] [PubMed] [Google Scholar]
- 13.Hoffman AH, Grigg P. A method for measuring strains in soft tissue. J Biomech. 1984;17:795–800. doi: 10.1016/0021-9290(84)90110-6. [DOI] [PubMed] [Google Scholar]
- 14.Ianuzzi A, Little JS, Chiu JB, Baitner A, Kawchuk G, Khalsa PS. Human lumbar facet joint capsule strains: I. During physiological motions. Spine J. 2004;4:141–152. doi: 10.1016/j.spinee.2003.07.008. [DOI] [PubMed] [Google Scholar]
- 15.Johannessen W, Vresilovic EJ, Wright AC, Elliott DM. Intervertebral disc mechanics are restored following cyclic loading and unloaded recovery. Ann Biomed Eng. 2004;32:70–76. doi: 10.1023/b:abme.0000007792.19071.8c. [DOI] [PubMed] [Google Scholar]
- 16.Kang YM, Choi WS, Pickar JG. Electrophysiologic evidence for an intersegmental reflex pathway between lumbar paraspinal tissues. Spine. 2002;27:E56–E63. doi: 10.1097/00007632-200202010-00005. [DOI] [PubMed] [Google Scholar]
- 17.Keller TS, Hansson TH, Holm SH, Pope MM, Spengler DM. In vivo creep behavior of the normal and degenerated porcine intervertebral disk: A preliminary report. J Spinal Disord. 1988;1:267–278. [PubMed] [Google Scholar]
- 18.Keller TS, Holm SH, Hansson TH, Spengler DM. Volvo Award in experimental studies. The dependence of intervertebral disc mechanical properties on physiologic conditions. Spine. 1990;15:751–761. doi: 10.1097/00007632-199008010-00004. [DOI] [PubMed] [Google Scholar]
- 19.Keller TS, Spengler DM, Hansson TH. Mechanical behavior of the human lumbar spine. I. Creep analysis during static compressive loading. J Orthop Res. 1987;5:467–478. doi: 10.1002/jor.1100050402. [DOI] [PubMed] [Google Scholar]
- 20.Koeller W, Muehlhaus S, Meier W, Hartmann F. Biomechanical properties of human intervertebral discs subjected to axial dynamic compression–influence of age and degeneration. J Biomech. 1986;19:807–816. doi: 10.1016/0021-9290(86)90131-4. [DOI] [PubMed] [Google Scholar]
- 21.Lakes RS, Vanderby R. Interrelation of creep and relaxation: A modeling approach for ligaments. J Biomech Eng. 1999;121:612–615. doi: 10.1115/1.2800861. [DOI] [PubMed] [Google Scholar]
- 22.Little JS, Ianuzzi A, Chiu JB, Baitner A, Khalsa PS. Human lumbar facet joint capsule strains: II. Alteration of strains subsequent to anterior interbody fixation. Spine J. 2004;4:153–162. doi: 10.1016/j.spinee.2003.07.002. [DOI] [PubMed] [Google Scholar]
- 23.Little JS, Khalsa PS. Material properties of the human lumbar facet joint capsule. J Biomech Eng. 2005;127:1–10. doi: 10.1115/1.1835348. [DOI] [PMC free article] [PubMed] [Google Scholar]
- 24.Lu D, Solomonow M, Zhou B, Baratta RV, Li L. Frequency-dependent changes in neuromuscular responses to cyclic lumbar flexion. J Biomech. 2004;37:845–855. doi: 10.1016/j.jbiomech.2003.11.023. [DOI] [PubMed] [Google Scholar]
- 25.McGill SM, Brown S. Creep response of the lumbar spine to prolonged full flexion. Clin Biomech. 1992;7:43–46. doi: 10.1016/0268-0033(92)90007-Q. [DOI] [PubMed] [Google Scholar]
- 26.McLain RF, Pickar JG. Mechanoreceptor endings in human thoracic and lumbar facet joints. Spine. 1998;23:168–173. doi: 10.1097/00007632-199801150-00004. [DOI] [PubMed] [Google Scholar]
- 27.Oliver MJ, Twomey LT. Extension creep in the lumbar spine. Clin Biomech (Bristol, Avon) 1995;10:363–368. doi: 10.1016/0268-0033(95)00001-2. [DOI] [PubMed] [Google Scholar]
- 28.Panjabi MM, Krag M, Summers D, Videman T. Biomechanical time-tolerance of fresh cadaveric human spine specimens. J Orthop Res. 1985;3:292–300. doi: 10.1002/jor.1100030305. [DOI] [PubMed] [Google Scholar]
- 29.Provenzano PP, Lakes RS, Corr DT, Vanderby RR., Jr Application of nonlinear viscoelastic models to describe ligament behavior. Biomech Model Mechanobiol. 2002;1:45–57. doi: 10.1007/s10237-002-0004-1. [DOI] [PubMed] [Google Scholar]
- 30.Provenzano P, Lakes R, Keenan T, Vanderby R., Jr Nonlinear ligament viscoelasticity. Ann Biomed Eng. 2001;29:908–914. doi: 10.1114/1.1408926. [DOI] [PubMed] [Google Scholar]
- 31.Race A, Broom ND, Robertson P. Effect of loading rate and hydration on the mechanical properties of the disc. Spine. 2000;25:662–669. doi: 10.1097/00007632-200003150-00003. [DOI] [PubMed] [Google Scholar]
- 32.Soderkvist I, Wedin PA. Determining the movements of the skeleton using well-configured markers. J Biomech. 1993;26:1473–1477. doi: 10.1016/0021-9290(93)90098-y. [DOI] [PubMed] [Google Scholar]
- 33.Solomonow M, Baratta RV, Banks A, Freudenberger C, Zhou BH. Flexion-relaxation response to static lumbar flexion in males and females. Clin Biomech (Bristol, Avon) 2003;18:273–279. doi: 10.1016/s0268-0033(03)00024-x. [DOI] [PubMed] [Google Scholar]
- 34.Solomonow M, Baratta RV, Zhou BH, Burger E, Zieske A, Gedalia A. Muscular dysfunction elicited by creep of lumbar viscoelastic tissue. J Electromyogr Kinesiol. 2003;13:381–396. doi: 10.1016/s1050-6411(03)00045-2. [DOI] [PubMed] [Google Scholar]
- 35.Solomonow M, He ZB, Baratta RV, Lu Y, Zhu M, Harris M. Biexponential recovery model of lumbar viscoelastic laxity and reflexive muscular activity after prolonged cyclic loading. Clin Biomech (Bristol, Avon) 2000;15:167–175. doi: 10.1016/s0268-0033(99)00062-5. [DOI] [PubMed] [Google Scholar]
- 36.Solomonow M, Zhou BH, Baratta RV, Lu Y, Harris M. Biomechanics of increased exposure to lumbar injury caused by cyclic loading: Part 1. Loss of reflexive muscular stabilization. Spine. 1999;24:2426–2434. doi: 10.1097/00007632-199912010-00003. [DOI] [PubMed] [Google Scholar]
- 37.Thornton GM, Oliynyk A, Frank CB, Shrive NG. Ligament creep cannot be predicted from stress relaxation at low stress: A biomechanical study of the rabbit medial collateral ligament. J Orthop Res. 1997;15:652–656. doi: 10.1002/jor.1100150504. [DOI] [PubMed] [Google Scholar]
- 38.Thornton GM, Shrive NG, Frank CB. Ligament creep recruits fibres at low stresses and can lead to modulus-reducing fibre damage at higher creep stresses: A study in rabbit medial collateral ligament model. J Orthop Res. 2002;20:967–974. doi: 10.1016/S0736-0266(02)00028-1. [DOI] [PubMed] [Google Scholar]
- 39.Twomey L, Taylor J. Flexion creep deformation and hysteresis in the lumbar vertebral column. Spine. 1982;7:116–122. doi: 10.1097/00007632-198203000-00005. [DOI] [PubMed] [Google Scholar]
- 40.White, A., and M. M. Panjabi. Clinical Biomechanics of the Spine, 2nd ed. Philadelphia: Lippincott, 1990.
- 41.Williams M, Solomonow M, Zhou BH, Baratta RV, Harris M. Multifidus spasms elicited by prolonged lumbar flexion. Spine. 2000;25:2916–2924. doi: 10.1097/00007632-200011150-00014. [DOI] [PubMed] [Google Scholar]


