
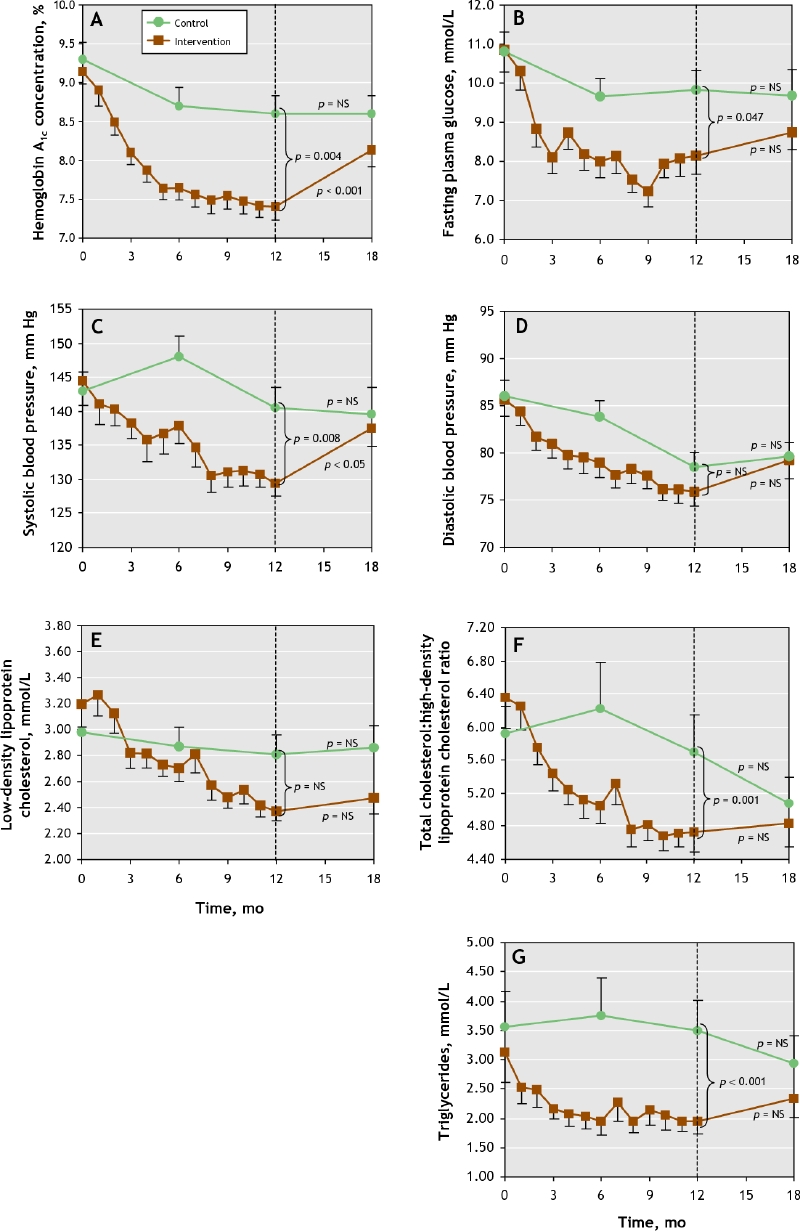
Fig. 2: Mean values for the treatment goals in the 2 study groups over the course of the study. A. Hemoglobin A1c concentrations. B. Fasting plasma glucose. C. Systolic blood pressure. D. Diastolic blood pressure. E. Low-density lipoprotein cholesterol. F. Total cholesterol:high-density lipoprotein cholesterol. G. Trigyceride. The dots represent mean values, and the bars represent standard errors of the mean.