

Abstract
Motivation
The transcription start site (TSS) has been located for an increasing number of genes across several organisms. Statistical tests have shown that some cis-acting regulatory elements have positional preferences with respect to the TSS, but few strategies have emerged for locating elements by their positional preferences. This paper elaborates such a strategy. First, we align promoter regions without gaps, anchoring the alignment on each promoter’s TSS. Second, we apply a novel word-specific mask. Third, we apply a clustering test related to gapless BLAST statistics. The test examines whether any specific word is placed unusually consistently with respect to the TSS. Finally, our program A-GLAM, an extension of the GLAM program, uses significant word positions as new ‘anchors’ to realign the sequences. A Gibbs sampling algorithm then locates putative cis-acting regulatory elements. Usually, Gibbs sampling requires a preliminary masking step, to avoid convergence onto a dominant but uninteresting signal from a DNA repeat. However, since the positional anchors focus A-GLAM on the motif of interest, masking DNA repeats during Gibbs sampling becomes unnecessary.
Results
In a set of human DNA sequences with experimentally characterized TSSs, the placement of 791 octonucleotide words was unusually consistent (multiple test corrected P < 0.05). Alignments anchored on these words sometimes located statistically significant motifs inaccessible to GLAM or AlignACE.
Availability
The A-GLAM program and a list of statistically significant words are available at ftp://ftp.ncbi.nih.gov/pub/spouge/papers/archive/AGLAM/.
Contact
spouge@ncbi.nlm.nih.gov
1 INTRODUCTION
Transcription is a complex cellular process that involves the expression of genes in a manner coordinated both in space and time. Gene regulation is more complex in mammals than in yeast and it has been suggested that the expansion of regulation in higher eukaryotes could be an important factor contributing to their complexity (Levine and Tjian, 2003).
The identification of individual regulatory elements is the first step to understanding the complexities of gene regulation. Usually, computational methods for identifying cis-acting regulatory elements in proximal promoter sequences fall into two classes, alignment and enumeration (Ohler and Niemann, 2001). On one hand, alignment methods identify regulatory motifs by optimizing local alignments of the corresponding sequences. Several different optimization methods have proved useful, e.g. Expectation Maximization in the MEME program (Bailey and Elkan, 1995) or Gibbs sampling (Lawrence et al., 1993) in the GLAM program (Frith et al., 2004b). On the other hand, enumerative methods list all possible DNA words of a fixed length and report motifs as overlaps of the most statistically significant words (Marino-Ramirez et al., 2004; Sinha and Tompa, 2002; Van Helden et al., 1998). Most enumerative methods rely on over-representation to identify statistically significant words. Our strategy is unusual (Fig. 1), because it subordinates word frequencies to word placement (FitzGerald et al., 2004).
Fig. 1.

A flow chart of the enumerative step for each word.
The first suggestion to combine enumeration and alignment came from Ohler and Niemann (2001). In this paper, we elaborate on their idea by identifying cis-acting regulatory elements in three steps. First, we enumerate all octonucleotide words. Second, we anchor known transcription start sites (TSSs) in a single column of a gapless multiple alignment of human proximal promoter regions (PPRs). After masking, our local maximum statistic (related to the gapless BLAST statistic) then judges whether the unmasked occurrences of an octonucleotide W form unusual clusters in the alignment columns. Third, we realign the PPRs as follows. Each statistically significant cluster of W corresponds to certain positions within certain promoter sequences. The positions are ‘seeds’, and the sequences containing them are ‘seed sequences’. We realign the seed sequences, by moving the seeds in them into the same alignment column, forming another anchored alignment. Other ‘target sequences’ might be added to the multiple alignment as desired, to investigate them for motifs related to the seed word W. A Gibbs sampler program, A-GLAM (anchored gapless local alignment of multiple sequences) then optimizes the multiple alignment, always constraining its gapless local alignment to include the positions corresponding to the seeds. (In addition, another option in A-GLAM can anchor the alignment on any set of positions thought to contribute to a common regulatory motif.)
2 METHODS
2.1 Datasets and the TSS-anchored alignment
2.1.1 The PPR dataset
A previous study (Marino-Ramirez et al., 2004) assembled 4737 human PPRs of length 3001 (positions −2000 to +1000 bp, relative to the TSS at 0 bp) from oligocapping experiments that determined the TSS in each promoter region.
2.1.2 The mock PPR datasets for statistical controls
The same study also assembled 1000 mock PPR datasets, to provide random controls for our statistic, as recommended elsewhere (Marino-Ramirez et al., 2004). Each mock PPR dataset contained 4737 contiguous DNA sequences of length 3001 bp, sampled uniformly at random from NCBI build 33 of the human genome.
2.1.3 The TSS-anchored block alignment
Considering n sequences of length l aligned in an n × l block, column i of the alignment contains the i-th letter of each sequence (i = 1, . . . , l). For brevity, we call this arrangement of sequences ‘a block alignment’. In our case, the PPR dataset contained n = 4737 sequences of length l = 3001 and the corresponding block alignment anchored all TSSs in a single column. Given a particular word W, our overall statistical aim is to identify when unmasked occurrences of W form unusual clusters in nearby columns within the TSS-anchored alignment.
2.2 The word-specific random mask
On one hand, a repeat in a single alignment sequence can cause the clusters of W we seek. On the other hand, if the repeat could have regulatory functions, vigorous masking of repeats could obscure biologically interesting motifs. Since our statistical methods are enumerative and examine DNA one word at a time, we masked only the particular word W under scrutiny and no other word. In any particular sequence, if W occurred more than once, we masked all occurrences except one, randomly choosing the unmasked occurrence.
Our random mask reflects a simple rationale. On one hand, assume that a repeat has regulatory function and forms clusters in the alignment columns because of functional constraints. If the repeat contains a copy of W, the mask might not completely obscure it. On the other hand, assume that a repeat has no regulatory function and therefore is not functionally constrained to cluster in the alignment columns. Since the unmasked occurrence of W was chosen randomly, its position is not biased to the front or back of the block alignment, and on its own, the random mask cannot cause clusters. Randomization of a statistical test is theoretically undesirable, because it usually reduces the statistical power. Here, however, the avoidance of false positives from positional bias is paramount.
Our mask applies equally to all words W, and in particular, self-overlapping words cause us no unusual difficulties. In contrast, enumerative methods based on word frequencies are sometimes constrained to handle self-overlapping words quite delicately (Schbath, 1997).
2.3 Statistical methods
After masking, we identify unusual clusters of W within the TSS-anchored block alignment.
2.3.1 The local maximum statistic to evaluate clusters
Consider any block alignment, like the PPR dataset, where n sequences of length l have been arranged as an n × l block. For any particular word W containing w = 8 letters, if an unmasked instance of W has its final letter in column i, we say that W has ‘occurred at i’, where w ≤ i ≤ l. The word-specific random mask ensures that W occurs at most once in each sequence. We wish to locate occurrences of W unusually clustered in nearby columns within the block alignment.
To develop our clustering statistic, let X[i] count the number of sequences where W has occurred at i (i = w, . . . , l), and let S[i] = X[w] + · · · + X[i] be the cumulative occurrences of W up to i. With an arbitrary gap penalty a > 0, our word clustering statistic is a so-called ‘local maximum’ statistic (Spouge, 2001) corresponding to the global score S[i] − ai. The statistic is , where D[i, j] = (S[j] − aj ) − (S[i] − ai) = (S[j] − S[i])−a(j −i) for w ≤ i ≤ j ≤ l. Intuitively, D[i, j] is large if W occurs a large number S[j] − S[i] of times in a short interval j − i of columns.
To standardize a, and to avoid declaring a word W in the PPR dataset significant because of its frequency, for each word W we set a = ρν, where ρ > 0 is an adjustable constant (determined below), and ν = S[l]/(l − w + 1) is the average count per column of the word W. Thus, ρ is the factor over the background frequency ν that the word must maintain to keep D[i, j] positive over a column-interval [i, j].
2.3.2 The random model for the local maximum statistic
To determine the approximate distribution of under a random model for DNA sequences, assume that the n sequences are independent, and that the l letters of each sequence are chosen independently. Assume also that each letter is independently drawn at random with fixed frequencies from the nucleotide alphabet {A, C, G, T}. Our random mask ensures that W occurs at most once in each sequence, at a random position. Under the random model, therefore, the X[i]s are independent and identically distributed with a binomial distribution. The number of binomial trials for each X[i] is n, each trial having approximate probability π ≈ S[l]/{n(l −w + 1)} of success if n(l − w + 1) is large. If the average number ν = nπ of occurrences in each column is small, X[i] is usually 0 or 1, like a Bernoulli trial (coin toss). If lν2 is also small, S[l] is approximately Poisson distributed, with mean lν (Barbour et al., 1992, p. 8). Intuitively, one might expect that the {X[i]} approximate a Poisson process of intensity ν = S[l]/(l − w + 1) on the continuous time interval from w to l.
2.3.3 The jittering of word occurrences
Unfortunately, two octonucleotide words, a8 (i.e. aaaaaaaa) and t8, are extremely over-represented in the 4737 PPR sequences, occurring >20 000 times. Even after masking a8 (or t8), most columns in the block alignment contain it. At such high word densities, a continuous-time Poisson process could be a poor approximation to random word occurrences, which must be placed at discrete integer positions corresponding to the alignment columns.
‘Jittering’ (described immediately below) removed the technical nuisance of discreteness, improving our Poisson approximation at high word densities, while making little difference at low word densities. We examined our results both with and without jittering.
Let W occur in position i. To jitter i, add a random value chosen uniformly from the (continuous) interval [0, 1] to it. Let S(t) be the cumulative jittered occurrences of W up to the (continuous) time t, where w ≤ t ≤ l + 1. Let D(t, u) = {S(u) − au} − {S(t) − at} and be the continuous time analogs of D[i, j] and . Karlin and Dembo (1992) suggest as a statistic for assessing clustering. We calculated statistical significances in the absence of jittering, approximating the distribution of both and as follows.
2.3.4 The distribution of the local maximum statistic
Karlin and Dembo (1992) give inequalities on the P-value for the Poisson process described above. Their inequalities can be generalized to compound Poisson processes and sharpened to an exact asymptotic formula. The program COMET incorporates the general asymptotic formula (Frith et al., 2002). The formula, given next, describes an extreme value distribution (Aldous, 1989) closely akin to BLAST E-values (Karlin and Altschul, 1990; Karlin and Dembo, 1992).
As in BLAST, , where μ is an E-value (i.e. the mean of a Poisson distribution). In BLAST, the E-value μ = k mn exp(−λy), where m and n are sequence lengths. Here, the E-value is
| (1) |
where the time t = l − w + 1. The relevant scale parameter λ is the unique positive solution to the equation
| (2) |
while the relevant location parameter is
| (3) |
In the notation of Equations 6–8 of Frith et al. (2002), Equations (1)–(3) specialize the general compound Poisson process solution with the substitution Z = 1. Recent versions of BLAST include a statistical correction for edge effects (Altschul and Gish, 1996; Spouge, 2001), but for l = 3001 we omitted the correction, because it is negligible in the present context.
2.3.5 The mock PPR datasets as a negative control
The following criterion was used to determine the one adjustable parameter ρ in our local maximum statistic.
Any random model of DNA raises immediate concerns about the practical accuracy of the P-values it generates. We used the mock PPR datasets to calibrate the theoretical P-values of our statistic as follows.
First, note that the P-value of a continuous variate is uniformly distributed on the interval [0, 1], as is one minus the P-value. [This observation permits, e.g. a Monte Carlo simulation to generate any random variate from a standard uniform variate (Hammersley and Handscomb, 1964, p. 36).]
Now, index all possible DNA octonucleotides by W = 1, . . . , m, where m = 48 = 65 536, and let be the local maximum statistic [denoted by above] corresponding to the word W. Let be the corresponding P-value. As a P-value, each U [W] is uniformly distributed on [0, 1]. The counts of different words W in the block alignment can be expected to correlate only weakly. Therefore, the following calculation treats the {U [W]} as though they were independent. Let U* = min{U [W]:1 ≤ W ≤ m} be the minimum P-value over all m = 48 words. Then,
| (4) |
Thus, if the smallest P-value u for each mock PPR dataset is transformed according to Equation (4), the result should also be a uniform variate on [0, 1] [the common value in Equation (4) is, after all, one minus the P-value P (U* > u)]. For each of the 1000 mock PPR datasets, the corresponding minimum P-value U* = u was calculated. If the minimum P-values U* = u (the P-values of central interest to us) agree with the theoretical probability model, their transformed values 1 − (1 − u)m should be uniformly distributed on [0, 1]. We therefore put the 1000 values of U* from the mock PPR datasets into increasing order U*[1] ≤ · · · ≤ U*[1000], and plotted U*[i] against i/1000 for i = 1, . . . , 1000. If the plot approximates a straight line from (0, 0) to (1, 1), the theoretical result in Equation (1) agrees with P-values calculated from the mock PPR datasets (Marino-Ramirez et al., 2004).
We therefore selected our one adjustable parameter ρ = 5 to produce good agreement between the plot and a straight line, as follows. For each value of ρ in the set {1.25, 2.5, 5.0, 10.0}, we used the mock PPR datasets as a negative control, plotting U*[i] against i/1000 for i = 1, . . . , 1000. Figure 2 displays the results.
Fig. 2.

U*[i] plotted against i/1000 for i = 1, . . . , 1000 for various values of the gap penalty a = ρν, with and without jittering. Solid curves represent jittered distributions; dotted lines represent distributions without jittering. From top to bottom: the red line corresponds to ρ = 1.25, green, ρ = 2.5, brown, ρ = 5; blue, ρ = 10. The diagonal line in black represents an ideal result, where the smallest P-value in every mock PPR dataset agrees the distribution predicted by theory.
For ρ = 5, the transformed P-values from the mock PPR datasets agreed remarkably well with theoretical calculations. For all words W, therefore, we set the gap penalty a = ρν = 5ν where ν = S[l]/(l − w + 1). Thus, the gap penalty a permits the differences D[i, j] to be positive only over columns where the frequency of W is at least ρ = 5 times ν, the word’s background frequency per column.
Results with and without jittering were close for ρ ≤ 5 but differed noticeably for gap penalties ρ ≥ 10. The differences probably occurred because the significant word clusters for ρ ≥ 10 are very short, and our P-value starts to detect the discreteness of DNA sequences for over-represented words like a8 and t8. This observation reinforced our decision to fix the gap penalty in our local maximum statistic so that ρ = 5.
2.3.6 The Ruzzo–Tompa algorithm for maximal segments
Our algorithm for finding clusters of words was a mild modification of the linear-time Ruzzo–Tompa algorithm for finding all maximal segments in a set of real numbers {z[1], . . . , z[k]} (Ruzzo and Tompa, 1999). Ruzzo and Tompa give a more detailed description of their algorithm than space permits here.
In brief, a segment is a subset of {z[1], . . . , z[k]} that has the form {z[i + 1], . . . , z[j]}. The segment can be assigned a score d[i, j] = z[i + 1] + · · · + z[j]. According to Ruzzo and Tompa, a segment has ‘Property P1’ if all subsegments have a lower score. A segment is ‘maximal’, if it has Property P1, but none of its containing segments has Property P1. As a consequence of their definitions, Ruzzo and Tompa show that maximal segments are disjoint.
In our set-up, let the word W occur k times in the block alignment, at column positions T [1] ≤ · · · ≤ T [k] (some T [j]s might occur many times, if word positions are not jittered). Associate with T [j] the cumulative score s[j] = j − aT [j], since (in the absence of multiple occurrences) W occurs j times up to T [j]. The set {s[j]} of cumulative scores is the subset of global scores S[i] − ai from positions i where the word W has occurred. Other global scores can be ignored, because they do not contribute to the local maximum statistic. Define z[j] = s[j] − s[j − 1] = 1 − a{T [j] − T [j − 1]}, where s[0] = T[0] = 0. Maximal segments of {z[1], . . . , z[k]} correspond to disjoint column-intervals [i′, j′] that maximize the differences D[i′, j′], e.g. moving either end-column of [i′, j′] one position reduces the value of D[i′, j′]. We modified the Ruzzo–Tompa algorithm to determine all maximal segments of z[j], while maintaining a list of the corresponding positions and sequences where the word W occurred.
2.3.7 The P-value for a segment
To calculate statistical significance of a segment {z[i +1], . . . , z[j]}, use Equation (1) to determine y, so that . In a block alignment of random sequences, the P-value p is greater than or equal to the probability that some segmental score exceeds y. Since the maximal segments are disjoint, each segment with a segmental score d[i, j] ≥ y can be considered statistically significant.
2.4 The A-GLAM computer program
The third step in our analysis is alignment. Each statistically significant cluster, as identified by the local maximum statistic, provides positional seeds to reanchor the PPR alignment. Our A-GLAM program then optimizes a multiple local alignment to delineate putative cis-regulatory elements, always constraining the alignment to line up the seeds.
A-GLAM implements a Gibbs sampling algorithm in C++. It is a generalization of the GLAM program (Frith et al., 2002), with an option to operate in two different modes: (1) GLAM mode and (2) seed-oriented mode.
2.4.1 A-GLAM in GLAM mode
In its GLAM mode, A-GLAM mimics GLAM. Details of the GLAM algorithm appear elsewhere (Frith et al., 2004b). In brief, the GLAM algorithm takes a set of sequences as input. The initial step of GLAM places a single window of arbitrary size within every sequence at an arbitrary position, forming a gapless multiple alignment of the windowed subsequences. GLAM then performs fixed number adjustment steps. Each adjustment step either repositions or resizes the alignment windows, and it is then either accepted or rejected according to probabilities given below. A repositioning adjustment step selects one sequence uniformly at random and then repositions its window. A resizing adjustment step resizes all windows by selecting first the right and then the left end of the alignment. If GLAM decides to resize an end, it shifts the corresponding end of all alignment windows one position to either the right or the left. The resizing step leads automatically to a best window width and permits GLAM to escape from alignments that are optimal but for the positions of their ends.
In contrast to the OOPS (one occurrence per sequence) mode just described, GLAM’s ZOOPS (zero or one occurrence per sequence) option also implements a 0–1 adjustment step, either dropping or adding a sequence to the multiple alignment. Thus, the ZOOPS option leads to a final alignment that might or might not include all input sequences.
The repositioning, resizing and 0–1 steps are all probabilistic, with the S-score in Equation (5) below g overning the relevant distributions. To be specific, the probability of each permissible adjustment move is proportional to exp(s), where s is the S-score of alignment after adjustment move has taken place. The probabilistic nature of the sampling algorithm permits it to escape from local maxima of s and converge on a global maximum.
GLAM itself operates in two basic modes. One mode samples the equilibrium Boltzmann distribution exp(s); the other simulates an annealing process, lowering a temperature parameter kT to pass through states corresponding to quasi-equilibrated Boltzmann distributions exp{s/(kT)}. When the temperature parameter kT finally converges to 0, the Gibbs sampler should converge on the multiple alignment minimizing the energy −s. I n practice, however, GLAM finds good alignments reasonably well in either mode.
GLAM performs several independent runs on its input. If most runs lead to similar best alignments, a user can be confident of the alignment output.
2.4.2 A-GLAM in seed-oriented mode
The seed-oriented mode exploits positional information about regulatory elements, e.g. the positions in the statistically significant word clusters derived from the enumerative steps in our analysis. In the seed-oriented mode, A-GLAM takes a set of sequences as input, along with either: (1) a word and a subset of the input sequences or (2) a list of windows, at most one per input sequence and all of equal size. The extra input provides ‘seeds’ for the A-GLAM alignment. In both cases, although the probability of each permissible move remains proportional to exp(s), the adjustment step is subject to an extra restriction. In case (1), A-GLAM continues to align one exact copy of the ‘seed word’ in all ‘seed sequences’. In case (2), A-GLAM continues to align the original list of windows in the seed sequences. In each case, therefore, A-GLAM uses the seed sequences to direct its search in the remaining non-seed ‘target sequences’. Note that with its seed positions, case (2) can accommodate a wide range of searching strategies.
2.4.3 The overall score in A-GLAM
A-GLAM judges the merits of a multiple alignment with its overall alignment score. In bits (with all logs to the base 2), the overall score for an alignment of width w is
| (5) |
The overall score s in Equation (5) is a marginal Bayesian predictive log-odds score corresponding to an alternative hypothesis involving the Dirichlet distribution. In Equation (5), m! = m(m − 1) . . . 1 denotes a factorial; aj, the pseudo-counts for nucleic acid j in each position; a = a1 + a2 + a3 + a4, the total pseudocounts in each position; cij, the count of nucleic acid j in position i; and c = ci1 + ci2 + ci3 + ci4, the total number of aligned windows, which is independent of the position i. The rationale for the overall score s in GLAM is explained in detail elsewhere (Frith et al., 2004b). In brief, s can be computed rapidly, a desirable property for large datasets. Moreover, its expectation decreases with the increasing alignment width. Thus, the overall score s constrains the window size around a high-scoring alignment, without any ad hoc adjustments.
2.4.4 The individual score (delta S-score)
A-GLAM also assigns an E-value to individual sequences in its final alignment, much like the E-values for individual protein sequences in PSI-BLAST (Altschul and Koonin, 1998; Altschul et al., 1997; Schaffer et al., 2001).
Consider a window of length w that is about to be added to A-GLAM’s alignment. Let δ[i, j] equal 1 if the window has nucleic acid j in position i and 0 otherwise. The addition of the new window changes the overall score by
| (6) |
The score change corresponds to evaluating the new window with a position-specific scoring matrix (PSSM) that assigns the ‘individual score’
| (7) |
to nucleic acid j in position i. Equation (7) represents a log-odds score for an alternative hypothesis that places nucleic acid j in position i with probability (cij + aj)/(c + a). The probability corresponds to a frequency derived by adding the empirical counts cij to the pseudocounts aj. PSI-BLAST uses Equation (7) to calculate its E-values: the derivation with Equation (6) also confirms the PSSM in Equation (7) as the natural choice for evaluating individual sequences.
Consider a particular alignment sequence, and let Δs[i] denote the quantity in Equation (6) when the final letter in the window falls at position i of the alignment sequence. Let Δs* = max{Δs[i]:i = w, . . . , l} be the maximum individual score over all sequence positions i. We assigned an E-value to the actual value Δs*, as follows. Let l and w be the sequence length and window size. In breif, Staden’s method (Staden, 1989) yields P (ΔS ≥ Δs*) for a specific window, with its bases chosen independently and randomly from the frequency distribution {pj}. Our E-value is (l − w + 1)P (ΔS ≥ Δs*), the expected number of sequence positions with an individual score exceeding Δs*. The factor l − w + 1 is essentially a multiple test correction in the E-value.
All sequence logos (Schneider and Stephens, 1990) of predicted motifs in Figures 3–6 were generated from http://weblogo.berkeley.edu/logo.cgi (Crooks et al., 2004).
Fig. 3.
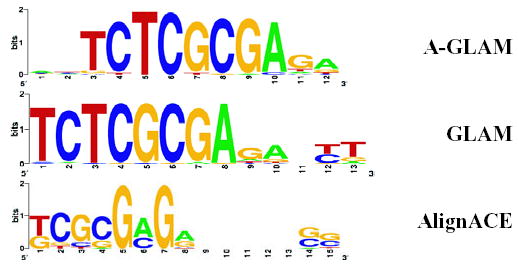
A motif identified using the seed ctcgcgag in A-GLAM overlaps with a recently discovered motif (FitzGerald et al., 2004) present near the TSS in ribosomal genes and genes involved in oxidative phosphorylation.
Fig. 6.

Using the seed aagatggc, A-GLAM identified a motif corresponding to the YY-1 transcription factor binding site near the TSS. (a) Columns of the block alignments near the TSS at column 0 are shown to be enriched with occurrences of aagatggc (multiple-test corrected local-maximum P-value 0.00). (b) Sequence logo returned by the seed-oriented mode of A-GLAM. (c) Sequence logo for the YY-1 site in TRANSFAC. (d) Columns of the block alignments near the TSS at column 0 are shown to be enriched with occurrences of the seed gccatctt (multiple-test corrected local-maximum P-value 1.66). The strand-specific difference between these reverse complements aagatggc and gccatctt is apparent.
3 RESULTS
The presence of significant words in TRANSFAC
Of the 48 different octonucleotides, only 791 were significant at P ≤ 0.05 after multiplying their P-value by 48 to correct for multiple testing. Table 1 is a 2× 2 table whose columns divide the 48 octonucleotides into two groups, those significant at P ≤ 0.05 and those that are not. Its rows divide the octonucleotides by presence or absence in the vertebrate subset of the TRANSFAC database (version 8.4) (Matys et al., 2003). Most octonucleotides in TRANSFAC are associated with at least one binding factor, according to literature references. A χ2-test (P = 4.12 × 10−42) indicates that statistically significant octonucleotides occur more frequently in TRANSFAC than chance alone can explain.
Table 1.
A 2 × 2 table of significance and presence in TRANSFAC
| Octonucleotides | Significant (P < 0.05) | Not significant (P > 0.05) |
|---|---|---|
| In TRANSFAC | 388 | 17 400 |
| Not in TRANSFAC | 413 | 47 335 |
Comparison of A-GLAM, GLAM and AlignACE
Our test sequences sets were constructed from human PPRs containing known transcription factor binding sites: some were previously used to test GLAM (Frith et al., 2004a). Only AlignACE (Hughes et al., 2000) had computational difficulties when the input sequences were on a genomic scale.
In its GLAM mode, A-GLAM found essentially the same regulatory motifs as GLAM and AlignACE (data not shown). On many sequence sets containing numerous annotated, well-defined binding sites, therefore, the motif A-GLAM returned was located upstream of an appropriate set of genes and was consistent with the consensus sequence in the literature.
In seed-oriented mode, however, A-GLAM occasionally returned more satisfactory motifs than GLAM or AlignACE. Figure 3, shows a motif found in ribosomal genes and genes involved in oxidative phosphorylation. Figure 4 shows a TRANSFAC motif in NRF-1 that A-GLAM returned from the seed gcgcatgc. Figure 5 shows that the seed-oriented mode of A-GLAM identified the TATA box, whereas GLAM returned an alignment that could not be identified among known motifs. Finally, Figure 6 shows a Y Y-1 transcription factor binding site that A-GLAM returned from the seed aagatggc.
Fig. 4.

Using the seed gcgcatgc, A-GLAM identified a motif in TRANSFAC corresponding to the NRF-1 factor (NF-kappaB-repressing factor). (a) Columns of the block alignments near the TSS at column 0 are shown to be enriched with occurrences of gcgcatgc. (b) Shows a sequence logo of the corresponding motif in TRANSFAC. (c) Displays the motif A-GLAM produced from the seed gcgcatgc.
Fig. 5.

Using the seed tataaaaa, A-GLAM identified a motif corresponding to the enriched TATA box. AlignACE was unable to return a motif from the input, whereas GLAM returned a motif that could not be identified.
4 DISCUSSION
We have developed a two-step method for identifying cis-acting regulatory elements in human promoter regions. First, an enumerative step determines P-values for each possible octonucleotide word. Our local maximum statistic evaluates each word’s tendency to cluster in a block alignment anchored on the TSS. A χ2-test on a 2 × 2 table (P = 4.12 × 10−42) shows that the statistic does indeed identify biologically relevant DNA words. Second, an alignment step uses either words or positions from the first step as ‘seeds’. Our Gibbs sampler program A-GLAM optimizes a multiple alignment while constraining it to contain the seeds. The idea of combining enumerative and alignment methods was first put forward by Ohler and Niemann (2001), but ours appears to be its first practical implementation.
Low-complexity regions, such as Alu repeats or tracts of poly(A), often distract Gibbs samplers from subtle but biologically interesting signals (Frith et al., 2004a), because the regions deviate noticeably from theoretical approximations to the true distribution of ‘random DNA’. The standard strategy against repeats is to mask them with programs, such as Repeat-Masker (Smit et al., 1996, http://www.repeatmasker.org). Unfortunately, masking can obscure regulatory elements associated with the low-complexity region. Our word-specific random mask avoids many problems associated with low-complexity regions. As an example of our methods, the local maximum statistic is able to identify aaaaaaaa as a word with no specific clustering tendencies (multiple-test corrected P-value = 6.5e+03 after jittering) despite its over-abundance in our human promoter dataset. Because A-GLAM’s seeds automatically focus it on a motif of interest, A-GLAM does not require repetitive elements to be masked during Gibbs sampling.
Anchored alignments might speed the investigation of RNA splicing signals, non-coding RNA processing signals, origins of replication and 3′ regulatory elements. Moreover, recent efforts to identify and delineate the transcribed regions of the human genome (Bertone et al., 2004) and to map transcription factor binding sites along chromosomes (Cawley et al., 2004) provide potential alignment anchors. Our methods therefore seem well adapted for identifying the corresponding regulatory elements.
Acknowledgments
We gratefully acknowledge the many useful conversations with Drs Martin C. Frith and Zhiping Weng. We also thank the referees for their suggestions which improved the paper considerably.
References
- Aldous,D. (1989) Probability Approximations via the Poisson Clumping Heuristic. Springer-Verlag, New York.
- Altschul SF, Gish W. Local alignment statistics. Methods Enzymol. 1996;266:460–480. doi: 10.1016/s0076-6879(96)66029-7. [DOI] [PubMed] [Google Scholar]
- Altschul SF, Koonin EV. Iterated profile searches with PSI-BLAST—a tool for discovery in protein databases. Trends Biochem Sci. 1998;23:444–447. doi: 10.1016/s0968-0004(98)01298-5. [DOI] [PubMed] [Google Scholar]
- Altschul SF, Madden TL, Schaffer AA, Zhang J, Zhang Z, Miller W, Lipman DJ. Gapped BLAST and PSI-BLAST: a new generation of protein database search programs. Nucleic Acids Res. 1997;25:3389–3402. doi: 10.1093/nar/25.17.3389. [DOI] [PMC free article] [PubMed] [Google Scholar]
- Bailey TL, Elkan C. Unsupervised learning of multiple motifs in biopolymers using expectation maximization. Machine Learning. 1995;21:51–83. [Google Scholar]
- Barbour,A.D., Holst,L. and Janson,S. (1992) Poisson Approximation. Clarendon Press, Oxford.
- Bertone P, Stolc V, Royce TE, Rozowsky JS, Urban AE, Zhu X, Rinn JL, Tongprasit W, Samanta M, Weissman S, Gerstein M, Snyder M. Global identification of human transcribed sequences with genome tiling arrays. Science. 2004;306:2242–2246. doi: 10.1126/science.1103388. [DOI] [PubMed] [Google Scholar]
- Cawley S, Bekiranov S, Ng HH, Kapranov P, Sekinger EA, Kampa D, Piccolboni A, Sementchenko V, Cheng J, Williams AJ, et al. Unbiased mapping of transcription factor binding sites along human chromosomes 21 and 22 points to widespread regulation of noncoding RNAs. Cell. 2004;116:499–509. doi: 10.1016/s0092-8674(04)00127-8. [DOI] [PubMed] [Google Scholar]
- Crooks GE, Hon G, Chandonia JM, Brenner SE. Weblogo: a sequence logo generator. Genome Res. 2004;14:1188–1190. doi: 10.1101/gr.849004. [DOI] [PMC free article] [PubMed] [Google Scholar]
- FitzGerald PC, Shlyakhtenko A, Mir AA, Vinson C. Clustering of DNA sequences in human promoters. Genome Res. 2004;14:1562–1574. doi: 10.1101/gr.1953904. [DOI] [PMC free article] [PubMed] [Google Scholar]
- Frith MC, Fu Y, Yu L, Chen JF, Hansen U, Weng Z. Detection of functional DNA motifs via statistical over-representation. Nucleic Acids Res. 2004a;32:1372–1381. doi: 10.1093/nar/gkh299. [DOI] [PMC free article] [PubMed] [Google Scholar]
- Frith MC, Hansen U, Spouge JL, Weng Z. Finding functional sequence elements by multiple local alignment. Nucleic Acids Res. 2004b;32:189–200. doi: 10.1093/nar/gkh169. [DOI] [PMC free article] [PubMed] [Google Scholar]
- Frith MC, Spouge JL, Hansen U, Weng Z. Statistical significance of clusters of motifs represented by position specific scoring matrices in nucleotide sequences. Nucleic Acids Res. 2002;30:3214–3224. doi: 10.1093/nar/gkf438. [DOI] [PMC free article] [PubMed] [Google Scholar]
- Hammersley,J.M. and Handscomb,D.C. (1964) Monte Carlo Methods. Chapman and Hall, London.
- Hughes JD, Estep PW, Tavazoie S, Church GM. Computational identification of cis-regulatory elements associated with groups of functionally related genes in Saccharomyces cerevisiae. J Mol Biol. 2000;296:1205–1214. doi: 10.1006/jmbi.2000.3519. [DOI] [PubMed] [Google Scholar]
- Karlin S, Altschul SF. Methods for assessing the statistical significance of molecular sequence features by using general scoring schemes. Proc Natl Acad Sci USA. 1990;87:2264–2268. doi: 10.1073/pnas.87.6.2264. [DOI] [PMC free article] [PubMed] [Google Scholar]
- Karlin S, Dembo A. Limit distributions of maximal segmental score among Markov-dependent partial-sums. Adv Appl Probab. 1992;24:113–140. [Google Scholar]
- Lawrence CE, Altschul SF, Boguski MS, Liu JS, Neuwald AF, Wootton JC. Detecting subtle sequence signals: a Gibbs sampling strategy for multiple alignment. Science. 1993;262:208–214. doi: 10.1126/science.8211139. [DOI] [PubMed] [Google Scholar]
- Levine M, Tjian R. Transcription regulation and animal diversity. Nature. 2003;424:147–151. doi: 10.1038/nature01763. [DOI] [PubMed] [Google Scholar]
- Marino-Ramirez L, Spouge JL, Kanga GC, Landsman D. Statistical analysis of over-represented words in human promoter sequences. Nucleic Acids Res. 2004;32:949–958. doi: 10.1093/nar/gkh246. [DOI] [PMC free article] [PubMed] [Google Scholar]
- Matys V, Fricke E, Geffers R, Gossling E, Haubrock M, Hehl R, Hornischer K, Karas D, Kel AE, Kel-Margoulis OV, et al. Transfac: transcriptional regulation, from patterns to profiles. Nucleic Acids Res. 2003;31:374–378. doi: 10.1093/nar/gkg108. [DOI] [PMC free article] [PubMed] [Google Scholar]
- Ohler U, Niemann H. Identification and analysis of eukaryotic promoters: recent computational approaches. Trends Genet. 2001;17:56–60. doi: 10.1016/s0168-9525(00)02174-0. [DOI] [PubMed] [Google Scholar]
- Ruzzo,W.L. and Tompa,M. (1999) In Seventh International Conference on Intelligent Systems for Molecular Biology, Heidelberg, Germany.
- Schaffer AA, Aravind L, Madden TL, Shavirin S, Spouge JL, Wolf YI, Koonin EV, Altschul SF. Improving the accuracy of PSI-BLAST protein database searches with composition-based statistics and other refinements. Nucleic Acids Res. 2001;29:2994–3005. doi: 10.1093/nar/29.14.2994. [DOI] [PMC free article] [PubMed] [Google Scholar]
- Schbath S. An efficient statistic to detect over- and under-represented words in DNA sequences. J Comput Biol. 1997;4:189–192. doi: 10.1089/cmb.1997.4.189. [DOI] [PubMed] [Google Scholar]
- Sinha S, Tompa M. Discovery of novel transcription factor binding sites by statistical overrepresentation. Nucleic Acids Res. 2002;30:5549–5560. doi: 10.1093/nar/gkf669. [DOI] [PMC free article] [PubMed] [Google Scholar]
- Smit,A., Hubley,R. and Green,P. (1996) Repeatmasker.
- Spouge JL. Finite-size correction to Poisson approximations of rare events in renewal processes. J Appl Prob. 2001;38:554–569. [Google Scholar]
- Staden R. Methods for calculating the probabilities of finding patterns in sequences. Comput Appl Biosci. 1989;5:89–96. doi: 10.1093/bioinformatics/5.2.89. [DOI] [PubMed] [Google Scholar]
- Van Helden J, Andre B, Collado-Vides J. Extracting regulatory sites from the upstream region of yeast genes by computational analysis of oligonucleotide frequencies. J Mol Biol. 1998;281:827–842. doi: 10.1006/jmbi.1998.1947. [DOI] [PubMed] [Google Scholar]