Abstract
A combined optical positron emission tomography (OPET) system is capable of both optical and PET imaging in the same setting, and it can provide information/interpretation not possible in single-mode imaging. The scintillator array here serves the dual function of coupling the optical signal from bioluminescence/fluorescence to the photodetector and also of channeling optical scintillations from the gamma rays. We report simulation results of the PET part of OPET using GATE, a Geant4 simulation package. The purpose of this investigation is the definition of the geometric parameters of the OPET tomograph. OPET is composed of six detector blocks arranged in a hexagonal ring-shaped pattern with an inner radius of 15.6 mm. Each detector consists of a two-dimensional array of 8 × 8 scintillator crystals each measuring 2 × 2 × 10 mm3. Monte Carlo simulations were performed using the GATE software to measure absolute sensitivity, depth of interaction, and spatial resolution for two ring configurations, with and without gantry rotations, two crystal materials, and several crystal lengths. Images were reconstructed with filtered backprojection after angular interleaving and transverse one-dimensional interpolation of the sinogram. We report absolute sensitivities nearly seven times that of the prototype microPET at the center of field of view and 2.0 mm tangential and 2.3 mm radial resolutions with gantry rotations up to an 8.0 mm radial offset. These performance parameters indicate that the imaging spatial resolution and sensitivity of the OPET system will be suitable for high-resolution and high-sensitivity small-animal PET imaging.
Index Terms: GATE, Monte Carlo, optical, positron emission tomography (PET)
I. Introduction
MONTE CARLO simulations have become an important tool in the design of new positron emission tomography (PET) and single photon emission computed tomography (SPECT) systems. A well-validated simulation software allows investigators to acquire statistically significant data about various performance parameters of their new systems, and perhaps more importantly to make modifications accordingly. Monte Carlo simulations are also popular to assess the theoretical performance of a large range of algorithms for image reconstruction, scatter correction, depth of interaction (DOI), and protocol optimization [1]. Although Monte Carlo simulations are CPU-intensive applications, they are well accepted to be the most powerful methods to accurately evaluate the performance of PET tomographs [2]. In this context, we are currently developing a combined optical and PET (OPET) system for small-animal imaging, and the purpose of this paper is to characterize the performance of the PET part of OPET through Monte Carlo simulations.
OPET [3]-[5] is capable of simultaneously imaging molecular probes that can coexpress both bioluminescence and PET signals with the same promoter [6]. The purpose of this system is to assist in the development of translational research from molecular biology and in the evaluation of the relative sensitivity/specificity/spatial resolution of new molecular imaging probes as a function of their organ and tissue biodistribution. The design of such a system should not compromise performance parameters for either of individual modalities, and parameters like spatial resolution and absolute sensitivity should be similar to those of state-of-the-art systems. However, OPET is an unconventional scanner, with few detector blocks and small gantry radius relative to the crystal lengths, and it is not absolutely clear whether such a system can deliver performance similar to those of commercially available small-animal PET systems. Therefore, the purpose of this study is to characterize the performance of the PET part of OPET for different geometrical configurations and system settings through Monte Carlo simulations. Specifically, we will study absolute sensitivity, DOI, and spatial resolution for various crystal lengths, crystal materials, energy windows, and ring geometric configurations.
The simulation toolkit we have chosen to conduct the experiments is the Geant4 Application for Tomographic Emission (GATE) [7], [8]. GATE is an object-oriented software toolkit that is built on top of Geant4 and provides a large variety of classes for designing and building PET and SPECT systems. Probably one of the most convenient features of GATE is that it allows the construction of complex systems through the use of a very simple scripting language. In only a few lines, the user can design full-fledged systems and experiments, detectors with different crystal materials, phantoms with or without active sources, scanners with or without motion, etc.
II. Methods
A. OPET System
A basic OPET detector module consists of a flat array of 8 × 8 scintillator crystals of sizes 2 × 2 × 10 mm3 with an inter-crystal gap of 0.25 mm in both directions. The scintillator material can be chosen between gadolinium orthosilicate (GSO) and lutetium oxyorthosilicate (LSO), based on the combined performance of their PET and optical properties. The scintillator array serves the dual role of detecting the annihilation photons as well as coupling/collimating the optical signal from the surface of the animal to a photodetector attached to the scintillator array. OPET is a contact-imaging device in the sense that the crystal elements must be as close as possible to the animal under study to provide adequate focusing of the light photons coming from the bioluminescence emissions. Therefore, the detectors are arranged in a hexagonal ring as shown in Fig. l(a) with a distance of only 15.6 mm from the center of the ring to the crystal face of the detector, allowing a 3.12 cm transverse field of view (FOV). The axial FOV for one ring of detectors is 17.75 mm.
Fig. 1.
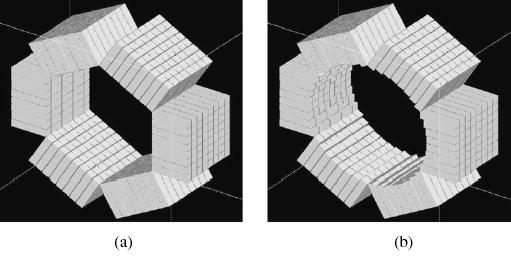
OPET detector designs, (a) Flat, (b) Curved.
An alternative OPET design consists of curved front scintillator detectors providing a homogeneous subject detector contact surface in all radial directions and, herefore, better light focusing capabilities than the flat design. In this study, we approximate the ideal curved detector geometry with varying crystal lengths as illustrated in Fig. l(b) such that the distance from the center of the FOV to the face of any crystal element is constant and equal to 17.47 mm. The transverse FOV in this case is approximately 3.49 cm, which represents a 12% increase in the transverse FOV with respect to the flat design. Table I summarizes the most relevant system parameters of OPET.
TABLE I.
OPET System Parameters
| Parameter | Flat OPET |
|---|---|
| Crystal material | GSO/LSO |
| Crystal size | 2.0x2.0x10 mm3 |
| Crystal pitch | 0.25 mm |
| Crystal array | 64 (8x8 crystals/PMT) |
| Number of detectors | 6 (1 ring) |
| Number of crystals | 384 |
| Ring diameter | 15.6 mm |
| Axial FOV | 17.75 mm |
| Transverse FOV | 31.2 mm |
B. Sensitivity
In order to measure absolute sensitivity, a 0.25 mm radius point source was located in the center of the FOV, and the ratio between the number of detected true coincidences (prompts minus randoms) and total activity of the frame was computed. Since the point source was embedded in a 1 mm radius spherical water phantom, attenuation effects were considered negligible. No correction for scatter was performed. The activity of the source was set to 1 MBq, and the acquisition lasted 5 s. Sensitivity was measured for both flat and curved configurations and for 10, 15, and 20 mm crystal lengths without changing the scanner radius. Two crystal materials, LSO and GSO, were simulated at three energy windows around the 511 keV photopeak. The upper level discriminator (ULD) was set to 650 keV, while the lower level discriminator (LLD) was set to 250, 350, and 450 keV All experiments in this paper were simulated with an energy resolution of 26% and a coincidence timing window of 10 ns.
C. Depth of Interaction
The determination of average DOI (ADOI) is very important to improve spatial resolution in small-diameter PET systems. The radial elongation artifact seen in PET images is produced by 511 keV photons that strike crystals at oblique angles and usually penetrate adjacent crystals before interacting. If the sinogram histogramming algorithm does not have knowledge of DOI, it assumes that the interaction occurred at the wrong location of the crystal, and thus, it assigns the coincidence event to the wrong line of response (LOR). Independently of the method used to estimate DOI, it is usually assumed that DOI is the same for each crystal around the ring. If the ring diameter is large, this assumption is probably correct, but for OPET, whose ring diameter is 7.6 times smaller than that of microPET P4 [9], this assumption does not hold. Therefore, our objective was to measure DOI for each individual crystal around the ring and use that information during sinogram histogramming. Since the experiment was performed with a point source in the center of the FOV, the DOI for a given crystal was computed as the average DOI of all those crystals with similar relative positions around the ring. The simulation setup was as follows: a point source of radius 0.5 mm and activity 10 MBq at the center of the FOV. The ULD was set to 650 keV, and the LLD was set to 250, 350, and 450 keV
D. Histogramming
When 1) the DOI is assumed to be constant for all crystals, 2) the ring diameter is relatively large, and 3) the intermodule gaps are small compared to the scanner diameter, it can be assumed that LORs are evenly distributed in angular and linear directions. Since OPET does not satisfy any of the above requirements, a special histogramming procedure was implemented in order to reconstruct with filtered backprojection (FBP). First, DOI information was used to compute the exact position of each LOR, resulting in the "lornogram" shown in Fig. 2. In this figure, LORs are not plotted by rows and columns but by their absolute position on the projection space. Second, and since there are 48 crystals in a ring, angular interleaving was performed resulting in 24 angular projections. Finally, linear interpolation was carried out in the radial direction with 48 samples. The large unsampled areas in the lornogram shown in Fig. 2 are due to the fact that the interblock gaps are large relative to the overall size of the scanner. To reduce the effects of these gaps on image quality, gantry rotations were also simulated for the curved detector design. Specifically, data were acquired in a step-and-shoot mode at four separate frames of equal duration at 0°, 15°, 30°, and 45°, and all LOR’s were collected in a single lornogram. The number of angles for the sinogram was chosen to be the number of angular samples at the center of the lornogram after these rotations, which in this case was 61.
Fig. 2.
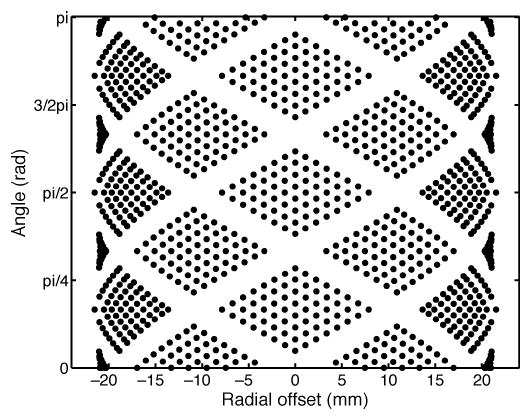
"Lomogram" for curved OPET. Each point represents the exact location of an LOR in projection space.
E. Spatial Resolution
To measure spatial resolution, a point source of radius 0.25 mm was positioned at 29 transverse locations relative to the center of the FOV and at 0.5 mm increments. Emission data were acquired for all three scanner designs: flat and curved with no gantry rotations, and curved with gantry rotations.
For the case of LSO, the activity of the point source was set to 10 MBq, and the scan duration to 3 s, resulting in an average of 158 counts per LOR. In order to get similar statistics for the case of GSO, the activity of the point source was doubled to 20 MBq. All resolution experiments were performed with a 3500–650 keV energy window, GSO and LSO crystal materials, and 10 mm deep crystals. Images of 128 × 128 pixels were reconstructed with two-dimensional FBP with ramp filter, and the full-width at half-maximum (FWHM) and the full-width at tenth-maximum (FWTM) were measured for radial and transverse directions.
III. Results
A. Sensitivity
Sensitivity results are summarized in Tables II and III. Flat OPET sensitivity at 350–650 keV is comparable to commercial state-of-the-art systems and nearly seven times higher than that of the prototype microPET, at the same energy window and crystal sizes [10]. This result was in accord with the fact that OPET solid angle is 11 times larger than that of microPET. For the curved OPET with maximum length crystal of 10 mm, which overall has 10% less crystal material than the flat OPET, sensitivity at 350–650 keV was 2.04% and 1.05% for LSO and GSO, respectively.
TABLE II.
Flat OPET Sensitivity
| 250–650 keV | 350–650 keV | 450–650 keV | ||||
|---|---|---|---|---|---|---|
| Crystal length | LSO | GSO | LSO | GSO | LSO | GSO |
| 10 mm | 3.48% | 2.08% | 2.78% | 1.47% | 1.91% | 0.96% |
| 15 mm | 5.29% | 3.29% | 4.31% | 2.38% | 2.97% | 1.59% |
| 20 mm | 6.58% | 4.23% | 5.41% | 3.12% | 3.78% | 2.09% |
TABLE III.
Curved OPET Sensitivity
| 250–650 keV | 350–650 keV | 450–650 keV | ||||
|---|---|---|---|---|---|---|
| Crystal length | LSO | GSO | LSO | GSO | LSO | GSO |
| 10 mm | 2.61% | 1.53% | 2.04% | 1.05% | 1.39% | 0.69% |
| 15 mm | 4.36% | 2.67% | 3.51% | 1.91% | 2.40% | 1.26% |
| 20 mm | 5.64% | 3.58% | 4.61% | 2.63% | 3.17% | 2.74% |
B. Depth of Interaction
Fig. 3 shows a transverse view of the flat and curved OPET along with a subset of all the interaction points (gray points) and their corresponding averages (black circles) in DOI experiments. The point source is in the center of the FOV irradiating isotropically in all three dimensions. This figure clearly demonstrates the fact that DOI is not the same for different crystals in a block. It also shows that the curved OPET produces a better approximation than the flat OPET to a uniform DOI. This approximation can be quantized as the deviation fraction to a uniform DOI. For curved OPET, the maximum deviation to a uniform interaction radius is 4%, and for flat OPET it is 9%. These variations need to be included during sinogram histogramming to improve event positioning accuracy and spatial resolution. The results shown here are for a 350–650 keV energy window and LSO crystal material.
Fig. 3.
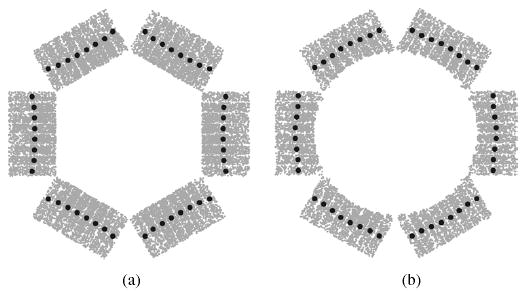
DOI patterns for (a) flat and (b) curved OPET. Gray circles are GATE simulated interaction points between gamma rays and crystals. Black circles are averages per crystal per block. The curved DOI pattern is a better approximation to a uniform DOI than the flat one.
C. Spatial Resolution
Fig. 4 displays sinograms and images of a point source at radial positions 0.0 and 8.5 mm, for curved OPET with no gantry rotations. Sinograms have 24 angular samples and 48 linear samples, and images were reconstructed onto a 128 × 128 pixel grid. The intercrystal gaps are clearly visible in both sinograms producing the angular artifacts seen in their corresponding images. The image in Fig. 4(b) is a typical example of the combined effects of angular undersampling, missing data, and crystal penetration. It is worth mentioning that the uncertainty in event positioning due to DOI in OPET is approximately 30%, in contrast to 5% for typical small-animal systems and 2.5% for clinical systems. These effects are partially ameliorated when introducing gantry rotations as shown in Fig. 5 where the gaps have been filled and the angular artifacts reduced. The sinograms now have 61 angular samples and the same number of linear samples as before. It can also be observed, at least visually, that there is no significant gain on resolution, which is an expected result because resolution is mainly determined by the crystal size. These qualitative statements can be quantified by measuring resolution.
Fig. 4.
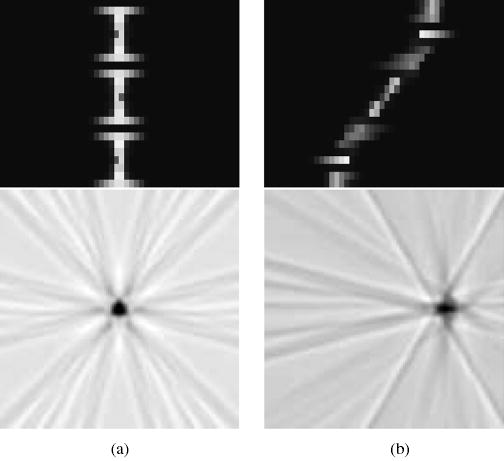
Sinograms and reconstructed images for curved OPET with no gantry rotation for two offset positions: (a) 0.0 mm. (b) 8.5 mm.
Fig. 5.
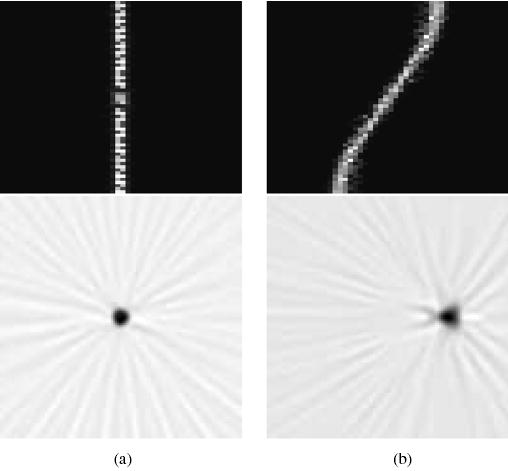
Sinograms and reconstructed images for curved OPET with gantry rotations for two offset positions: (a) 0.0 mm. (b) 8.5 mm.
Fig. 6 compares resolution between flat and curved OPET equipped with GSO crystals, without gantry rotations. Overall, both designs have similar radial and tangential resolution over the entire FOV. Tangential resolution remains approximately uniform up to a 8.0 mm offset with an average value of 2.0 mm FWHM. The large jumps in resolution in these plots are mainly due to errors introduced by intercrystal gaps, sinogram interpolation, and DOI inaccuracies and are not caused by statistical noise.
Fig. 6.
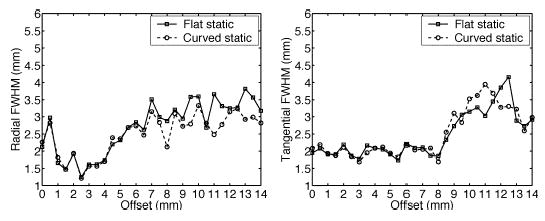
(Left) Radial and (right) tangential resolution plots for flat and curved OPET with no gantry rotations using GSO crystals.
The effects of gantry rotations on resolution are shown in Fig. 7. Once again, the most significant improvement is in tangential resolution, which goes from an average of 3.2 mm FWHM down to 2.7 mm FWHM for offsets larger than 9.0 mm. When resolutions are measured by the FWTM as shown in Fig. 8, radial and tangential resolutions with gantry rotations are superior to their counterpart without rotations. This is due to the increased angular sampling which results in lower sidelobes around the reconstructed point source.
Fig. 7.
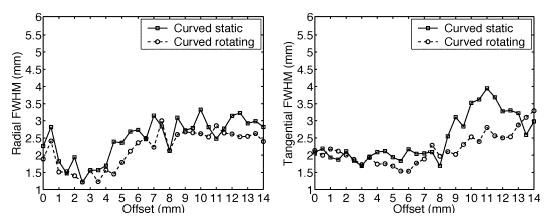
(Left) Radial and (right) tangential resolution plots for curved OPET with and without gantry rotations using GSO crystals.
Fig. 8.
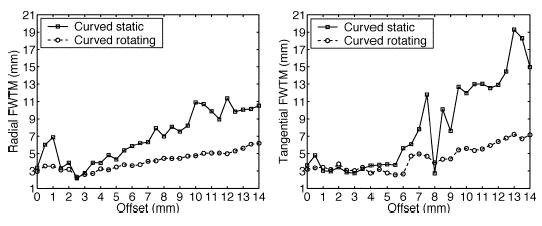
(Left) Radial and (right) tangential FWTM for curved OPET with and without gantry rotations using GSO crystals.
In terms of crystal material for OPET, our simulations indicate that GSO and LSO produce similar spatial resolutions for all scanner configurations. As an example, Fig. 9 compares radial and tangential FWHM for curved OPET with gantry rotations for GSO and LSO.
Fig. 9.
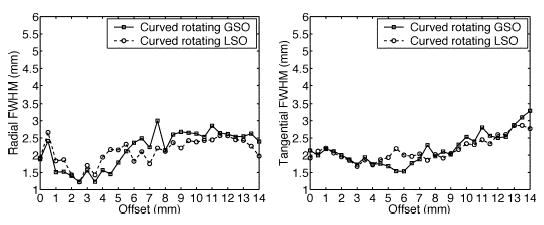
Comparison of resolution for OPET between GSO and LSO for rotating curved OPET. (Left) Radial. (Right) Tangential.
IV. Conclusion
We have performed Monte Carlo simulations to characterize the PET performance of OPET, a novel imaging tomograph. These simulations did not directly measure the noise performance of the proposed system, which is dependent on count gathering capability, random and scatter coincidences, as well as on spatial sampling and its uniformity. The simulation results for absolute sensitivity indicate that the proposed system will have sensitivity in the same range as state-of-the-art dedicated small-animal imaging systems and similar spatial resolution. More detailed simulations and ultimately real measurements will be required to determine if this sensitivity will also translate to corresponding image noise versus resolution properties. Although the novel curved detector design only improves slightly tangential resolution, it provides a 12% larger FOV than the flat design. We also anticipate that the curved detectors will provide better focusing of the optical signal than the flat design. These experiments suggest that gantry rotations are necessary to reduce the errors introduced by the large intercrystal gaps, when linear reconstruction algorithms are used. The simulations have also shown that the FWHM for LSO and GSO are similar, leaving the choice of crystal material for OPET mostly dependent on their respective optical properties.
Although the results presented here are encouraging, we hope to further improve spatial resolution and reduce image artifacts by fully modeling the data formation process. In this context, we are currently using GATE to compute OPET detector response and use it in a statistical reconstruction algorithm.
Acknowledgments
The authors would like to thank the Gate collaboration team for allowing them to use the Gate software. Special thanks go to D. Strul, G. Santin, S. Jan, and C. Morel.
Footnotes
This work was supported in part by the National Institutes of Health under Grants EB 001458 and R24 CA 92865 and in part by the U.S. Department of Energy under Contract DE-FC03-02ER63420.
References
- 1.Buvat I, Castiglioni I. "Monte Carlo simulations in SPET and PET,". Q J Nucl Med. 2002;46:48–61. [PubMed] [Google Scholar]
- 2.Michel C, Bol A, Spinks T, Townsend D, Bailey D, Grootoonk S, Jones T. "Assesment of response function in two PET scanners with and without interplane septa,". IEEE Trans Med Imag. 1991 Sept;10:240–248. doi: 10.1109/42.97571. [DOI] [PubMed] [Google Scholar]
- 3.Chatziioannou AF, Prout DL, Kohli V. "Design of a combined optical and PET small animal imaging system,". Molec Imag Bio. 2003;5(3):p. 102. [Google Scholar]
- 4.Prout DL, Silverman RW, Chatziioannou AF. "Detector concept for OPET—A combined PET and optical imaging system,". IEEE Trans Nucl Sci. 2004 June;:752–756. doi: 10.1109/TNS.2004.829736. [DOI] [PMC free article] [PubMed] [Google Scholar]
- 5.———, "Readout of the optical PET (OPET) detector," IEEE Trans. Nucl. Sci., 2004, to be published. [DOI] [PMC free article] [PubMed]
- 6.Ray P, Wu AM, Gambhir SS. "Optical bioluminescence and positron emission tomography imaging of a novel fusion reporter gene in tumor xenografts of living mice,". Cancer Res. 2003;63:1160–1165. [PubMed] [Google Scholar]
- 7.Agostinelli S, et al. "Geant4-a simulation toolkit,". J Nucl Instrum Meth Phys Res A. 2003;506:250–303. [Google Scholar]
- 8.Jan S, et al. "GATE: A simulation toolkit for PET and SPECT,". Phys Med Biol. 2004;49:4543–4561. doi: 10.1088/0031-9155/49/19/007. [DOI] [PMC free article] [PubMed] [Google Scholar]
- 9.Tai YC, Chatziioannou AF, Siegel S, Young J, Newport D, Goble RN, Nutt RE, Cherry SR. "Performance evaluation of the microPET P4: A PET system dedicated to animal imaging,". Phys Med Biol. 2001;46:1845–1862. doi: 10.1088/0031-9155/46/7/308. [DOI] [PubMed] [Google Scholar]
- 10.Chatziioannou AF, Cherry SR, Shao Y, Silverman RW, Meadors K, Farquhar TH, Pedarsani M, Phelps ME. “Performance evaluation of microPET: A high-resolution Lutetium Oxyorthosilicate PET scanner for animal imaging,”. J Nucl Med. 1999 July;40(no 7) [PMC free article] [PubMed] [Google Scholar]


