

Abstract
To optimize simulations of CW EPR spectra for high-spin Fe(III) with zero-field splitting comparable to the EPR quantum, information is needed on the factors that contribute to the line shapes and line widths. Continuous wave electron paramagnetic resonance (EPR) spectra obtained for iron transferrin carbonate from 4 to 150 K and for iron transferrin oxalate from 4 to 100 K did not exhibit significant temperature dependence of the line shape, which suggested that the line shapes were not relaxation determined. To obtain direct information concerning the electron spin relaxation rates, electron spin echo and inversion recovery EPR were used to measure T1 and Tm for the high-spin Fe(III) in iron transferrin carbonate and iron transferrin oxalate between 5 and 20–30 K. For comparison with the data for the transferrin complexes, relaxation times were obtained for tris(oxalato)ferrate(III). The relaxation rates are similar for the three complexes and do not exhibit a strong dependence on position in the spectrum. Extrapolation of the observed temperature dependence of the relaxation rates to higher temperatures gives values consistent with the conclusion that the CW line shapes are not relaxation determined up to 150 K.
Introduction
For high-spin Fe(III) with zero-field splitting (zfs1) comparable to or greater than the EPR quantum some, but not all, transitions are EPR-observable. Therefore, to quantitate overlapping contributions to EPR spectra for these systems, it is necessary to computer simulate the spectra. Quantitation then is limited by the accuracy of the simulations.2 In designing the simulations, it is important to assess factors that determine line shapes and line widths. In simulations of CW EPR spectra of FeTfoxalate and FeTfCO3 line shape details were interpreted in terms of a distribution in zero-field splittings.2–4 Another factor that could potentially contribute to the observed line widths is electron spin relaxation. To determine the extent to which electron spin relaxation contributes to the line widths in the X-band CW spectra, the electron spin relaxation rates for FeTfoxalate and FeTfCO3 were measured by electron spin echo and inversion recovery at temperatures between 5 and 20–30 K. For comparison with the data for the transferrin complexes, electron spin relaxation rates also were obtained for tris(oxalato)-ferrate (III) (Fe(ox)33−).
Experimental Section
Samples of FeTfoxalate and FeTfCO3 (4 mM) were prepared from Sigma holotransferrin by dialysis into buffers containing 0.4 M HEPES and either 140 mM sodium oxalate or 20 mM sodium carbonate. Nitrogen was bubbled through the oxalate buffer to remove carbon dioxide. The dialysis solution was changed once for each solution, and the samples were mixed with an equal volume of glycerol (Sigma molecular biology grade) to give final concentrations of 2 mM FeTf with 70 mM oxalate or 10 mM carbonate.
Fe(ox)33− was prepared by method 2 of Collison and Powell.5 Solutions for EPR studies contained 1 mM potassium oxalate and 0.3 or 1.2 mM Fe(ox)33− in 1:1 v/v water–glycerol.
A 200 μL aliquot of solution in 4 mm o.d. quartz tubes was degassed by three freeze–pump–thaw cycles, and the tubes were back-filled with helium gas. Samples were stored in liquid nitrogen and kept frozen during insertion into the EPR cryostat.
Continuous wave (CW) and pulsed EPR data at ca. 9.4 GHz and temperatures between 5 and 30 K were obtained on a Bruker ESP380E spectrometer equipped with a split-ring resonator and an Oxford CF935 liquid helium cryostat. The Oxford temperature readout was calibrated with a Lakeshore 820 readout connected to a TG-120PL GaAlAs diode immersed in silicone oil in a 4 mm o.d. quartz EPR tube that replaced the sample tube. For spin echo and inversion recovery experiments the split-ring resonator was overcoupled to a Q of about 150, which permitted echo decays to be recorded starting 64 ns after the second pulse. The value of Q was calculated from the cavity ring-down time.6
Two-pulse echo decays were recorded with a π/2–τ–π–τ–echo sequence and 40 and 80 ns pulses. These pulses are more selective and therefore excite less proton modulation than shorter pulses, which facilitates determination of the spin echo phase memory time, Tm. The microwave power was adjusted to give maximum echo intensity at the magnetic field that gave the strongest echo, which was about 1600 G. The pulse turning angle depends on S for the paramagnetic center and ms for a transition, as well as the length of the pulse and the microwave magnetic field, B1.7–9 When the zfs is of the order of the EPR quantum, as is the case for FeTfoxalate, FeTfCO3, and Fe(ox)33−, there is extensive mixing of states with different values of ms and transitions cannot be identified with individual values of ms. The microwave power, B1, required to give maximum echo intensity for these Fe(III) samples was about ⅓ of that required for an S = ½ organic radical, which is reasonable for S = 5/2. The B1 required for maximum echo intensity was not strongly dependent upon position in the spectrum, which is consistent with the expectation that the transitions involve combinations of ms values. A field-swept echo-detected spectrum of a sample containing buffer in water–glycerol demonstrated that background signals were negligibly small under the conditions used to record the spectra of FeTfCO3, FeTfoxalate, or Fe(ox)33−.
Inversion recovery data were recorded with a π–T–π/2–τ–π–τ–echo sequence in which T was varied. Pulse lengths were 16 and 24 ns, and B1 was adjusted to give maximum intensity of the two-pulse echo at the magnetic field that gave the strongest echo, which was at about 1600 G. At each magnetic field τ was selected to correspond approximately to a maximum echo intensity in the modulated two-pulse echo decay.
Analysis of Time Domain Data.
The time constants Tm and T1 were obtained from the experimental data as described in the following paragraphs. In describing the temperature dependence, it is useful to refer to the rate constants, 1/Tm and 1/T1.
Inversion Recovery Data.
Inversion recovery data were fitted to a sum of exponentials using the algorithm developed by Provencher.10 The fit to the data was significantly better for the sum of two exponentials than for a single exponential. For other Fe(III) complexes we have shown that there is good agreement between the time constants obtained by long-pulse saturation recovery and inversion recovery11 so the time constant obtained from the inversion recovery data is interpreted as a close approximation to T1 for the iron.
Spin Echo Data.
At magnetic fields greater than about 3500 G, echo envelope modulation was shallow and values of Tm were obtained by fitting the data to eq 1 using a Levenberg–Marquardt least-squares algorithm.
| (1) |
Y(τ) is the intensity of the echo as a function of time τ between the two pulses. Y(0), echo intensity extrapolated to time zero, and Y(τ) are in arbitrary units that depend on the concentration of the sample, resonator Q, and instrument settings. The time constant Tm includes all processes that lead to echo dephasing. The parameter x describes the shape of the echo decay and is determined by the mechanism of dephasing.12,13
For FeTfoxalate, FeTfCO3, and Fe(ox)33−, the depth of proton echo envelope modulation increased with decreasing magnetic field and made significant contributions at fields less than about 3500 G. To test the impact of the modulation on procedures to determine Tm, a series of calculations were performed in which a decay calculated with eq 1 was multiplied by a calculated echo envelope modulation pattern, and a value of Tm was estimated by fitting eq 1 to the peaks in the resulting function. When the depth of proton modulation was less than about 20% of the maximum echo amplitude and Tm was long enough that there were multiple modulation cycles within the decay time, fitting a decay function to the maxima in the modulated decay gave values of Tm in good agreement with the value used to calculate the original curve. However, as the depth of the modulation increased or the value of Tm decreased, there was increasing discrepancy between the value of Tm used to generate the curve and the value of Tm obtained by fitting a decay to the peaks in the curve. These calculations demonstrated that obtaining estimates of Tm from spin echo experiments with deep modulation requires simulation of the experimental data as a product of echo modulation and the decay function.
For the case of S = 5/2 with zero-field splitting much less than the EPR quantum and with weakly interacting protons, ESEEM is similar to that for S = ½, I = ½.8,14 When the zfs is much greater than the EPR quantum, the ESEEM can be approximated by the equations for S′ = ½ and effective g values,15 although the pulse turning angle still depends on S. The zero-field splittings for FeTfoxalate, FeTfCO3, and Fe(ox)33− are of the same order of magnitude as the EPR quantum so neither the zfs nor the Zeeman interaction dominates. Analysis of the ESEEM in terms of physically meaningful electron–nuclear distances is therefore more complicated than when either the zfs or the Zeeman interaction dominates. In the present study the ESEEM was calculated for S = ½ using the full forms of the equations given in ref 16, and values of r were adjusted to fit the observed modulation patterns. This is an approximate analysis of the modulation, but it is sufficient for our goal of determining Tm from data with echo modulation. The values of r and numbers of protons are not taken literally. The experimental modulation patterns were simulated by including in the calculation a shell of protons extending out from r = 4.0 Å, plus eight protons at 3.4 Å (FeTfoxalate), six protons at 3.4 Å (FeTfCO3), or four protons at 3.2 Å (Fe(ox)33−).
Results and Discussion
CW Spectra.
CW spectra of FeTfCO3 and FeTfoxalate at 5 K exhibited signals between about 700 and 1700 G that are in good agreement with previous spectra.3 Comparison of the intensity of the g ~ 4.3 signal at 5 K in the spectrum of FeTfoxalate with the spectrum of FeTfCO3 indicated that the FeTfoxalate sample contained about 7% FeTfCO3. This level of impurity does not cause a significant difficulty for the relaxation time measurements. CW spectra were measured from 4 to 240 K for FeTfCO3 and from 4 to 100 K for FeTfoxalate. For FeTfCO3 the line shape was unchanged from 4 to 150 K. Between 150 and 170 K, spectra of the FeTfCO3 complex changed substantially, and the microwave bridge had to be retuned, suggesting a phase transition in the water–glycerol mixture. The line shape for FeTfoxalate was unchanged between 4 and 100 K. The intensity of the spectra for 2 mM FeTfoxalate was not sufficient for measurements at higher temperatures.
Field-Swept Echo-Detected Spectra.
Field-swept echo-detected spectra of FeTfCO3 and FeTfoxalate obtained with two-pulse echoes exhibited intensity at magnetic fields between about 1500 and 12 500 G (Figures 1 and 2). The spectra extend beyond 12 500 G, but that is the maximum field value accessible on our ESP-380E spectrometer. The observation of EPR signal intensity extending beyond 12 500 G is consistent with simulations and is characteristic of high-spin Fe(III) with zfs of the order of the EPR quantum.17 The echo-detected spectra for these samples exhibit signal over a much wider range of magnetic fields than is apparent in the typical first-derivative CW spectra. The absorption spectrum changes so slowly with magnetic field that the slope is close to zero and is indistinguishable from baseline in the first-derivative spectra, although the signals can readily be observed in the field-swept echo-detected spectrum that displays the absorption signal or in rapid passage spectra.
Figure 1.
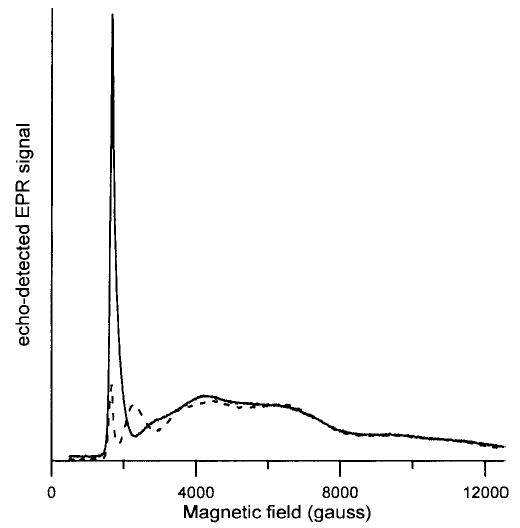
Field-swept echo-detected spectra of FeTfCO3 obtained with 40 and 80 ns pulses at 5 K with constant τ = 112 ns (−) or 152 ns (- - -). The microwave power was adjusted to give maximum echo intensity at about 1600 G.
Figure 2.

Field-swept echo-detected spectrum of FeTfoxalate obtained with 40 and 80 ns pulses at 5 K with constant τ = 120 ns (−) or 152 ns (- - -). The microwave power was adjusted to give maximum echo intensity at about 1600 G.
At 4000 G shallow nitrogen modulation is observed in the two-pulse spin echo decay data for FeTfCO3 and FeTfoxalate. At magnetic fields below about 3500 G proton and nitrogen echo modulation is observed in the data for FeTfCO3 and FeTfoxalate. The modulation pattern in the two-pulse decays is dominated by the protons and the modulation becomes deeper as magnetic field is decreased. Since the proton modulation frequency depends on magnetic field, the value of τ that corresponds to maximum echo intensity varies with magnetic field. Thus, in a field-swept echo-detected spectrum at constant τ, deep nuclear modulation causes the echo-detected spectrum to vary with field in a τ-dependent fashion. The dependence on τ was much greater at low field than at high field (Figures 1 and 2) because of the greater depth of the modulation at lower magnetic fields. Spin echo signals for FeTfCO3 were not observed below about 1600 G. Simulations using parameters for FeTfCO3 show that, in an X-band EPR scan from low field, the first magnetic field at which the conditions of both (1) low anisotropy and (2) high transition probability are met is near 1600 G,17 so it is not surprising that spin echo signals were not observed at lower field. Although the CW spectra of FeTfoxalate exhibit transitions between about 900 and 1700 G, the low-field portions of the spectra were not detectable at 5 K by spin echo (Figure 2). Echo envelope modulation may be so deep at lower field that echo detection is difficult.
The zfs for Fe(ox)33− depends strongly on host, varying between D = 0.09 and 0.20 cm−1 for a series of crystalline lattices.5 Due to the smaller zfs for Fe(ox)33− than for FeTfCO33− or FeTfoxalate, the echo-detected spectrum for Fe(ox)33− is essentially down to baseline by about 12 000 G (Figure 3), whereas the spectra for FeTfCO33− or FeTfoxalate extend beyond 12 500 G (Figures 1 and 2). Spin echoes for Fe(ox)33− could be observed down to about 1000 G, which is lower than for FeTfCO33− or FeTfoxalate. At the same magnetic field, the proton modulation is not as deep for Fe(ox)33− as for FeTfCO33− or FeTfoxalate, and there is no interacting nitrogen in Fe(ox)33−. Both of these factors may also contribute to the ability to detect echoes for Fe(ox)33− at lower field than for the transferrin complexes.
Figure 3.

Field-swept echo-detected spectrum of Fe(ox)33− obtained with 40 and 80 ns pulses at 10 K with constant τ = 160 ns (−) or 200 ns (- - -). The microwave power was adjusted to give maximum echo intensity at about 1600 G.
Iron Tm.
Tm for the iron in FeTfCO3, FeTfoxalate, and Fe(ox)33− was determined by two-pulse electron spin echo. At magnetic fields above about 4000 G echo envelope modulation was negligible, and the spin echo decay data were fitted directly to eq 1. At lower magnetic fields the data were analyzed as the product of a decay function and an echo modulation pattern as described in the data analysis section. When the echo modulation was taken into account, the variation in Tm across the spectrum was <35% for FeTfCO3, <40% for FeTfoxalate, and <30% for Fe(ox)33−. The apparent variation with magnetic field was observed predominantly at magnetic fields below 4000 G and is less than the uncertainty of estimating Tm from spin echo decays with deep echo modulation. Thus, within the uncertainty in analyzing the data, there is no evidence for dependence of Tm on position in the spectrum. To determine the temperature dependence of Tm (Figures 4–6), values obtained at 4–8 magnetic fields between 1500 and 12 500 G were averaged. Within the set of points that were averaged the majority of the data points were obtained at magnetic fields where echo envelope modulation had negligible impact on the value of Tm. Between 5 and 20–30 K, Tm exhibited significant temperature dependence. Slopes of plots of log(1/Tm) vs log-(T) (Figures 4–6) were 0.90 for FeTfCO3, 1.1 for FeTfox, and 1.2 for Fe(ox)33−.
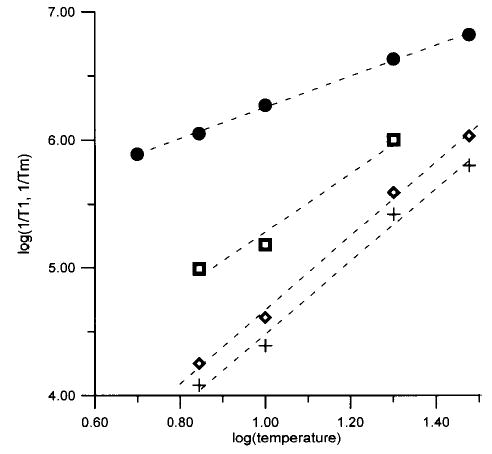
Figure 4.
Temperature dependence of relaxation rates for FeTfCO3. Average of 1/Tm at 4–8 magnetic fields between 1700 and 12 500 G (•), 1/T1 from single-exponential fit (⋄), and long (+) and short (□) components from fits to two exponentials. Values of 1/T1 are averages for data at 4–10 magnetic fields between 1700 and 12 500 G. Dashed lines are least-squares fits to the data: log(1/Tm) = 0.90 log(T) + 5.5; single component, log(1/T1) = 2.2 log(T) + 2.8; long component, log-(1/T1) = 2.1 log(T) + 2.7; and short component, log(1/T1) = 2.0 log(T) + 3.4.
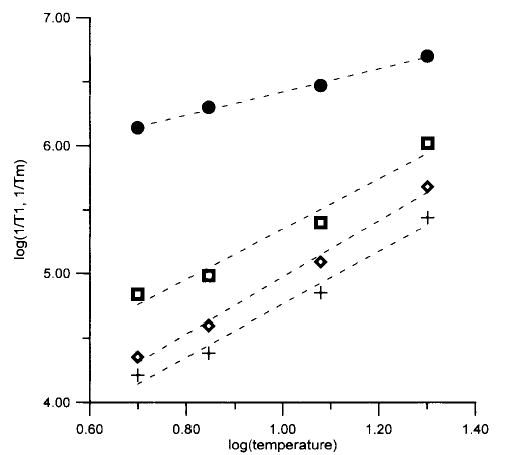
Figure 6.
Temperature dependence of relaxation rates for Fe(ox)33−. Average of 1/Tm at 4–8 magnetic fields between 1700 and 8000 G (•), 1/T1 from single-exponential fit (⋄), and long (+) and short (□) components from fits to two exponentials. Values of 1/T1 are averages based on data at 4–10 magnetic fields between 1500 and 8000 G. Dashed lines are least-squares fits to the data: log(1/Tm) = 1.2 log(T) + 5.0; single component, log(1/T1) = 2.9 log(T) + 1.8; long component, log(1/T1) = 2.9 log(T) + 1.6; and short component, log(1/T1) = 2.3 log(T) + 3.0.
Transferrin and lactoferrin have similar structures18,19—both proteins have two lobes with one metal binding site in each lobe. For iron-saturated lactoferrin the distance between the iron atoms in the two lobes is 42 Å.20 The proximity of the two iron atoms in FeTf raises the possibility that iron–iron interaction might contribute to the values of Tm. Values of Tm for Fe(ox)33− were the same for 1.2 and 0.3 mM solutions, which indicates that in this concentration range iron–iron interaction does not dominate Tm for Fe(ox)33−. Since the values of Tm between 5 and 20 K are similar for Fe(ox)33−, FeTfCO3, and FeTfoxalate, it is probable that interaction between the iron centers in the two lobes of transferrin is not the dominant contribution to Tm for the transferrin complexes in this temperature and concentration range.
The similarity in Tm values for Fe(ox)33−, FeTfCO3, and FeTfoxalate suggests that the spin echo dephasing mechanism is the same for these three samples. For nitroxide radicals, Tm at temperatures below about 60 K is dominated by solvent protons and is approximately independent of temperature.13 Three observations indicate that protons are not the dominant contribution in the echo dephasing for these high-spin Fe(III) complexes. (1) The temperature dependence of the values of Tm for the high-spin Fe(III) complexes (Figures 4–6) is in contrast with the temperature-independence of Tm that is observed when Tm is dominated by solvent protons.13 (2) For each of the high-spin Fe(III) complexes the values of x (eq 1) were 0.9–1.0, which is significantly different from x = 2.3–2.6 that is observed when solvent protons dominate the dephasing for nitroxyl radicals,13 Cr(V) complexes,21 or vanadyl complexes21 in 1:1 water–glycerol. (3) Values of Tm for Fe(ox)33− in 1:1 D2O–glycerol-d8 were indistinguishable from values in 1:1 H2O–glycerol, which indicates that removal of essentially all solvent protons from the sample did not have a significant impact on Tm.
Iron T1.
In solids, most studies of electron spin–lattice relaxation have been performed on species in crystalline lattices, where interpretation is based primarily on lattice phonons. New models need to be developed to interpret data for molecular species, including metalloproteins, in the solid phase. In fluid solution it is generally accepted that electron spin–lattice relaxation of metals with S > ½ is due to fluctuations in zfs.22,23 In the following paragraphs our data for FeTfCO3, FeTfoxalate, and Fe(ox)33− are compared with that obtained for Fe3+ in metmyoglobin24,25 and for Fe3+ enterobactin (FeEnt) bound to iron proteinA (FepA)26 in glassy solution. The data are consistent with relaxation via fluctuations in zfs.
Values of T1 were measured by inversion recovery as a function of temperature for FeTfCO3, FeTfoxalate, and Fe(ox)33−. The fits to the experimental data were better for the sum of two or three exponentials than for a single exponential, which suggests that there is a distribution of values of T1. The weightings of the two components were approximately equal and did not vary significantly with position in the spectrum or with temperature. Deviations from single-exponential fits for saturation recovery data for heme proteins have been attributed to a distribution in zero-field splittings,24 and it is likely that this is also the case for the complexes studied here. For FeTfCO3, FeTfoxalate, and Fe(ox)33− the values of T1 decreased slowly with increasingly magnetic field, and the values at the high-field end of the spectrum were about 60–80% of the values observed between 1500 and 2500 G. This variation of T1 through the spectrum is much smaller than was observed for a single crystal of aquometmyoglobin (aquo-metMb) near 4 K.25 For aquo-metMb the value of T1 along the principal axis is about a factor of 5 longer than in the perpendicular plane and varies by about a factor of 3 within the perpendicular plane.25 The smaller magnetic field dependence of T1 observed for FeTfCO3, FeTfoxalate, and FeTfCO3 than for aquo-metMb may be due to the lower symmetry of these complexes or to the presence of overlapping transitions in the powder spectra. Weak dependence of T1 on position in the spectrum also was observed for FeEnt bound to FepA.26
The values of T1 obtained by single-exponential fits to the data for FeTfCO3 and FeTfoxalate at 5 K are between 35 and 55 μs. The zero-field splittings for these complexes are 0.25–0.27 cm−1.3,27 For FeEnt zfs = 0.50 cm−1 28 and in the complex of FeEnt with FepA, T1 at 6 K is 31 μs.26 For aquo-metMb the zero-field splitting is about 8 cm−1, and the values of T1 at about 5 K are of the order of 1 μs.25 The substantially shorter values of T1 for aquo-metMb than for FeTfCO3, FeTfoxalate, or FeEnt bound to FepA are consistent with the expectation that fluctuation of the zero-field splitting is a major contribution to T1 and that relaxation rates are faster for complexes with larger zero-field splitting. T1 also depends on the details of the local motions that cause the fluctuations in zfs.
The temperature dependence of the relaxation rates for FeTfCO3, FeTfoxalate, and Fe(ox)33− is shown in Figures 4–6. Since the variation of T1 across the spectrum was small, the average of T1 for all magnetic fields examined is displayed as a function of temperature in Figures 4–6. Similar temperature dependence is exhibited by the fits to a single exponential and by the long and short components obtained by fitting the data to the sum of two exponentials. Within the temperature range over which data were obtained, the temperature dependence of 1/T1 and 1/Tm was approximately linear on a log–log scale, so least-squares fits to these plots (Figures 4–6) were used to extrapolate the relaxation rates to higher temperature for comparison with the CW spectra, as discussed below. The uncertainty of the slopes of the log–log plots is about 10% for the single-component fits. Uncertainties are somewhat higher for the two-component fits.
If, as we propose, spin–lattice relaxation is dominated by fluctuations in zfs, the temperature dependence of 1/T1 should reflect the temperature dependence of these fluctuations. The literature values of zfs (see above) and the extent of the echo-detected spectra (Figures 1–3) indicate that zfs is smaller for Fe(ox)33− than for FeTfCO3 or FeTfoxalate. However, the values of 1/T1 for Fe(ox)33− are more temperature dependent than for FeTfCO3 or FeTfoxalate, which indicates that the fluctuations are more temperature dependent.
The slopes of the plots for log(1/T1) vs log(T) for FeTfCO3, FeTfoxalate, Fe(ox)33− are greater than the slopes of the plots for log(1/Tm) vs log(T) (Figures 3–6), which indicates that the value of Tm is not determined solely by T1, although T1 is short enough to have an impact on Tm. Perturbation treatments predict a quadratic dependence of 1/T1 on fluctuations in zfs.22,23 Fluctuations in zfs can contribute to echo dephasing by changing the resonance energy for the electron spin. For small fluctuations in zfs the effects on 1/Tm are likely to be closer to linear than to quadratic, which could contribute to the smaller temperature dependence of 1/Tm than of 1/T1 (Figures 4–6). The fluctuations in zfs are likely to occur on a time scale that is rapid relative to the time scale of the spin echo experiment, which is consistent with the observation that fitting of the spin echo data for FeTfCO3, FeTfoxalate, and Fe(ox)33− to eq 1 gave x ~ 1.12 Thus, it appears plausible that both the spin–lattice relaxation times and the spin echo decays for these non-heme Fe3+ complexes are dominated by fluctuations in the zfs.
Relationship between Observed Relaxation Rates and Line Shapes of CW Spectra.
Throughout the temperature range examined, T1 for FeTfCO3 and FeTfoxalate was significantly longer than Tm so the contribution to the line width from T1 is less than the contribution from Tm. Tm includes all processes that take spins off resonance on the time scale of the spin echo experiment and represents a lifetime for a spin packet in the rotating frame. It can be used as an estimate of the spin packet line width for the CW experiments. T2 is greater than or equal to Tm. If spin echo data are fitted to eq 1 with x = 1, the relaxation-determined contribution to the CW line width is related to Tm by
| (2) |
For the high-spin Fe(III) complexes the values of x were 0.9 to 1.0 so eq 2 can be used to relate Tm to line width. The value of Tm observed for FeTfCO3 is about 0.7 μs at 5 K and decreases to about 0.2 μs at 20 K, which corresponds to line widths of about 0.2 MHz at 5 K and 0.8 MHz at 20 K. For FeTfoxalate Tm is about 0.8 μs at 5 K and decreases to about 0.1 μs by 30 K, which corresponds to line widths of 0.2 and 1.6 MHz, respectively. These line widths are negligible compared with the line widths that are required to match the experimental spectra at 5–30 K,2–4 which indicates that the line widths are not relaxation determined. If we assume, as a first approximation, that the temperature dependence of 1/Tm and 1/T1 observed between 5 and 30 K persists up to 90 K, the estimated relaxation-time-determined line widths would be 3 MHz for FeTfCO3 and 6 MHz for FeTfoxalate. Continued extrapolation to 170 K gives estimated relaxation-determined line widths of 7 MHz for FeTfCO3 and 14 MHz for FeTfoxalate. Even with substantial margins of error for the extrapolations, the estimated values at 90 and 170 K still are small compared with the apparent line widths in the CW spectra, which indicates that the line widths in the CW spectra are not relaxation determined, even at 90 or 170 K. This conclusion is consistent with the observation that the line widths are approximately independent of temperature up to about 150 K for FeTfCO3 and up to the highest temperature examined (100 K) for FeTfoxalate.
Figure 5.
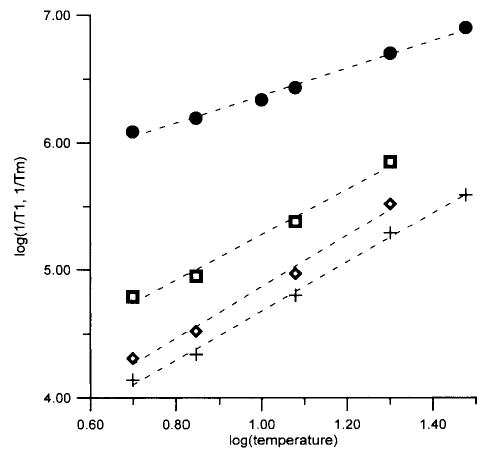
Temperature dependence of relaxation rates for FeTfoxalate. Average of 1/Tm at 4–7 magnetic fields between 1500 and 9000 G (•), 1/T1 from single-exponential fit (⋄), and long (+) and short (□) components from fits to two exponentials. Values of 1/T1 are averages based on data at 3–6 magnetic fields between 1600 and 10 000 G. Dashed lines are least-squares-fits to the data: log(1/Tm) = 1.1 log(T) + 5.3; single component, log(1/T1) = 2.0 log(T) + 2.9; long component, log(1/T1) = 1.9 log(T) + 2.8; and short component, log(1/T1) = 1.8 log(T) + 3.5.
Acknowledgments
The support of this work by NIH grants GM36232 (B.J.G.) and GM21156 (G.R.E. and S.S.E.) is gratefully acknowledged.
References
- 1.Abbreviations: Mb, myoglobin; ox, oxalate; Tf, transferrin; zfs, zero-field splitting.
- 2.Yang AS, Gaffney BJ. Biophys J. 1987;51:55. doi: 10.1016/S0006-3495(87)83311-8. [DOI] [PMC free article] [PubMed] [Google Scholar]
- 3.Dubach J, Gaffney BJ, More K, Eaton GR, Eaton SS. Biophys J. 1991;59:1091. doi: 10.1016/S0006-3495(91)82324-4. [DOI] [PMC free article] [PubMed] [Google Scholar]
- 4.Doctor KS, Gaffney BJ, Alvarez G, Silverstone HJ. J Phys Chem. 1993;97:3028. [Google Scholar]
- 5.Collison D, Powell AK. Inorg Chem. 1990;29:4735. [Google Scholar]
- 6.Eaton, S. S.; Eaton, G. R. In Analytical Instrumentation Handbook, 2nd ed.; Ewing, G. W., Ed.; Marcel Dekker: New York, 1997; p 767.
- 7.Sloop DJ, Yu HL, Lin TS, Weissman SI. J Chem Phys. 1981;75:3746. [Google Scholar]
- 8.Coffino AR, Peisach J. J Chem Phys. 1992;97:3072. [Google Scholar]
- 9.Eaton SS, Eaton GR. J Magn Reson A. 1995;117:62. [Google Scholar]
- 10.Provencher SW. J Chem Phys. 1976;64:2772. [Google Scholar]
- 11.Zhou, A.; Eaton, S. S.; Eaton, G. R. Unpublished results.
- 12.Brown, I. M. In Time Domain Electron Spin Resonance; Kevan, L., Schwartz, R. N., Eds.; Wiley-Interscience: New York, 1979; p 195.
- 13.Lindgren M, Eaton GR, Eaton SS, Jonsson BH, Hammarström P, Svensson M, Carlsson U. J Chem Soc, Perkin Trans. 1998;2:2549. [Google Scholar]
- 14.Larsen RG, Halkides CJ, Singel DJ. J Chem Phys. 1993;98:6704. [Google Scholar]
- 15.DeRose VJ, Kim CH, Hoffman BM. Biochemistry. 1995;34:2809. doi: 10.1021/bi00009a009. [DOI] [PubMed] [Google Scholar]
- 16.Ichikawa T, Kevan L, Bowman MK, Dikanov SA, Tsvetkov, Yu D. J Chem Phys. 1979;71:1167. [Google Scholar]
- 17.Gaffney BJ, Silverstone HJ. Biol Magn Reson. 1993;13:1. [Google Scholar]
- 18.Bailey S, Evans RW, Garratt RC, Gorinsky B, Hasnain S, Horsburgh C, Jhoti H, Lindley PF, Mydin A, Sarra R, Watson JL. Biochemistry. 1988;27:5804. doi: 10.1021/bi00415a061. [DOI] [PubMed] [Google Scholar]
- 19.Baker EN. Adv Inorg Chem. 1994;41:389. [Google Scholar]
- 20.Anderson BF, Baker HM, Dodson EJ, Norris GE, Rumball SV, Waters JM, Baker EN. Proc Natl Acad Sci USA. 1987;84:1769. doi: 10.1073/pnas.84.7.1769. [DOI] [PMC free article] [PubMed] [Google Scholar]
- 21.Eaton, G. R.; Eaton, S. S. Unpublished data.
- 22.Rubinstein M, Baram A, Luz Z. Mol Phys. 1971;20:67. [Google Scholar]
- 23.Bertini I, Luchinat C. Coord Chem Rev. 1996;150:86. [Google Scholar]
- 24.Levin PD, Brill AS. J Phys Chem. 1988;92:5103. [Google Scholar]
- 25.Fiamingo FG, Brill AS, Hampton DA, Thorkildsen R. Biophys J. 1989;55:67. doi: 10.1016/S0006-3495(89)82781-X. [DOI] [PMC free article] [PubMed] [Google Scholar]
- 26.Klug, C. S.; Eaton, S. S.; Eaton, G. R.; Feix, J. B. Biochemistry, accepted for publication.
- 27.Kretchmar SA, Teixeira M, Huynh BH, Raymond KN. Biol Met. 1988;1:26. doi: 10.1007/BF01128014. [DOI] [PubMed] [Google Scholar]
- 28.Spatalian K, Oosterhuis WT, Neilands JB. J Chem Phys. 1975;62:3538. [Google Scholar]