Abstract
We present a new common path configuration Fourier domain low coherence interferometry (fLCI) optical system and demonstrate its capabilities by presenting results which determine the size of cell nuclei in a monolayer of T84 epithelial cells. The optical system uses a white light source in a modified Michelson interferometer and a spectrograph for detection of the mixed signal and reference fields. Depth resolution is obtained from the Fourier transform of the measured spectrum which provides the axial spatial cross-correlation between the signal and reference fields. The spectral dependence of scattering by the samples is determined by windowing the spectrum to measure the scattering amplitude as a function of wavenumber. We present evidence that fLCI accurately measures the longitudinal profile of cell nuclei rather than the transverse profile.
1. Introduction
Elastic light scattering has been previously demonstrated as a means of probing cellular morphology [1, 2] and diagnosing dysplasia [3–5], a pre-cancerous tissue state. Low-coherence interferometry (LCI) has been employed as a means for detecting singly scattered light from sub-surface sites for light scattering spectroscopy. The combination of light scattering spectroscopy with LCI has been used to develop techniques such as Angle-resolved Low Coherence Interferometry (a/LCI), drawing upon the strengths of each in order to obtain depth resolved angular scattering distributions [6, 7].
Recently, we have developed a new system [8] which combines LCI with light scattering spectroscopy, named Fourier domain low coherence interferometry (fLCI). This new technique recovers depth-resolved structural information by Fourier transforming the spectrum of two mixed fields as in spectral radar [9–11]. Like spectroscopic OCT, a Gaussian window is applied to the interference spectrum before Fourier transforming in order to obtain spectroscopic information [12]. In fLCI, wavelength dependent variations in scattered light are measured as a function of depth. Its capabilities have been demonstrated using a free-space optical system to examine light scattered by phantoms consisting of polystyrene microspheres attached to a glass coverslip [8]. This study demonstrated the potential of the technique for probing structural features in sub-surface layers. We now present results which have used a new fLCI system to probe nuclear morphology of in vitro cell monolayers.
2. Materials and methods
2.1 Experimental scheme
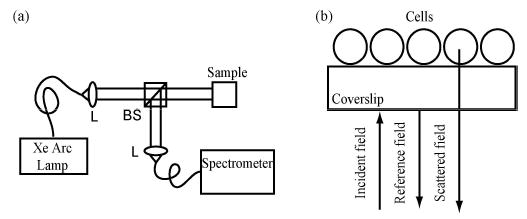
The fLCI scheme is based on a Michelson interferometer (Fig. 1(a)). White light from a Xe arc lamp source (250W, Thermo Oriel) is coupled into a multimode fiber (200 μm core diameter). The output of the fiber is collimated by an achromatic lens (L) to produce a pencil beam 5 mm in diameter which illuminates approximately 200,000 cells. This diameter can be restricted to adjust the number of cells measured. white light beam is transmitted to the sample by the beamsplitter (BS). Unlike the previous fLCI scheme [8], where the BS is used to generate separate reference and signal beams, the current fLCI scheme uses a common path configuration where the signal and reference fields travel the same optical path until reaching the sample. The generation of a reference field is achieved by using a sample consisting of epithelial cells grown on a glass coverslip. The reflection from the front surface (Fig. 1(b)) is used as the reference field while the light that is backscattered by the cells comprises the signal field. The two combined fields are then directed by BS to a second achromatic lens (L2) which collects the light and couples to another multimode fiber. The output of the fiber is coincident with the input slit of a high resolution spectrometer (InSpectrum, Acton Research) which uses a 1200 lp/mm grating with a 150 mm light path to produce a spectral resolution of 0.1 nm. The dispersed fields are detected with an integrated, cooled CCD and downloaded in real time to a laptop PC via the USB interface.
Fig. 1.

(a). Schematic of new fLCI system. (b). Measurement geometry for the in vitro cell experiments.
Light microscopy images were acquired using two different microscope systems. An Axiovert 200M (Zeiss) system with a Mercury arc lamp for excitation and a DAPI emission filter was used to collect cellular fluorescence images. Confocal Z-stack images were acquired using an LSM 5 Live (Zeiss) system using a 532 nm excitation wavelength and an emission filter with a 550 nm cutoff.
2.2 Cell culture
To demonstrate the applicability of the fLCI technique to biological structures, experiments were executed using in vitro samples of T84 epithelial cells. The T84 cells (from Duke Cell Culture Facility) were grown in LabTek chambered coverglasses (Nalge Nunc International, Naperville, IL) using a growth medium consisting of a 1:1 mixture of high-glucose Dulbecco’s modified Eagle medium and Ham’s F12 medium containing 1.2 g/L sodium bicarbonate, 2.5 mM L-glutamine, 15 mM HEPES and 0.5 mM sodium pyruvate supplemented with 5% fetal calf serum, 95 units/ml penicillin and 95 μg/ml streptomycin (all Gibco BRL products, Life Technologies, Grand Island, NY). Cells were incubated at 37° C in a humidified atmosphere of 5% CO2 in air. For the experiments, monolayers were transferred to Hank’s Balanced Salt Solution (HBSS, Sigma, St. Louis, MO).
T84 cells were prepared for microscopy imaging with two different nuclear stains. To accomplish the nuclear tagging, the cells were fixed in 3.7% formaldehyde in TBS for 20 minutes at 37º C, rinsed with PBS and incubated with a solution of 8 μg/mL Hoechst 33342 stain (Molecular Probes) for 20 minutes. T84 samples were similarly prepared for confocal Z-stack imaging, but were incubated with a solution of 1.67 μg/mL LDS-751 (Molecular Probes) nuclear stain in ethanol.
3. Data Processing
3.1 fLCI analysis
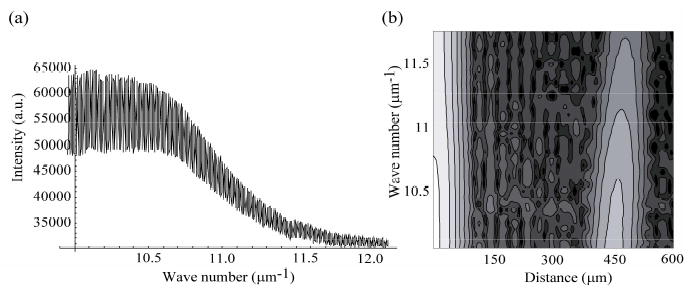
A typical spectrum of light backscattered by the sample is shown in Fig. 2(a). The data are presented as a function of wavenumber, over the range of 10 μm−1 to 12 μm−1, corresponding to a wavelength range of 525–625 nm. The data show a prominent oscillation which arises from the interference between the reflection from front of the coverglass (reference field) and that from the rear surface (signal field). In order to obtain spectroscopic information, a Gaussian window is applied to the interference term before Fourier transforming in a process similar to Spectroscopic OCT [12]. Fig. 2(b) shows a contour plot for the processed data resulting from this transform. The processed data are given as a function of depth on the horizontal axis and as a function of wavenumber on the vertical axis. The lighter areas correspond to higher field strength. The signal localized at the depth of 450 μm, corresponding to the roundtrip optical pathlength through the coverglass, gives the interference between the front and back surface reflections.
Fig. 2.

(a). Typical spectrum of light scattered by the in vitro cell sample. (b). Contour plot showing the depth resolved spectral data for the T84 cell sample.
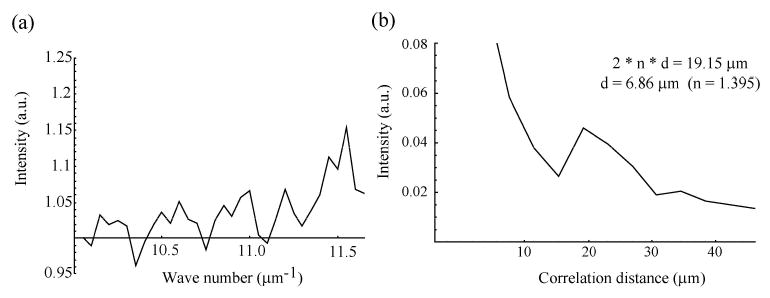
In order to exclusively examine the contribution from the T84 cells, the depth resolved spectrum of the field scattered by the cells is compared to that obtained from a blank coverslip. By taking the ratio of the two, we are able to examine the scattering efficiency of the cells (Fig. 3(a)) separately from the source spectrum and the transmission through the coverglass. The ratio shows a periodic oscillation in the scattering efficiency of the cells. This oscillation can be understood by considering that the field scattered by the front of the nuclei will interfere either constructively or destructively with that from the rear of the nuclei depending on the number of wavelengths which will fit inside of the nucleus diameter.
Fig. 3.

(a). Scattering efficiency of the T84 cells. (b). Correlation function obtained by Fourier transforming ratioed data shown in (a).
The size of the nucleus can be determined by Fourier transforming this ratio and analyzing the correlation information which is obtained (Fig. 3(b)). The correlation function shows a sharp peak at a round trip path of 19.15 μm which is equal to 2 n d where n is the index of refraction of the cell nuclei (1.395) [13] and d is the nuclear diameter. This analysis yields a nuclear diameter of 6.86 +/− 1.37 μm, with the uncertainty given by the pixel size of this correlation function. In the experiments, the spectra from 11 different cell samples are analyzed, with the results given below.
3.2 Microscopy image analysis
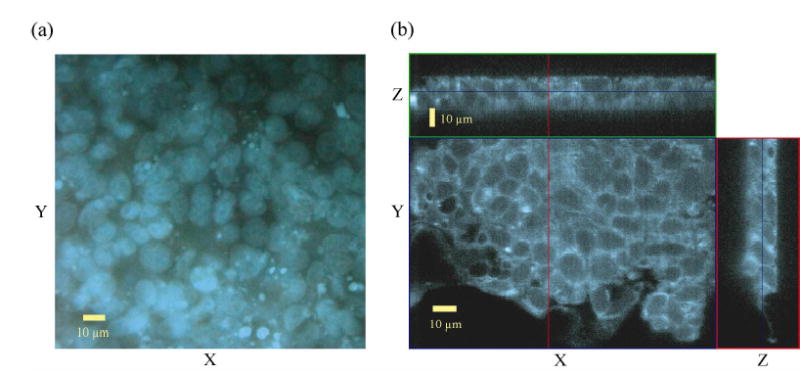
In order to gauge the accuracy of the fLCI measurements, the nuclear diameters of T84 cells were measured using fluorescence and confocal microscopy. Cells were fixed and treated with nuclear dyes as described above. Standard fluorescence microscopy was used to generate X-Y images which were analyzed using ImageJ (NIH) software to manually measure the nuclear diameters. Because the nuclei were generally non-circular, an average diameter for each nucleus was calculated by computing the geometric mean of the maximum and minimum diameters. Results from 50 randomly selected cells were averaged to determine the mean transverse diameter of the cell nuclei. A typical fluorescence microscopy image of T84 nuclei can be seen in Fig. 4(a).
Fig. 4.

(a) Fluorescence microscopy image of T84 cell nuclei. (b) Confocal microscopy Z-stack of T84 nuclei.
Confocal Z-stacks were also acquired to assess the nuclear dimensions in the X-Z plane. Z-stacks were assembled into 3D volumes using LSM Image Examiner (Zeiss) software from which X-Z slices were selected and measured manually. The nuclear diameter in the Z direction was measured using confocal microscopy for comparison to the information obtained with the fLCI system. Longitudinal diameter measurements were obtained from 25 randomly selected T84 cells and averaged to determine the mean longitudinal diameter of the nuclei. A typical Z-stack image is shown in Fig. 4(b).
4. Results
The nuclear size determined using fLCI yielded consistent results across measurements of all 11 samples. The fLCI measurements generated a mean longitudinal diameter of 6.87 +/− 0.81 μm. Image analysis of confocal microscopy Z-stack images yielded a longitudinal diameter of 6.8 +/− 1.1 μm and a transverse diameter of 10.5 +/− 1.9 μm. Fluorescence microscopy was also used to investigate the transverse profile of the cell nuclei, yielding a mean transverse diameter of 10.4 +/− 1.4 μm. The standard deviation of the fLCI measurements is lower than that of the microscopy measurements due to the high number of cells probed with each fLCI measurement compared to that examined using image analysis. The distinction between the longitudinal and transverse diameters of the cell nuclei is discussed in depth below.
5. Discussion
Experimental results show that fLCI is an excellent technique for accurately and precisely probing the nuclear morphology of epithelial cells. Although previous light scattering experiments with T84 cells [1] have yielded larger nuclear sizes than those measured here using fLCI, we believe that this discrepancy is caused by differing measurement geometries and analysis methods. We confirm this assertion through comparison to confocal X-Z images.
The discrepancy between the fLCI measurements and those of standard fluorescence microscopy image analysis can be understood by considering that the light microscopy results are measuring the transverse profile of the cell nuclei while fLCI results probe the longitudinal profile of the cells. The difference between the two profiles can be explained by realizing that epithelial cells, such as the T84 cells, tend to flatten (Fig. 5(a)) upon contact with a substrate. In addition, examination of confocal microscopy images of cell nuclei in the X-Z plane (Fig. 5(b)) reveals that epithelial cells also tend to have different horizontal and vertical dimensions. This parameter is often quantized as nuclear roundness in image analysis of histology slides.
Fig. 5.

(a). Illustration of the difference between the longitudinal and transverse profiles of the cells. (b). Confocal microscopy image of T84 cell nuclei demonstrating the different horizontal and vertical nuclear dimensions.
Because the fLCI system is designed to only detect light directly backscattered within a narrow angular range, fLCI necessarily probes only the longitudinal dimension of the cells. Therefore, it is most appropriate to compare the fLCI measurements with the longitudinal confocal microscopy measurements. This comparison reveals that fLCI is capable of measuring the longitudinal diameter of epithelial cell nuclei with high precision and accuracy.
Although the fLCI technique is sensitive to reflections from cellular structures other than the nucleus, we are confident that our analysis method specifically obtains the features of the nucleus, rather than those of the entire cell. This specificity arises from the greater refractive index variation between the nucleus and the cytoplasm (3–5%) compared to that between the cytoplasm and the culture medium (<1%) which would give the overall size of the cell body contained by the cell membrane. Further, epithelial cells do not contain any structures besides the nucleus that are large enough to produce a peak in the correlation distance graph corresponding to a size of 6–7 μm. In contrast, other sub-cellular organelles, such as mitochondria and lysosomes have a diameter of 0.2–2 μm.
We believe that fLCI’s ability to make accurate and precise nuclear morphology measurements demonstrates the potential feasibility of the technique for clinical diagnostic applications such as detecting early cancer development. Additionally, because fLCI can deliver and collect light through a single optical fiber, this method can potentially monitor narrow anatomical channels that would be inaccessible by other optical techniques. We plan to further assess the clinical feasibility of fLCI by investigating the performance of the technique within thick tissues.
6. Summary
We have demonstrated the capabilities of a new common path fLCI system by presenting results which accurately and precisely determine the longitudinal diameter of T84 epithelial cell nuclei. The excellent accuracy of fLCI measurements were confirmed through analysis of fluorescence and confocal microscopy images.
Table 1.
Mean Diameter and Standard Deviation Measurements
| Modality | Mean Diameter (μm) | Standard Deviation (μm) |
|---|---|---|
| fLCI | ||
| Longitudinal | 6.87 | 0.81 |
| Confocal Microscopy | ||
| Longitudinal | 6.8 | 1.1 |
| Transverse | 10.5 | 1.9 |
| Fluorescence Microscopy | ||
| Transverse | 10.4 | 1.4 |
Acknowledgments
We thank Elise Shumsky (Carl Zeiss, Inc.) and Derrick Chou for their assistance with the microscopy imaging. This work was supported by the NIH (NCI R21-CA109907) and the NSF (BES 03-48204).
References
- 1.Backman V, Gopal V, Kalashnikov M, Badizadegan K, Gurjar R, Wax A, Georgakoudi I, Mueller M, Boone CW, Dasari RR, Feld MS. “Measuring cellular structure at submicrometer scale with light scattering spectroscopy,”. IEEE J Sel Top Quantum Electron. 2001;7:887–893. [Google Scholar]
- 2.Wax A, Yang CH, Backman V, Badizadegan K, Boone CW, Dasari RR, Feld MS. “Cell organization and sub-structure measured using angle-resolved low coherence interferometry,”. Biophys J. 2002;82:2256–2264. doi: 10.1016/S0006-3495(02)75571-9. [DOI] [PMC free article] [PubMed] [Google Scholar]
- 3.Backman V, Wallace MB, Perelman LT, Arendt JT, Gurjar R, Muller MG, Zhang Q, Zonios G, Kline E, McGillican T, Shapshay S, Valdez T, Badizadegan K, Crawford JM, Fitzmaurice M, Kabani S, Levin HS, Seiler M, Dasari RR, Itzkan I, Van Dam J, Feld MS. “Detection of preinvasive cancer cells,”. Nature. 2000;406:35–36. doi: 10.1038/35017638. [DOI] [PubMed] [Google Scholar]
- 4.Wax A, Yang CH, Muller MG, Nines R, Boone CW, Steele VE, Stoner GD, Dasari RR, Feld MS. “In situ detection of neoplastic transformation and chemopreventive effects in rat esophagus epithelium using angle-resolved low-coherence interferometry,”. Cancer Research. 2003;63:3556–3559. [PubMed] [Google Scholar]
- 5.A. Wax, J.W. Pyhtila, R.N. Graf, R. Nines, C.W. Boone, R.R. Dasari, M.S. Feld, V.E. Steele, and G.D. Stoner, “ Prospective grading of neoplastic change in rat esophagus epithelium using angle-resolved low coherence interferometry” J. Biomed. Opt. in press [DOI] [PubMed]
- 6.Wax A, Yang CH, Dasari RR, Feld MS. “Measurement of angular distributions by use of low-coherence interferometry for light-scattering spectroscopy,”. Optics Letters. 2001;26:322–324. doi: 10.1364/ol.26.000322. [DOI] [PubMed] [Google Scholar]
- 7.Wax A, Yang CH, Backman V, Kalashnikov M, Dasari RR, Feld MS. “Determination of particle size using the angular distribution of backscattered light as measured with low-coherence interferometry,”. J Opt Soc Am A. 2002;19:737–744. doi: 10.1364/josaa.19.000737. [DOI] [PubMed] [Google Scholar]
- 8.Wax A, Yang CH, Izatt JA. “Fourier-domain low-coherence interferometry for light-scattering spectroscopy,”. Opt Lett. 2003;28:1230–1232. doi: 10.1364/ol.28.001230. [DOI] [PubMed] [Google Scholar]
- 9.Wojtkowski M, Kowalczyk A, Leitgeb R, Fercher AF. “Full range complex spectral optical coherence tomography technique in eye imaging,”. Opt Lett. 2002;27:1415–1417. doi: 10.1364/ol.27.001415. [DOI] [PubMed] [Google Scholar]
- 10.Wojtkowski M, Leitgeb R, Kowalczyk A, Bajraszewski T, Fercher AF. “In vivo human retinal imaging by Fourier domain optical coherence tomography,”. J Biomed Opt. 2002;7:457–463. doi: 10.1117/1.1482379. [DOI] [PubMed] [Google Scholar]
- 11.Leitgeb R, Wojtkowski M, Kowalczyk A, Hitzenberger CK, Sticker M, Fercher AF. “Spectral measurement of absorption by spectroscopic frequency-domain optical coherence tomography,”. Opt Lett. 2000;25:820–822. doi: 10.1364/ol.25.000820. [DOI] [PubMed] [Google Scholar]
- 12.Morgner U, Drexler W, Krtner FX, Li XD, Pitris C, Ippen EP, Fujimoto JG. “Spectroscopic optical coherence tomography,”. Opt Lett. 2000;25:111–113. doi: 10.1364/ol.25.000111. [DOI] [PubMed] [Google Scholar]
- 13.V. Tuchin, “Tissue optics: light scattering methods and instruments for medical diagnosis,” SPIE (2000).


