

Abstract
Fenretinide (4-HPR) is a synthetic retinoid whose apoptosis-inducing effects have been demonstrated in many tumor types. The precise mechanism of its apoptotic action is not fully understood. To further study the mechanism by which 4-HPR exerts its biological effects in neuroblastoma (NB) and to identify the genes that contribute to the induction of apoptosis, we determined the sensitivity of eight NB cell lines to 4-HPR. Additionally, cDNA microarray analysis was performed on a 4-HPR-sensitive cell line to investigate the temporal changes in gene expression, primarily focusing on the induction of proapoptotic genes. BBC3, a transcriptionally regulated proapoptotic member of the BCL2 family, was the most highly induced proapoptotic gene. Western analysis confirmed the induction of BBC3 protein by 4-HPR. Furthermore, the induction of BBC3 was associated with the sensitivity to this agent in the cell lines tested. Finally we demonstrated that BBC3 alone is sufficient to induce cell death in the 4-HPR-sensitive and resistant NB cell lines, and that siRNA against BBC3 significantly decreases apoptosis induced by 4-HPR. Our results indicate that BBC3 mediates cell death in NB cells in response to 4-HPR.
Keywords: fenretinide (4-HPR), apoptosis, microarray, BBC3, neuroblastoma, N-[4-hydroxyphenyl]retinamide, PUMA
Introduction
Neuroblastoma (NB) is the most common solid extracranial tumor of childhood and accounts for 7–10% of all childhood cancers (Brodeur and Castleberry, 1997). Despite advances in modern therapy, high-risk NB remains incurable in approximately 70% of cases (Pearson and Philip, 2000). It is postulated that NB arises from neural crest cells, precursors of the sympathetic nervous system, failing to complete differentiation (Pahlman and Hedborg, 2000). This failure in terminal differentiation has been the rationale for investigating the effects of retinoids, which are essential regulators of cell growth, differentiation and death (Abemayor and Sidell, 1989; Lotan et al., 1990; Slawin et al., 1993), on NB and to develop these agents as novel therapies for high-risk patients. Among the retinoids, both all-trans retinoic acid (ATRA) and 13-cis retinoic acid (13-cis-RA) have been shown to induce differentiation and death in NB cell lines (Melino et al., 1997). Additionally, clinical trials have established that 13-cis-RA improves outcome in NB patients with minimal residual disease after chemotherapy and autologous bone marrow transplantation (Matthay et al., 1999). However, the use of these agents has been limited by their toxicity, and clinical data indicate that approximately one-half of the patients may develop resistance to the treatment (Reynolds et al., 2000).
The synthetic retinoid fenretinide (N-[4-hydroxyphenyl]retinamide, 4-HPR) has been shown to induce apoptosis in a variety of cancer cell lines including colon (Ziv et al., 1994), breast (Pellegrini et al., 1995), prostate carcinoma (Hsieh et al., 1995), as well as NB (Ponzoni et al., 1995; Wu et al., 2001). Fenretinide has a low toxicity profile and in vitro studies have proved its efficacy against NB cell lines resistant to ATRA or 13-cis-RA (Reynolds et al., 2000). The mechanism by which 4-HPR induces growth arrest and apoptosis is currently under investigation. Some reports indicate that 4-HPR acts through the production of reactive oxygen species (ROS) and/or induction of the lipid secondary messenger ceramide (Maurer et al., 1999; Lovat et al., 2004). Studies on the NB cell line SH-SY5Y have shown that 4-HPR may induce apoptosis through both retinoic acid receptor (RAR)-dependent and -independent pathways, the latter through increases in lipoxygenase activity leading to the induction of the transcription factor GADD153 by ROS (Lovat et al., 2002). The same group also reported that BAK1 is a downstream mediator of 4-HPR-induced apoptosis (Lovat et al., 2003a, b).
To explore further the mechanism by which 4-HPR exerts its biological effects on NB and to identify the genes that may contribute to the induction of apoptosis, we first determined the sensitivity of eight NB cell lines to 4-HPR, and investigated the temporal changes of gene expression in a 4-HPR-sensitive cell line in time course experiments using cDNA microarrays. Focusing on the induction of apoptosis-related genes, we discovered that BBC3, a BH3 family member proapoptotic gene, was the most highly induced proapoptotic gene by 4-HPR. Furthermore, we provided evidence that BBC3 plays a prominent role in 4-HPR-induced cell apoptosis in NB cells.
Results
Change in cell growth and viability after 4-HPR treatment
We initially determined the effect of 4-HPR on cell growth for eight NB cell lines, including four MYCN amplified (SMS-KCNR, GI-LI-N, LAN1 and SK-N-BE(2)) and four MYCN nonamplified cell lines (SH-SY5Y, SK-N-AS, SK-N-FI and SK-N-SH) using a WST-1 assay. We found a profound suppression of cell growth in all the four MYCN amplified cell lines, and in only two of the MYCN nonamplified cell lines (SK-N-AS and SH-SY5Y). SK-N-FI showed moderate resistance to 4-HPR, whereas SK-N-SH showed marked resistance against 4-HPR (Figure 1).
Figure 1.
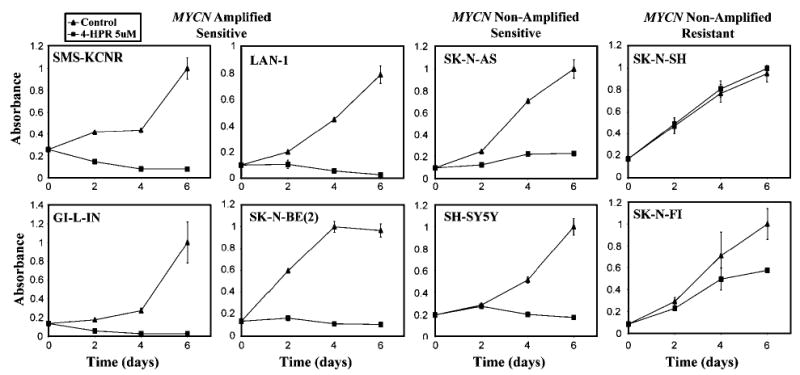
Cell growth assay (WST-1) of the eight NB cell lines. A total of 5000 cells were seeded into a 96-wells microplate in 200 μl of medium. Three replicated wells were set up for each time point, and absorbance was measured at 2, 4 and 6 days for both control and experimental samples. The absorbance values were normalized to 1, and the error bars represent the standard errors. All cell lines except SK-N-SH and SK-N-FI were sensitive to 4-HPR
To determine if the lack of growth seen in WST-1 assays was due to cell death, we performed 7-AAD viability staining after 24 h of 4-HPR treatment for these eight NB cell lines. We found a significant increase in the percentage of dead cells at 24 h in most of the 4-HPR-sensitive cell lines with only a modest increase in SH-SY5Y (Figure 2a). This is consistent with the WST-1 assay (Figure 1) in which SH-SY5Y cells shows a delayed reduction of cell growth until after 48 h. Additionally, SH-SY5Y did have a significant increase in cell death at 48 h as measured by PI profiling (see results below). Figure 2b shows the histogram profiles of 7-AAD staining in the most 4-HPR-sensitive cell line, GI-LI-N, which had a 45% increase in cell death compared to the resistant cell line SK-N-SH, which had only a 1% increase. Therefore, we concluded that the primary effect of 4-HPR on these sensitive NB cell lines is the induction of cell death.
Figure 2.
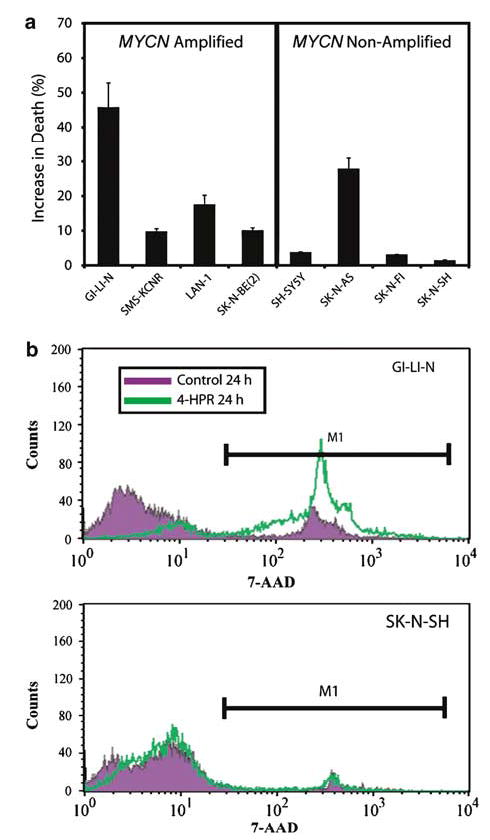
Viability assay of the eight NB cell lines. (a) Cell death was measured for all eight cell lines with 7-AAD vital dye after 24 h exposure with 5 μm 4-HPR. Experiments were done in triplicate with standard error shown. (b) Representative histograms from GI-LI-N and SK-N-SH stained with 7-AAD after 24 h exposure to 5 μm 4-HPR are shown. GI-LI-N had a 45% increase in cell death compared to control, whereas SK-N-SH had only a 1% increase. Therefore, 4-HPR induces cell death in sensitive NB cell lines
Changes in expression levels of apoptosis-related genes
In order to investigate the potential transcriptionally regulated mediators of 4-HPR-induced cell death, we performed a time course microarray experiment on the 4-HPR-sensitive SMS-KCNR cell line. Total RNA was extracted at 2, 4, 6, 8, 12, 24, 48 and 96 h following 4-HPR treatment, and subjected to cDNA microarray analysis. Quality filtered data of clones with ⩾2-fold change that were associated with the gene ontology (GO) terms apoptosis or cell death were extracted from this analysis. Out of 8149 known genes present on the microarrays, only 14 apoptosis/cell death-related genes were altered ⩾2-fold (see Materials and methods). Hierarchical clustering of these genes using a Pearson correlation matrix can be seen in Figure 3a. Of these genes, BBC3 and BAK1 showed the earliest (2 h) and most consistent increase in their transcription levels over the entire time course, with BBC3 reaching a maximum induction (2.7-fold) at 12 h.
Figure 3.
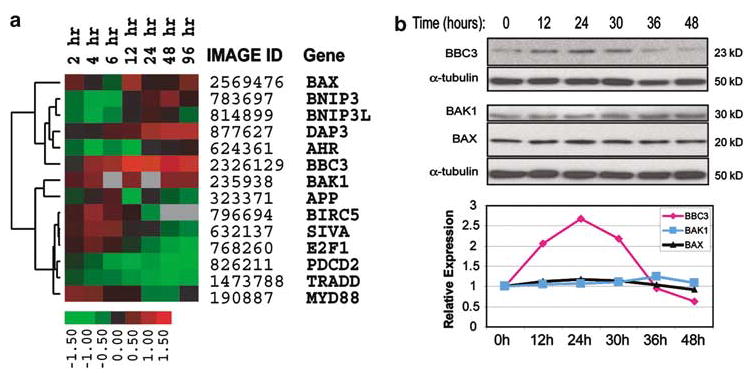
Expression of apoptotic genes induced by 4-HPR in NB cells. (a) Hierarchical clustering of apoptosis-related genes with ⩾2-fold induction of mRNA in the time course experiments in the 4-HPR sensitive SMS-KCNR cell line. Cells were treated with 5 μm 4-HPR for 2, 4, 6, 8, 12, 24, 48 and 96 h. The heat map represents gene expression ratios: red indicates upregulation, green represents downregulation, and black indicates no change. The ratio color scale indicates the log2 ratios. Low-quality cDNA spots (spot quality <0.5, see Materials and methods) were marked with gray. (b) Fenretinide-induced transient upregulation of BBC3 in SH-SY5Y cells. In a time course experiment, protein samples were extracted from SH-SY5Y cells at 0, 12, 24, 30, 36 and 48 h after exposure to 5 μm 4-HPR. An amount of 40 μg of protein of each sample was separated on 4–12% Bis–Tris gel and transferred to PVDF membrane. Antibodies against BBC3, BAK1 and BAX were used for Western blotting analysis. An anti-α-tubulin antibody was used for loading control on each Western blot. ImageQuant™ Image Analysis Software v.5.2 was used to quantify protein bands and the relative signal intensities (comparing to time 0) were shown in the plot after correcting for loading. ♦ represents BBC3, ▪ BAK1, and ▴ BAX
In order to examine the effect of 4-HPR on BBC3 at the protein level, we performed an independent time course experiment on another 4-HPR-sensitive cell line, SH-SY5Y. Total protein was extracted at 0, 12, 24, 30, 36 and 48 h, and Western blotting was performed to examine the expression levels of BBC3, BAK1 and BAX, another proapoptotic BCL2 family member gene (Figure 3b), together with α-tubulin as a loading control. Consistent with our microarray data, quantification of protein bands on the Western blots showed that BBC3 protein was induced (2-fold) as early as 12 h after exposure to 4-HPR, and expressed at a peak (2.7-fold comparing to time 0) at 24 h (Figure 3b). However, BAK1 showed a much lower induction at a later time point (1.3-fold at a peak at 36 h) than that of BBC3, similar to what Lovat et al. (2003a) have described, and there is no detectable change in BAX expression (Figure 3b). Therefore, we have demonstrated in two cell lines that BBC3 expression was induced by 4-HPR at both mRNA level (for SMS-KCNR and SH-SY5Y; see below) and protein level (for SH-SY5Y).
Induction of BBC3 in NB cell lines treated with 4-HPR
To extend the observation that BBC3 is induced in response to 4-HPR in SMS-KCNR and SH-SY5Y cells, we determined the level of induction of BBC3 by quantitative RT–PCR across the eight NB cell lines after a 24 h exposure to 4-HPR with the exception of GI-LI-N, which was analysed at 8 and 16 h due to extensive cell death at 24 h. We discovered that the level of induction of BBC3 was strongly associated with the sensitivity of cell lines to 4-HPR. BBC3 was induced 2–8-fold in the sensitive lines, and did not change in the resistant lines, SK-N-FI and SK-N-SH (Figure 4). BAK1 expression was also analysed by quantitative RT–PCR, but we did not see a significant induction (i.e.,>2-fold) in any of the NB cell lines (data not shown).
Figure 4.
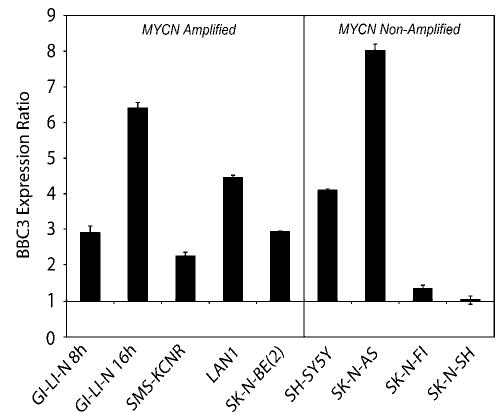
Quantitative RT–PCR of BBC3 gene in NB cell lines. Expression levels of BBC3 were measured by quantitative RT–PCR after 8 and 16 h for GI-LI-N, since these cells are exquisitely sensitive to 4-HPR (Ferrari et al., 2003), and 24 h for the remaining cell lines after treatment with 5 μm 4-HPR. Expression for each gene is represented as a ratio between 4-HPR and ethanol control experiments. Error bars represent the standard errors for three independent experiments
BBC3 mediates 4-HPR-induced apoptosis in NB cells
In order to determine if BBC3 is sufficient to induce apoptosis, we introduced BBC3 expression constructs (Yu et al., 2001) into 4-HPR-sensitive SH-SY5Y cells, and evaluated apoptosis by measuring sub-G1 cell populations using PI profiling. SH-SY5Y cells were chosen for these experiments because the transfection conditions were previously optimized by Amaxa Biosystem (Cologne, Germany), and this cell line has been used extensively in the studies of its response to 4-HPR (Lovat et al., 2002, 2003a). The left panel of Figure 5a shows histograms of representative PI profiles of cells transfected with BBC3 constructs (red), BH3 deletion constructs of BBC3 (Yu et al., 2001) (green) and empty vectors (black). The percentage of sub-G1 cells in three independent PI profiling experiments was calculated, which showed that apoptosis increased to 17.4% in the cells transfected with BBC3 constructs from 5.1 or 8.5% in the cells transfected with empty vectors or BBC3-ΔBH3 constructs (right panel of Figure 5a). We also confirmed that exogenous expression of BBC3-induced cell death in SK-N-AS (4-HPR sensitive) and SK-N-SH (4-HPR resistant) cells (Supplemental Figure). Therefore, BBC3 expression alone is sufficient to induce apoptosis in both 4-HPR-sensitive and -resistant NB cell lines.
Figure 5.
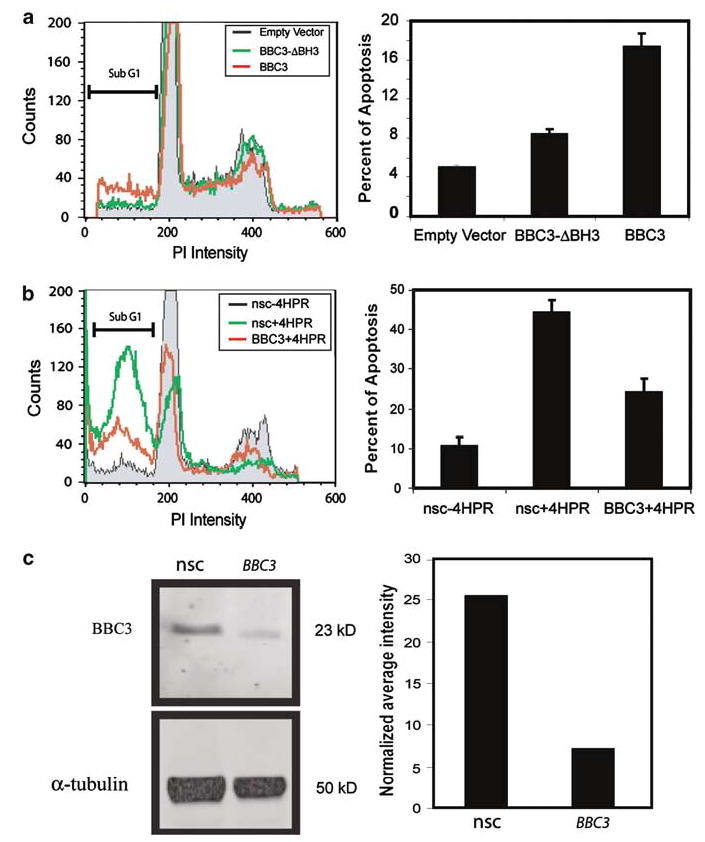
BBC3 mediates 4-HPR-induced apoptosis in SH-SY5Y. (a) Exogenous BBC3-induced apoptosis. The left panel shows histograms of representative PI profiles of cells transfected with BBC3 constructs (red), BH3 deletion constructs of BBC3 (green) and empty vectors (black) at 24 h. The right panel shows the percentage of cell apoptosis measured by PI profiling. Three independent experiments were performed, and error bars represent the standard errors. (b) Reduction of BBC3 attenuates 4-HPR-induced apoptosis. SH-SY5Y cells were transfected with siRNA targeting BBC3 or nonsilencing control (nsc), and then treated with 10 μm 4-HPR after 48 h following transfection. PI profiling was performed following an additional 48 h exposure to 4-HPR. Left panel is a representative PI profile of cells transfected with siRNA targeting BBC3 or nsc with 4-HPR treatment (red and green curves, respectively). The gray area is the PI profile of cells transfected with nonsilencing control (nsc) and treated with ethanol alone. Right panel: quantification of the sub-G1 cell populations in each of the three experiments; the knockdown of BBC3 by specific siRNA targeting therefore attenuates 4-HPR induction by 46% compared to nsc siRNA. This panel shows three independent experiments and the error bars represent the standard error. (c) BBC3 siRNA reduced BBC3 protein by 2.6-fold. An amount of 40 μ g of total protein extracted from SH-SY5Y cells after 30 h 4-HPR treatment was separated on 4–12% Bis–Tris gel and transferred to PVDF membrane. Western blots were performed and visualized by a Typhoon 9410 Variable Mode Imager (left panel), and protein bands were quantified by ImageQuant™ Image Analysis Software (right panel). nsc: nonsilencing control
Finally, we examined if BBC3 is involved in the 4-HPR-induced apoptosis in SH-SY5Y using the siRNA technology. SH-SY5Y cells were transfected with siRNA against BBC3 or nonsilencing control (nsc), and then treated for 48 h with 4-HPR before measuring apoptosis using PI profiling (left panel of Figure 5b). We found that siRNA against BBC3 could inhibit apoptosis induced by 4-HPR by 46% compared to nsc in SH-SY5Y cells in three independent experiments (right panel of Figure 5b). Quantitative RT–PCR verified that the basal expression level of BBC3 was knocked down by 74% with the siRNA (data not shown), and Western blotting revealed a 2.6-fold knockdown of BBC3 protein by siRNA (Figure 5c).
Discussion
Retinoids are attractive reagents for NB treatment due to their effects on cell growth, differentiation and cell death (Abemayor and Sidell, 1989; Lotan et al., 1990; Slawin et al., 1993), and some of them (e.g., 13-cis-RA) have shown clinical utility for patients with high-risk NB (Matthay et al., 1999). Owing in part to the toxicity, the increasing resistance to retinoid acid and continued poor survival rates of these patients, the efficacy of other synthetic retinoids such as fenretinide (4-HPR) is currently undergoing phase 2 trial in the cooperative settings (e.g., Children’s Oncology Group, North America). Although many studies have demonstrated its low toxicity and effectiveness to induce apoptosis in several cancer cell lines, including NB cells resistant to ARTA or 13-cis-RA (Reynolds et al., 2000), the molecular mechanism of 4-HPR-induced apoptosis remains unclear.
We thus investigated the mechanism of action of 4-HPR by first determining the sensitivity to 4-HPR for a panel of NB cell lines, which included both MYCN amplified and MYCN nonamplified lines, and utilized cDNA microarray technology to explore the transcriptional changes caused by this agent. Using WST-1 assays, we found a profound suppression of cell growth in all the four MYCN amplified cell lines and in two of the MYCN nonamplified cell lines (SK-N-AS and SH-SY5Y). SK-N-FI showed moderate resistance to 4-HPR, whereas SK-N-SH showed marked resistance against 4-HPR throughout these time course experiments. The SK-N-SH cell line is a mixed cell line containing both N- and S-type NB cells, and the SH-SY5Y cells were originally derived from this cell line (Ross et al., 1983). Recently, it has been demonstrated that the SH-EP cell line (S-type), also derived from the same line, was resistant to 4-HPR (Myatt et al., 2005), and therefore it is possible that our SK-N-SH cell line contained a high proportion of S-type cells. We further discovered that 4-HPR reduces cell growth through induction of cell death in the sensitive cell lines, indicating that the primary effect of 4-HPR on these sensitive NB cell lines is induction of apoptosis, as previously reported in the literature (Lovat et al., 2002, 2003a, Lovat et al., b).
We identified in our cDNA microarray experiments that the expression level of a transcriptionally regulated proapoptotic gene (Yu et al., 2001), BBC3, was induced by 4-HPR in SMS-KCNR cells. In addition, we have confirmed 4-HPR-induced upregulation of BBC3 at the protein level in another sensitive NB cell line SH-SY5Y. In our panel of eight NB cell lines, we found the highest induction of BBC3 in the six sensitive lines, whereas little or no change in the 4-HPR-resistant lines (SK-N-FI, SK-N-SH). This observation suggests a causal relationship between the induction of this BH3-only gene and 4-HPR-induced apoptosis through regulation of transcription. Interestingly, a recent study demonstrates that treatment of the SH-SY5Y NB cell line with tunicamycin, an inducer of ER stress, leads to upregulation of BBC3, which then initiates the mitochondrial apoptotic pathway (Reimertz et al., 2003). BBC3 belongs to the BH3-only proapoptotic group of the BCL2 family, and is considered to be an initiator of apoptosis (Huang and Strasser, 2000; Yu et al., 2001; Puthalakath and Strasser, 2002). The BH3-only proteins respond to stress stimuli by physically interacting with BCL2 family antiapoptotic proteins to disrupt their protective function to destabilize the mitochondrial membrane (Moreau et al., 2003). This interaction is believed to be upstream of and result in the oligomerization of BAX/BAK1, which is responsible for mitochondrial damage, release of cytochrome c and then cell death (Bouillet and Strasser, 2002).
Our microarray and Western blotting experiments showed upregulation of BAK1, in accordance with recent studies proposing BAK1 as a mediator of an oxidative pathway that causes apoptosis in SH-SY5Y in response to 4-HPR (Lovat et al., 2003a, b). However, similar to what Lovat and co-workers observed, we have only detected a modest upregulation (1.3-fold) of BAK1 protein in SH-SY5Y cells after 36 h of 4-HPR treatment. This small change may explain why we were not able to confirm the 4-HPR-induced upregulation of BAK1 with quantitative RT–PCR in the panel of eight NB cell lines. In contrast, we found a more than 2-fold upregulation of BBC3 at the mRNA level after 4 h and at the protein level after 12 h of 4-HPR treatment (Figure 3). Therefore, our results suggest that BBC3 mediates 4-HPR-induced apoptosis through an early transcriptional activation event, whereas BAK1 may play a role in the downstream apoptotic signaling cascade. Additionally, several studies have demonstrated that stable suppression of BAK1 alone, or BAK1 and BAX, which results in a marked reduction of the levels of these proteins, inhibits 4-HPR-induced cell death (Bouillet and Strasser, 2002).
Finally, we demonstrated that exogenous BBC3 effectively induces apoptosis in NB cells both sensitive and resistant to 4-HPR. Furthermore, siRNA against BBC3, resulting in diminishing BBC3 protein level, could significantly decrease apoptosis induced by 4-HPR. Therefore, we have provided strong evidence in this study that BBC3 is an early mediator of cell death in 4-HPR-induced apoptosis through its transcriptional regulation. Selective upregulation of BBC3 in NB cells may be explored as a novel molecular therapy for NB patients who are resistant to retinoids treatment.
Materials and methods
NB cell lines, cDNA constructs and siRNAs
NB cell lines, including four MYCN amplified (SMS-KCNR, GI-LI-N, LAN-1, SK-N-BE(2)) and four non-MYCN amplified (SH-SY5Y, SK-N-AS, SK-N-FI and SK-N-SH), were kept in RPMI 1640 media (Quality Biological, Gaithersburg, MD, USA) with 10% FBS (HyClone, Logan, UT, USA), 1% Glutamine and 1% P/S (Quality Biological, Gaithersburg, MD, USA), at 37°C. The SMS-KCNR cell line used in this study had been cultured for >2 months in RPMI enriched with 30 μm ATRA, since previous studies reported that ATRA-resistant NB cell lines may acquire higher sensitivity to 4-HPR (Reynolds et al., 2000).
Expression constructs encoding BBC3 and BBC3-ΔBH3 (BBC3 with a deleted BH3 domain) were generous gifts from Dr Vogelstein (Yu et al., 2001). Empty vector to clone these two expression constructs, pCEP4, was purchased from Invitrogen (Invitrogen, Grand Island, NY). The BBC3 siRNA (5′-CCCAGCCTGTAAGATACTGTA-3′) was designed and synthesized by Qiagen.
4-HPR experiments and cell growth assay
4-HPR (from CTEP, NCI) was dissolved in 100% ETOH. Prior to a 4-HPR or vehicle (ETOH) addition, cells were preincubated for 12 h in RPMI 1640 media with 10% charcoal-stripped FBS (HyClone, Logan, Utah, USA), 1% Glutamine, 1% P/S. Throughout this study, we used 5–10 μm of 4-HPR, a concentration sufficient to induce cell death in NB cells as determined by other studies (Maurer et al., 1999; Lovat et al., 2003a, b).
Cell growth was measured using a colorimetric assay based on the WST-1 reagent (Roche Diagnostic GmbH, Mannheim, Germany) to determine the sensitivity of the NB cell lines to 4-HPR. In these assays, 5000 cells were seeded into a 96-well plate containing 200 μl of medium. Three replicated wells were set up for each time point, from 0 to 6 days. At each time point, WST-1 reagent was added to the wells and incubated for 4 h, and then absorbance was measured at a wavelength of 450 nm using a VMax kinetic microplate reader (Molecular Device, Sunnyvale, CA, USA). A blank was set with the same volume of medium and WST-1 reagent without cells.
Cell viability and apoptosis assays
Cell viability was measured using flow cytometry of cells stained with a vital dye, 7-AAD (BD Biosciences, San Jose, CA, USA). In brief, cells were seeded at 70% confluency in 100 mm dishes. After incubation with 5 μm 4-HPR or an equivalent volume of ETOH vehicle for 24 h, 1 × 10⁵ cells were harvested and stained with 7-AAD for 15 min at room temperature in the dark. A total of 10 000 events were acquired for flow cytometry analysis using a FACSCalibur flow cytometer (BD Biosciences, San Jose, CA, USA).
Apoptosis was evaluated using the standard PI-staining protocol. In brief, cells were trypsinized and neutralized in complete media, and subsequently washed with 5 ml of PBS containing 0.1% FBS. Cell pellets (5 × 10⁶ cells) were resuspended in 0.5 ml of PBS containing 0.1% FBS, incubated on ice for 15 min and then fixed overnight at 4°C in 5 ml of 75% ethanol. After fixation, 1 × 10⁶ cells were pelleted and washed in 5 ml PBS containing 0.1% FBS. Cells were stained in PI staining solution (10 μg/ml PI, 250 μg/ml RNAseA, 0.1% FBS in PBS) for 30 min at 37°C, and then 30 000 events were acquired for flow cytometry analysis using a FACSCalibur flow cytometer (BD Bioscience, San Jose, CA, USA). All data analysis was performed in Cellquest™ program (BD Bioscience, San Jose, CA, USA).
Transfection of NB cells using electroporation
Expression constructs (2 μg) and siRNAs (1 μg) were introduced in 2 × 10⁶ NB cells by electroporation using an Amaxa Nucleofector™ kit according to the manufacturer’s protocol (Amaxa Biosystem, Cologne, Germany). Using this kit, we routinely achieved 70–90% transfection efficiency for NB cells as determined by green fluorescent protein (GFP) control plasmid supplied in the kit. For BBC3 overexpression experiments, apoptosis was measured at 24 h after transfection using PI profiling. For RNAi experiments, 10 μm 4-HPR or an equivalent volume of ethanol control was added to cells after 48 h of transfection of RNAis, and apoptosis analysis was performed after another 48 h of exposure to 4-HPR or ethanol control using PI profiling.
RNA extraction, microarray experiments and hierarchical clustering
In the time course experiment, the SMS-KCNR cells were incubated with 4-HRP for 2, 4, 6, 12, 24, 48 and 96 h, and total RNA was extracted according to the published protocols (Wei and Khan, 2002). The cDNA microarrays were manufactured by Agilent Technologies (Palo Alto, CA, USA) containing 11 616 clones derived from sequence-verified IMAGE consortium clones collected at the Cancer Genetics Branch, National Human Genome Research Institute (Bethesda, MD, USA). They represent 9663 unique UniGene clusters, of which 8149 are known genes and 1514 are expressed sequence tags (ESTs).
Labeling of cDNA probes, hybridization and washing of microarrays were performed as described (Hegde et al., 2000). Images were acquired by an Axon Genepix 4000 Scanner (Axon Instruments, CA, USA), and analysed using the Microarray Suite program coded in IPLab (Scanalytics, Fairfax, VA, USA) as described (Chen et al., 1997). Expression ratio and spot quality (Chen et al., 2002) were generated for each of the cDNAs, and spots with an average quality ⩾0.5 (range 0–1) were included in this study.
We obtained GO from the GO consortium (http://www.geneontology.org/). From GO, we identified apoptotic genes present on the microarrays that had changed ⩾2-fold between any two time points during the time course. Hierarchical clustering was performed using the modified Eisen (Eisen et al., 1998) Gene Cluster 3.0 and Java Treeview software (http://bonsai.ims.u-tokyo.ac.jp/~mdehoon/software/cluster/software.htm#ctv). All the gene expression data has been released on our website (http://home.ccr.cancer.gov/oncology/oncogenomics/).
Western blotting
Total protein was extracted from SH-SY5Y cells. An amount of 40 μg of protein was separated on 4–12% Bis–Tris NuPAGE gels, and transferred onto PVDF membrane (Invitrogen, Grand Island, NY, USA). BBC3 was detected with a polyclonal antibody (Sigma-Aldrich, St Louis, MO, USA) at 1 : 350 dilution by chemiluminescence using a horse-radish peroxidase-conjugated anti-rabbit IgG (Amersham, Pscataway, NJ, USA) diluted at 1 : 5000, or by directly scanning on a Typhoon 9410 Variable Mode Imager (Amersham, Pscataway, NJ, USA) using a Cy5-conjugated anti-rabbit IgG (Molecular Probes, Eugene, OR, USA) diluted at 1 : 2000. BAK1 and BAX were detected with monoclonal antibodies (clone AM03 and AM32, respectively, CalBiochem, San Diego, CA, USA) by chemiluminescence using a horse-radish peroxidase-conjugated anti-mouse IgG (Amersham, Pscataway, NJ, USA) diluted at 1 : 10000. Protein loading was controlled by a mouse monoclonal anti-α-tubulin antibody (Sigma-Aldrich, St Louis, MO, USA) at 1 : 5000 dilutions for chemiluminesence, or a Cy5-conjugated anti-mouse IgG (Molecular Probes, Eugene, OR, USA) diluted at 1 : 2000 for direct scan on a Typhoon 9410 Variable Mode Imager. Protein bands were quantified using ImageQuant™ Image Analysis Software v.5.2 (Amersham, Pscataway, NJ, USA).
Quantitative RT–PCR
All cell lines, excluding GI-LI-N, were treated for 24 h with 5 μm 4-HPR and transcriptional levels of apoptosis genes were measured by RT–PCR. For the GI-LI-N cells the experiments were performed following exposure of 8 and 16 h since these cells are exquisitely sensitive to 4-HPR (Ferrari et al., 2003). Total RNA from 4-HPR-treated and control cell lines was harvested as above. RT was performed with 2 μg of total RNA primed by 3 μg of random hexamer and 1 μg of anchored oligo-dT-primer (5′-TTTTTTTTTTTTTTTTTTTTV-3′) using Superscript II reverse transcriptase enzyme (Invitrogen, Grand Island, NY) according to the manufacturer’s instruction. Resulting cDNA was diluted 1 : 10 in water, and real-time PCR was carried out on an ABI 7000 Sequence Detection System (Applied Biosystems, Foster City, CA, USA). Assays-on-Demand (Applied Biosystems, Foster City, CA, USA) were used for assessing expression levels of BBC3, BAK1 and GAPDH. All the reactions were performed in triplicate. In determining the fold changes, both experiment and control values for a specific gene were normalized to GAPDH.
Acknowledgments
We thank Sven Bilke, PhD, Braden T Greer, MS, Alexei Krasnoselsky, PhD for their insightful discussions and excellent technical assistance with this work.
Footnotes
Supplementary Information accompanies the paper on Oncogene website (http://www.nature.com/onc)
References
- Abemayor E, Sidell N. Environ Health Perspect. 1989;80:3–15. doi: 10.1289/ehp.89803. [DOI] [PMC free article] [PubMed] [Google Scholar]
- Bouillet P, Strasser A. J Cell Sci. 2002;115:1567–1574. doi: 10.1242/jcs.115.8.1567. [DOI] [PubMed] [Google Scholar]
- Brodeur GM and Castleberry RP. (1997). Principles and Practice of Pediatric Oncology Pizzo PA and Poplack DG (eds). Lippincott-Raven: Philadelphia. pp 761–797.
- Chen Y, Dougherty ER, Bittner ML. Biomed Opt. 1997;2:364–374. doi: 10.1117/12.281504. [DOI] [PubMed] [Google Scholar]
- Chen Y, Kamat V, Dougherty ER, Bittner ML, Meltzer PS, Trent JM. Bioinformatics. 2002;18:1207–1215. doi: 10.1093/bioinformatics/18.9.1207. [DOI] [PubMed] [Google Scholar]
- Eisen MB, Spellman PT, Brown PO, Botstein D. Proc Natl Acad Sci USA. 1998;95:14863–14868. doi: 10.1073/pnas.95.25.14863. [DOI] [PMC free article] [PubMed] [Google Scholar]
- Ferrari N, Paleari L, Palmisano GL, Tammaro P, Levi G, Albini A, Brigati C. Oncol Rep. 2003;10:973–977. [PubMed] [Google Scholar]
- Hegde P, Qi R, Abernathy K, Gay C, Dharap S, Gaspard R, Hughes JE, Snesrud E, Lee N, Quacken-bush J. Biotechniques. 2000;29:548–550. doi: 10.2144/00293bi01. 552–554, 556 passim. [DOI] [PubMed] [Google Scholar]
- Hsieh TC, Ng C, Wu JM. Biochem Mol Biol Int. 1995;37:499–506. [PubMed] [Google Scholar]
- Huang DC, Strasser A. Cell. 2000;103:839–842. doi: 10.1016/s0092-8674(00)00187-2. [DOI] [PubMed] [Google Scholar]
- Lotan R, Lotan D, Sacks PG. Methods Enzymol. 1990;190:100–110. doi: 10.1016/0076-6879(90)90014-r. [DOI] [PubMed] [Google Scholar]
- Lovat PE, Di Sano F, Corazzari M, Fazi B, Donnorso RP, Pearson AD, Hall AG, Redfern CP, Piacentini M. J Natl Cancer Inst. 2004;96:1288–1299. doi: 10.1093/jnci/djh254. [DOI] [PubMed] [Google Scholar]
- Lovat PE, Oliverio S, Corazzari M, Ranalli M, Pearson AD, Melino G, Piacentini M, Redfern CP. Cancer Lett. 2003a;197:157–163. doi: 10.1016/s0304-3835(03)00098-3. [DOI] [PubMed] [Google Scholar]
- Lovat PE, Oliverio S, Corazzari M, Rodolfo C, Ranalli M, Goranov B, Melino G, Redfern CP, Piacentini M. Cancer Res. 2003b;63:7310–7313. [PubMed] [Google Scholar]
- Lovat PE, Oliverio S, Ranalli M, Corazzari M, Rodolfo C, Bernassola F, Aughton K, Maccarrone M, Hewson QD, Pearson AD, Melino G, Piacentini M, Redfern CP. Cancer Res. 2002;62:5158–5167. [PubMed] [Google Scholar]
- Matthay KK, Villablanca JG, Seeger RC, Stram DO, Harris RE, Ramsay NK, Swift P, Shimada H, Black CT, Brodeur GM, Gerbing RB, Reynolds CP. N Engl J Med. 1999;341:1165–1173. doi: 10.1056/NEJM199910143411601. [DOI] [PubMed] [Google Scholar]
- Maurer BJ, Metelitsa LS, Seeger RC, Cabot MC, Reynolds CP. J Natl Cancer Inst. 1999;91:1138–1146. doi: 10.1093/jnci/91.13.1138. [DOI] [PubMed] [Google Scholar]
- Melino G, Thiele CJ, Knight RA, Piacentini M. J Neurooncol. 1997;31:65–83. doi: 10.1023/a:1005733430435. [DOI] [PubMed] [Google Scholar]
- Moreau C, Cartron PF, Hunt A, Meflah K, Green DR, Evan G, Vallette FM, Juin P. J Biol Chem. 2003;278:19426–19435. doi: 10.1074/jbc.M209472200. [DOI] [PubMed] [Google Scholar]
- Myatt SS, Redfern CP, Burchill SA. Clin Cancer Res. 2005;11:3136–3148. doi: 10.1158/1078-0432.CCR-04-2050. [DOI] [PubMed] [Google Scholar]
- Pahlman S and Hedborg F. (2000). Neuroblastoma Brodeur GM, Sawada T, Tsuchida Y and Voute PA (eds). Elsevier: Amsterdam, pp 9–20.
- Pearson ADJ and Philip T. (2000). Neuroblastoma Brodeur GM, Sawada T, Tsuchida Y and Voute PA (eds). Elsevier: Amsterdam. pp 551–559.
- Pellegrini R, Mariotti A, Tagliabue E, Bressan R, Bunone G, Coradini D, Della Valle G, Formelli F, Cleris L, Radice P, Pierotti MA, Colnaghi MI, Ménard S. Cell Growth Differ. 1995;6:863–869. [PubMed] [Google Scholar]
- Ponzoni M, Bocca P, Chiesa V, Decensi A, Pistoia V, Raffaghello L, Rozzo C, Montaldo PG. Cancer Res. 1995;55:853–861. [PubMed] [Google Scholar]
- Puthalakath H, Strasser A. Cell Death Differ. 2002;9:505–512. doi: 10.1038/sj.cdd.4400998. [DOI] [PubMed] [Google Scholar]
- Reimertz C, Kogel D, Rami A, Chittenden T, Prehn JH. J Cell Biol. 2003;162:587–597. doi: 10.1083/jcb.200305149. [DOI] [PMC free article] [PubMed] [Google Scholar]
- Reynolds CP, Wang Y, Melton LJ, Einhorn PA, Slamon DJ, Maurer BJ. Med Pediatr Oncol. 2000;35:597–602. doi: 10.1002/1096-911x(20001201)35:6<597::aid-mpo23>3.0.co;2-b. [DOI] [PubMed] [Google Scholar]
- Ross RA, Spengler BA, Biedler JL. J Natl Cancer Inst. 1983;71:741–747. [PubMed] [Google Scholar]
- Slawin K, Kadmon D, Park SH, Scardino PT, Anzano M, Sporn MB, Thompson TC. Cancer Res. 1993;53:4461–4465. [PubMed] [Google Scholar]
- Wei JS and Khan J. (2002). DNA Microarrays: A Molecular Cloning Manual Bowtell D, Sambrook J (eds). Cold Spring Harbor Laboratory Press: Cold Spring Harbor, New York. pp 110–119.
- Wu JM, DiPietrantonio AM, Hsieh TC. Apoptosis. 2001;6:377–388. doi: 10.1023/a:1011342220621. [DOI] [PubMed] [Google Scholar]
- Yu J, Zhang L, Hwang PM, Kinzler KW, Vogelstein B. Mol Cell. 2001;7:673–682. doi: 10.1016/s1097-2765(01)00213-1. [DOI] [PubMed] [Google Scholar]
- Ziv Y, Gupta MK, Milsom JW, Vladisavljevic A, Brand M, Fazio VW. Anticancer Res. 1994;14:2005–2009. [PubMed] [Google Scholar]