

Abstract
This study describes a novel strategy to improve the growth performance of Lactococcus lactis by heterologous production of food-grade transglutaminase. The mtg gene from Streptoverticillium mobaraense that encodes the transglutaminase mature protein was cloned into a nisin-inducible expression vector and transformed into L. lactis subsp. cremoris NZ9000. The leaky expression of the mtg gene from the nisA promoter resulted in ammonia formation and carbon flux redistribution at the pyruvate branch. As a consequence, medium acidification was lessened and energy utilization was improved. This led to significantly higher biomass production under aerobic conditions and particularly under non-pH-controlled conditions (up to a 12-fold increase). The results presented here provide a novel way to enhance the growth yield of L. lactis, which is an important step for the purposes of producing proteins of commercial interest using L. lactis as a host.
Lactic acid bacteria are important microorganisms that are widely used in food fermentation industries all over the world. Due to their rapid growth, small genomes, and simple metabolism, lactic acid bacteria are attracting increased attention for the production of food and pharmaceutical products (8). To date, Lactococcus lactis is the most extensively studied lactic acid bacterium, from which a variety of genetic tools have been developed, leading to the successful production of enzymes (25), therapeutic proteins (48), and nutraceuticals (19). However, compared with the other commonly used prokaryotic hosts, e.g., Escherichia coli, the relatively poor growth properties of L. lactis hamper the further increase of volumetric productivity when L. lactis is used to produce certain recombinant products.
The growth of L. lactis is associated with the generation of acidic end products, which accumulate in the extracellular environment (50). The low pH associated with the growth of L. lactis is an important preservative mechanism for dairy product fermentations (41), as the high concentration of organic acids confers upon L. lactis a competitive advantage over known pathogens and other undesirable bacteria (24, 42). However, low pH also generates acid stress, which has detrimental effects on cell physiology, including damage to cell membrane, inhibition of enzymes, and transport systems (20). It has been well recognized that reducing cytoplasm acidification can lessen the acid stress (37).
A number of acid resistance mechanisms have been characterized in L. lactis (40). The primary mechanism to control the internal pH (pHin) is the membrane-bound FoF1-ATPase, which translocates protons to the environment at the expense of ATP (12, 38). ATP is used not only for the generation and maintenance of the proton motive force (PMF) but also in many other cellular processes like sugar transport and macromolecule biosynthesis. Since L. lactis lacks efficient respiration metabolism, major metabolic energy is gained from glycolysis. When large amounts of ATP are required for maintaining the PMF during the growth of L. lactis, the energy generated via glycolysis is not sufficient to allow maximum rates of the biosynthetic machinery and, as a consequence, decreases the growth rate and impedes the further increase of the growth yield of L. lactis (5, 13). Even in a well-buffered medium (e.g., medium containing sodium β-glycerophosphate), the biomass yield of L. lactis that can be finally achieved is around 1 g dry cell weight (DCW) per liter (optical density at 600 nm [OD600] of 2.0 to 3.0). This relatively poor growth yield hampers the exploration of L. lactis as a prokaryotic host in trials to produce fine chemicals.
The generation of alkaline substances, such as ammonia, is another mechanism present in L. lactis to prevent cytoplasm acidification (34). When the extracellular pH (pHex) decreases from 5.2 to 4.7, the glucose consumption of L. lactis stops, while the amino acid catabolism (e.g., deamination) significantly increases (4, 44). Such amino acid catabolism is considered to be a biological stress response to medium acidification, since it contributes to cytoplasm deacidification via the production of ammonia (deamination) and the consumption of H+ in the cytoplasm (12). However, this mechanism will not be activated unless the pHin decreases to a critical value, while large amounts of ATP have already been consumed in maintaining the PMF. Conceivably, if the pHin can be maintained at a certain high level by heterologous expression of an alkali-generating enzyme, the ATP that was previously used in maintaining the PMF might be saved and therefore contribute to other cellular processes, preferably biosynthesis of cellular materials.
Transglutaminases (protein-glutamine γ-glutamyltransferase [EC 2.3.2.13]) are a group of enzymes that catalyze the acyl transfer reaction between the γ-amino groups of a lysine residue, resulting in the formation of an ɛ-(γ-glutamyl) lysine covalent link (14) and ammonia. Calcium-independent transglutaminases have been discovered in actinomycetes, which include, for example, Streptoverticillium cinnamoneum (11) and Streptoverticillium mobaraense (14). The transglutaminase from S. mobaraense has been well characterized (1, 52) and is widely used in food industries for protein modification (27). In this paper, we describe a novel strategy to modify the pHin in L. lactis. This modification was performed by heterologous production of microbial transglutaminase (MTG) from S. mobaraense in L. lactis. We show that the leaky production of MTG raises the pHin, alters the activities of lactate dehydrogenase (LDH) and NADH oxidase (NOX), and changes the spectrum of major acidic end products. As a consequence, the growth of an L. lactis strain with cloned MTG activity was significantly improved. The results presented here provide an alternative way to enhance the growth of L. lactis, which will further the use of L. lactis as a prokaryotic host in metabolic engineering studies.
MATERIALS AND METHODS
Chemicals.
Pyrobest polymerase, restriction enzymes NcoI and XbaI, proteinase K, lysozyme, cetyltrimethylammonium bromide, and saturated phenol were obtained from Takara (Dalian, China). M17 broth was obtained from Fluka (Chemie, Switzerland), and 5 (and 6-)-carboxyfluorescein diacetate N-succinimidyl ester (cFDASE) was obtained from Axxora Life Science Inc. (San Diego, Calif.). N-Carbobenzoxy-l-glutaminylglycine (CBZ-Gln-Gly), valinomycin, nigericin, and HEPES were obtained from Sigma-Aldrich (Steinheim, Germany). All inorganic compounds were of reagent grade or higher quality.
Bacterial strains, culture conditions, and plasmids.
S. mobaraense WSH-Z2 is a laboratory strain screened by our lab and produces food-grade transglutaminase as shown previously (53). Strain L. lactis subsp. cremoris NZ9000 (MG1363 derivative; pepN::nisRK; standard host for a nisin-controlled expression system) (26) and plasmid pNZ8148 (Cmr; inducible expression vector carrying the nisA promoter; derivative of pNZ8048) (26) were kind gifts of Jeroen Hugenholtz, Wageningen Centre for Food Sciences and NIZO Food Research, The Netherlands. S. mobaraense WSH-Z2 was cultured in an MTG production medium on a reciprocal shaker at 30°C for 24 h. The medium contained (per liter) 10 g of glucose, 15 g of soluble starch, 20 g of peptone, 5 g of yeast extract, 2 g of MgSO4·7H2O, and 2 g of K2HPO4, pH 6.8. Inocula of L. lactis NZ9000 and its derived strains were transferred from −70°C stock cultures to M17 broth supplemented with 15 g/liter glucose and incubated at 30°C for 16 h as a preculture. The precultures were used to inoculate fresh complex medium (CM) unless otherwise specified. Strains were grown statically or aerobically (the aeration conditions are specified for different experiments) at 30°C. The CM contained (per liter) 15 g of glucose, 15 g of peptone, 5 g of yeast extract, 0.5 g of MgSO4 · 7H2O, and 0.5 g of vitamin C, pH 6.8. Chloramphenicol (10 μg/ml) was added to M17 broth and the CM as a selection marker for plasmids pNZ8148 and pFL010. pH-controlled aerobic cultivations were performed in a jar fermentor as follows. A preculture of either strain NZ9000(pNZ8148) or strain NZ9000(pFL010) was inoculated into fresh CM to achieve an initial cell number of (1.0 ± 0.5) × 107 CFU/ml. Batch fermentations were carried out in a 2.5-liter jar fermentor (KF-2.5 L; Korea Fermentor Co., Inchon, South Korea) with a working volume of 2 liters at 30°C for 10 h. The aeration rate was 2 liters/min, and the agitation speed was controlled at 600 rpm. The pH was automatically controlled at 6.5 ± 0.1 with 10 N NaOH.
DNA manipulations.
Isolation of chromosomal DNA from S. mobaraense and standard recombinant DNA techniques were performed as described by Sambrook et al. (43). Isolation and transformation of L. lactis plasmid DNA were performed as described in the literature (9).
Construction of strains and plasmids.
Plasmid pNZ8148 contains an NcoI site at the ATG start codon of the nisA gene, which can be used for translational fusions of other genes with the efficient nisA ribosome binding site on the promoter region (7). To make a translational fusion of the mtg gene to the nisA promoter, an NcoI site was introduced at the ATG start codon of the mtg gene. The gene encoding the mature peptide of transglutaminase (without signal sequence) was amplified by using S. mobaraense WSH-Z2 chromosome DNA as a template and two primers designed according to the published nucleotide sequence of the mtg gene from S. mobaraense S-8112 (52): 5′-CGGGCCATGGACTCCGACGACAGGGTCACCCCTC-3′ (containing an NcoI site [underlined]) and 5′CGCGTCTAGATCACGGCCAGCCCTGCTTTACCTTG-3′ (containing an XbaI site [underlined]). The PCR-amplified mtg gene was cloned as an NcoI-XbaI fragment in pNZ8148 digested with NcoI-XbaI, generating plasmid pFL010. The plasmids pNZ8148 and pFL010 were introduced into L. lactis strain NZ9000 by electroporation transformation, yielding L. lactis NZ9000(pNZ8148) and L. lactis NZ9000(pFL010). Plasmid pFL010 was extracted from L. lactis NZ9000(pFL010), and the inserted mtg gene was sequenced by Sangon Biotechnology Company (Shanghai, China). Analysis revealed that the amino acid sequence encoded by the mtg gene from S. mobaraense WSH-Z2 was identical to that of the template strain S. mobaraense S-8112 (52).
Preparation of cell extracts and protein analysis.
Strain NZ9000(pFL010) and strain NZ9000(pNZ8148) were grown aerobically for 10 h. The bacteria were harvested by centrifugation from a 1,000-ml culture (10,000 × g for 10 min at 4°C). The cell pellets were washed twice with ice-cold saline (0.85% NaCl, wt/vol) and resuspended in 25 ml of 200 mM potassium phosphate buffer (pH 7.0) containing 2 mM EDTA. The cells were disrupted ultrasonically at 4°C for 40 cycles of 5 s (ACX 400 sonicator at 20 kHz; Sonic and Materials, Newton, Mass.). Cell debris was removed by centrifugation (10,000 × g for 10 min at 4°C), resulting in a cell extract (CE). Protein concentrations were determined by the Bradford method (2) using bovine serum albumin as a standard. For protein analysis, lactococcal CE was mixed with an equal volume of twofold-concentrated Laemmli buffer, and after being heated at 95°C for 10 min, 10 μl of each sample was analyzed by sodium dodecyl sulfate-polyacrylamide gel electrophoresis.
Analytical methods.
Biomass concentration was determined by measuring the OD600 or the DCW per liter. To the latter aim, a 5-ml culture broth was centrifuged (10,000 × g for 10 min), washed twice with distilled water, and dried at 105°C until a constant weight was achieved. Under these experimental conditions, an OD600 of 1.0 is equal to 0.38 g DCW per liter. Residual glucose concentration was measured by using the Miller method (35). Ammonium concentration was determined by the phenol hypochlorite method (36). Diacetyl concentration was determined by the method described by Hugenholtz and Starrenburg (18).
Internal pH was measured by the fluorescence method developed by Breeuwer et al. (3) using 5 (and 6-)-carboxyfluorescein succimidyl ester (cFSE) as a fluorescent probe. Harvested cells were washed and resuspended in 50 mM potassium HEPES buffer (pH 8.0). Subsequently, the cells were incubated for 10 min at 30°C in the presence of 1.0 μM cFDASE, washed, and resuspended in 50 mM potassium phosphate buffer (pH 7.0). To eliminate nonconjugated cFSE, glucose (final concentration, 10 mM) was added, and the cells were incubated for an additional 30 min at 30°C. The cells were then washed twice, resuspended in 50 mM phosphate buffer (pH 7.0), and placed on ice until they were used. Cells containing fluorescent probe were diluted to a concentration of approximately 107 cells per ml in a 3-ml glass cuvette and placed in the thermostatted cuvette holder of the spectrofluorometer (30°C). Fluorescence intensities were measured at excitation wavelengths of 490 and 440 nm by rapidly alternating the monochromator between both wavelengths. The emission wavelength was 520 nm, and the excitation and emission slit widths were 8 and 10 nm, respectively. At the end of each assay, the extracellular fluorescence signal (background) was determined by filtration of the cell suspension through a 0.22-mm-pore-size membrane filter and measurement of the filtrate. The ratios of 490- to 440-nm measurements were corrected for background signal.
Lactate and acetate concentrations were determined using an Agilent 1100 high-pressure liquid chromatograph equipped with an Agilent G1313A injector and an Agilent G1314A detector (215 nm). Samples withdrawn from different time intervals were centrifuged (10,000 × g for 10 min), and the supernatants were filtered through a 0.22-μm-pore-size filter prior to injection into an Aminex C18 column (4.6 by 200 mm). For the mobile phase, 0.1 M KH2PO4 (pH adjusted to 2.5 with phosphoric acid) was used. The flow rate was maintained at 0.5 ml/min, while the temperature was kept at 25°C. All samples were injected twice.
Ethanol concentration was measured by a gas chromatograph (GC-14A; Shimadzu, Kyoto, Japan) equipped with a flame ionization detector and data processor. Aliquots (1 μl) of samples were injected into a polyethylene glycol capillary column (length, 30 m; internal diameter, 0.53 mm; 1.0-μm film) (Restek). Nitrogen was used as carrier gas with a constant inlet pressure of 0.6 kg/cm2. Quantification was performed with the use of ethanol as an external standard. The chromatographic conditions were as follows: injector temperature, 240°C; detector temperature, 250°C. The column temperature program was as follows: initial temperature, 100°C held for 1 min, and then a temperature increase at a rate of 10°C/min to 240°C.
Solid-phase microextraction gas chromatography-mass spectrometry (GC-MS) analyses were used to identify the volatile organic compounds produced by strainNZ9000(pFL010) and strain NZ9000(pNZ8148). The solid-phase microextraction gas chromatography was performed by manually exposing a 100-μm polydimethylsiloxane fiber (Supelco) to the headspace of individual vials to be tested for 40 min at 50°C and then inserting it directly into the gas chromatograph for desorption and analyses. Analysis was carried out on an Autosystem Gas Chromatograph (Perkin-Elmer)/Q-Mass 910 Mass Spectrometer (Perkin-Elmer). Aliquots (1 μl) of samples were injected on a polyethylene glycol capillary column (length, 30 m; internal diameter, 0.25 mm; 0.25-μm film) (Restek). Helium was used as a carrier gas with a constant flow rate of 0.8 ml/min. The injector temperature was 250°C. The column temperature program was as follows: initial temperature, 36°C held for 3 min, temperature increased at a rate of 4°C/min to 120°C, and temperature increased at a rate of 10°C/min to 230°C and held for 8 min. Other parameters were the following: electron energy, 70 eV; GC-MS interface temperature, 250°C; MS source temperature, 200°C.
Routine transmission electron microscopy.
Stationary cultures of strain NZ9000(pNZ8148) and strain NZ9000(pFL010) grown in M17 broth in the absence of nisin were fixed in glutaraldehyde (2.5% [vol/vol] in 10 mM sodium phosphate buffer, pH 7.2) for 1 h at 4°C and then rinsed three times in 0.1 M sodium cacodylate buffer (pH 7.2). The specimens were prepared on copper grids coated with a thin carbon film and poststained with 1% phosphotungstic acid. All preparations were observed with an H-7000 electron microscope (Hitachi, Japan).
Enzyme assays.
MTG activity was determined by colorimetric assay using CBZ-Gln-Gly as a substrate (16). Buffer A consisted of 0.03 M CBZ-Gln-Gly, 0.1 M NH2OH, 0.01 M reduced glutathione, and 50 mM Tris-HCl (pH 6.0). Buffer B consisted of 1 M HCl, 4% trichloroacetic acid, and 5% FeCl3 · 6H2O. After appropriate dilution, 0.4 ml of lactococcal CE (protein concentration controlled at approximately 8 mg/ml) or fermentation broth of S. mobaraense was added to 1 ml of buffer A, and the mixture was incubated at 37°C for 10 min or 12 h. The reaction was terminated by adding 1 ml of buffer B. After the precipitated protein was removed by centrifugation, the formation of l-glutamic acid-monohydroxamate in the supernatant was determined by measuring the absorbance at 525 nm. One unit of transglutaminase is defined as the formation of 1 μmol of l-glutamic acid-monohydroxamate per minute.
LDH activity in CE was assayed spectrophotometrically at 25°C in a total volume of 3 ml containing 0.1 ml 35 mM sodium pyruvate, 0.1 ml 6 mM NADH, and 2.8 ml of 100 mM potassium phosphate buffer with different pH values (5.3, 5.8, 6.3, 6.8, and 7.3). The reaction was initiated by the addition of 0.1 ml of CE of strain NZ9000(pFL010) and monitored by the decrease in absorbance at 340 nm (A340).
NOX activity in CE was assayed spectrophotometrically at 25°C in a total volume of 1 ml containing 0.8 ml of 62.5 mM potassium phosphate buffer with different pH values (5.3, 5.8, 6.3, 6.8, and 7.3), 0.1 ml of 2.9 mM NADH, and 0.1 ml of 3 mM EDTA. The reaction was initiated by the addition of a suitable amount of CE of strain NZ9000(pFL010) (0.5 to 5 μl) and monitored by the decrease in A340. One unit of enzyme activity (LDH or NOX) is defined as the amount of enzyme required to produce 1 μmol of NAD+ per minute by using an ɛ of 6,220 M−1 cm−1.
Nucleotide sequence accession number.
The sequence of the mtg gene from S. mobaraense WSH-Z2 was deposited in the GenBank database under accession number DQ132977.
RESULTS
Heterologous production of MTG in L. lactis NZ9000.
To introduce MTG activity into L. lactis, the plasmid pFL010, carrying the mtg gene translationally fused to the nisA promoter, was introduced into L. lactis NZ9000. Strain NZ9000(pNZ8148) and strain NZ9000(pFL010) were grown aerobically in M17 broth without nisin induction, and the CEs of the stationary cultures were prepared and subjected to sodium dodecyl sulfate-polyacrylamide gel electrophoresis analysis and an MTG activity assay. In the absence of nisin, no additional protein band withan apparent molecular mass of approximately 37 kDa (theexpected size of MTG) could be seen in the CE of NZ9000(pFL010) (data not shown). However, an MTG assay showed that strain NZ9000(pFL010) does have MTG activity of 0.68 ± 0.04 mU/mg (Fig. 1), suggesting that leaky expression of the mtg gene occurred. Surprisingly, increasing the nisin concentration from 2 ng/ml to 100 ng/ml did not increase the production of MTG in strain NZ9000(pFL010), as neither an additional protein band nor increased MTG activity was observed after increasing the nisin concentration (data not shown). To explain this unusual phenomenon, we first sequenced the promoter region of pFL010, but no base errors were found. Secondly, we checked the bioactivity of the nisin that we used in the induction experiment. This was done by using strain NZ9000(pNZ3201) (31) as a positive control. We found that the addition of 2 ng/ml nisin could reproducibly induce overexpression of γ-glutamylcysteine synthetase. This was consistent with the observation shown in a previous study (31) suggesting that the nisin we used was bioactive. The third trial was to test the sensitivity of strain NZ9000(pNZ8148) and NZ9000(pFL010) to high concentrations of nisin. In the presence of 500 μg/ml nisin, the growth of strain NZ9000(pNZ8148) was nearly abolished, whereas no significant reduction was observed in the growth of strain NZ9000(pFL010). Interestingly, routine transmission electron microscopy revealed that strain NZ9000(pFL010) exhibited a thickened cell wall relative to strain NZ9000(pNZ8148) (Fig. 2). This suggests that the leaky production of MTG in strain NZ9000(pFL010) leads to cell wall thickening and confers upon the host resistance to high concentrations of nisin, which hampers the signal transduction of nisin to the chromosomal nisRK genes in strain NZ9000.
FIG. 1.

Colorimetric assay for measuring MTG activity. Tube 1 contains the CE of strain NZ9000(pFL010) without nisin induction. Tube 2 contains the CE of strain NZ9000(pNZ8148) (negative control). Since the MTG activity in strain NZ9000(pFL010) is fairly low, the mixtures in tubes 1 and 2 were incubated at 37°C for 12 h. The 48-h fermentation broth of S. mobaraense WSH-Z2 was used as a positive control, of which the volumetric MTG activity was 2.16 ± 0.13 U/ml (measured by the standard protocol; 10-min incubation). The 1,000-, 200-, or 100-fold diluted S. mobaraense fermentation broths were added to tube 3, 4, or 5, in which the mixtures were also incubated at 37°C for 12 h. The volumetric MTG activities in tubes 1 to 5 were as follows: 5.65 ± 0.28, 0, 1.92 ± 0.14, 6.66 ± 0.14, or 10.94 ± 0.42 mU/ml, respectively. For tubes 3 to 5, MTG activity recovery rates were calculated as [(A12 h × D)/A10 min] × 100, where A12 h and A10 min represent the MTG activity obtained after a 12-h or 10-min incubation, respectively, and D represents the dilution factor. The MTG activity recovery rates for tubes 3 to 5 were 89%, 62%, and 51%, suggesting that the 12-h incubation assay is still valid. As the protein concentration of the CE used in tube 1 was 8.3 ± 0.1 mg/ml, the specific MTG activity of NZ9000(pFL010) was 0.68 ± 0.04 mU/mg. All measurements were done in duplicate on two independent samples.
FIG. 2.

Transmission electron microscopy of L. lactis (magnification, ×30,000). (A) Strain NZ9000(pNZ8148). (B) Strain NZ9000(pFL010). The delimitation by a white arrow and an opposing black arrow represents the cell wall.
Effect of β-ME on the aerobic growth of L. lactis.
We investigated the effect of a disulfide bond reducer, β-mercaptoethanol (β-ME), on the growth of strain NZ9000(pFL010) and strain NZ9000(pNZ8148). The growth rate of the control strain NZ9000(pNZ8148) was slightly retarded by the addition of different concentrations of β-ME (Fig. 3C and D). However, a significantly reduced growth rate of strain NZ9000(pFL010) was observed in the presence of 30 mM β-ME, and growth was abolished when the concentration of β-ME increased to 60 mM (Fig. 3A). Figure 3B further demonstrates that the addition of a high concentration of β-ME (60 mM) to the culture of strain NZ9000(pFL010) led to cell death continuously over a long period of time. This suggests that the produced MTG in L. lactis NZ9000(pFL010) can be detrimental when the intracellular redox status changes to a more reduced level.
FIG. 3.

Effect of the addition of β-ME on aerobic growth of strain NZ9000(pFL010) and strain NZ9000(pNZ8148). Different concentrations of β-ME (⋄, 0 mM; □, 30 mM; ▵, 60 mM) were added to 250-ml flasks containing 15 ml of M17 broth. Precultures of L. lactis were inoculated to achieve an initial cell number of (1.0 ± 0.5) × 107 CFU/ml. Cultivations were performed on a shaker at 220 rpm for 24 h, during which the time course of biomass and viable cells of both cultures were measured. (A) Strain NZ9000(pFL010) biomass. (B) Strain NZ9000(pFL010) viable cells. (C) Strain NZ9000 (pNZ8148) biomass. (D) Strain NZ9000(pNZ8148) viable cells. Results are expressed as the means of duplicate measurements on three independent samples. The standard deviations were lower than 5% of the values (for biomass measurements) or 15% of the values (for CFU measurements).
Heterologous production of MTG enhances the aerobic growth of L. lactis.
Although the production of MTG in L. lactis NZ9000(pFL010) cannot be increased by nisin induction, the presence of detectable activity of MTG due to leaky expression of the mtg gene allowed us to explore the effect of MTG on lactococcal growth performance. CM was used instead of M17 broth because CM lacks sodium β-glycerophosphate. The relatively poor buffering capacity of the CM enabled us to characterize whether the production of MTG could enhance the growth of strain NZ9000(pFL010).
When grown in CM under static conditions, strain NZ9000(pFL010) had a maximal biomass concentration of 0.88 g/liter, which was 2.7-fold that of strain NZ9000(pNZ8148) (0.33 g/liter). Remarkably, when the strains were grown in CM under shaking conditions, an even larger growth difference between strain NZ9000(pFL010) and strain NZ9000(pNZ8148) was observed. To further characterize this, both strains were incubated aerobically in two jar fermentors in parallel. The time course of lactococcal growth under pH-controlled (6.5 ± 0.1) conditions and non-pH-controlled conditions was monitored, as shown in Fig. 4 and 5.
FIG. 4.
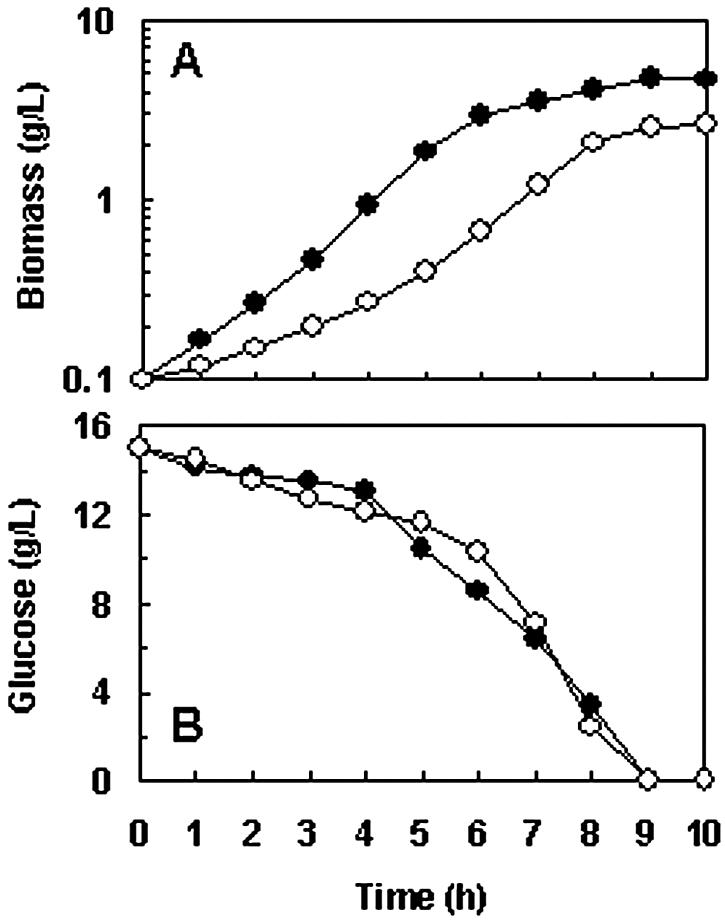
Growth characteristics of strain NZ9000(pFL010) (•) and strain NZ9000(pNZ8148) (○) under pH-controlled aerobic culture conditions. (A) Cell growth. (B) Glucose consumption. Cultivations were performed in a 2.5-liter jar fermentor containing 2 liters of CM. The aeration rate was 2 liters/min, and the agitation speed was controlled at 600 rpm. The pH of both cultures was controlled at 6.5 ± 0.1. Results are expressed as the means of duplicate measurements at the same time points in three independent experiments. The standard deviations were lower than 10% of the values.
FIG. 5.
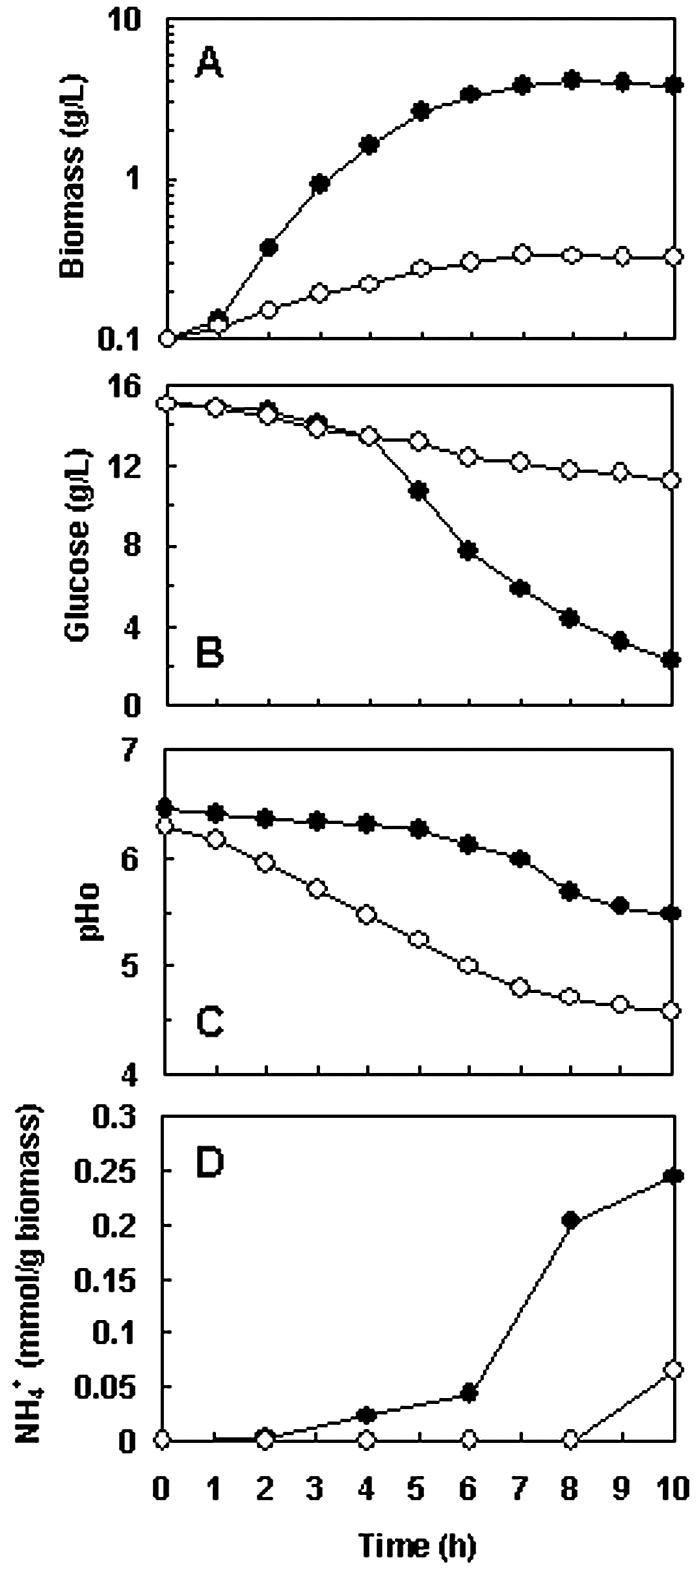
Growth characteristics of strain NZ9000(pFL010) (•) and strain NZ9000(pNZ8148) (○) under non-pH-controlled aerobic conditions. (A) Cell growth. (B) Glucose consumption. (C) pHex. (D) Ammonium formation. Cultivations were performed in a 2.5-liter jar fermentor containing 2 liters of CM. The aeration rate was 2 liters/min, and the agitation speed was controlled at 600 rpm. Results are expressed as the means of duplicate measurements at the same time points in three independent experiments. The standard deviations were lower than 10% of the values.
Under pH-controlled conditions (Fig. 4), the lag phase of strain NZ9000(pFL010) was shorter while the logarithmic phase was longer than the respective phases of strain NZ9000(pNZ8148). As M17 broth was used for preculture, and the final pHs of precultures of strain NZ9000(pFL010) and strain NZ9000(pNZ8148) were 6.59 ± 0.04 and 5.26 ± 0.06, respectively, the shorter lag phase of strain NZ9000(pFL010) could be due to inoculation with a culture that was grown under conditions with a favorable pH. The maximal biomass concentration achieved by strain NZ9000(pFL010) was 4.73 g/liter, which was 1.8-fold that of strain NZ9000(pNZ8148). No significant difference between the glucose consumption rates of these two strains was observed. The efficiency of biomass synthesis relative to glucose consumption (Yx/s) of both strains under pH-controlled aerobic conditions was calculated using an interpolation method, and the data are shown in Fig. 4 and 5. The Yx/s of strain NZ900(pFL010), 71.7 g of biomass per mol of glucose (g/mol), was 2.6-fold that of strain NZ9000(pNZ8148). The relatively low Yx/s of the latter strain indicates that it has to consume more substrate to gain more ATP for maintenance. This suggests that strain NZ9000(pFL010) hasamore efficient energy utilizing machinery than strain NZ9000(pNZ8148). To better understand the metabolism of these two strains under pH-controlled aerobic conditions, the production of major metabolic products was quantitatively analyzed (Table 1). Strain NZ9000(pFL010) had abolished lactate production. In addition, the production of acetate, ethanol, and diacetyl of strain NZ9000(pFL010) decreased by 30%,53%, and 11%, respectively, compared to that of strain NZ9000(pNZ8148). The difference between the metabolite spectra of strain NZ9000(pFL010) and NZ9000(pNZ8148) was further qualitatively analyzed by GC-MS. Comparison of the GC-MS diagram revealed that strain NZ9000(pFL010) had reduced production of acetoin and 2,3-butanediol but significantly increased production of isoamyl alcohol (3-methyl-1-butanol) and phenylethyl alcohol (data not shown). The significant difference in the metabolite spectra of these two strains indicates a pronounced metabolic shift at the pyruvate node in strain NZ9000(pFL010).
TABLE 1.
Spectrum of major metabolic products produced by L. lactis NZ9000(pFL010) and NZ9000(pNZ8148)
| Strain | Lactate (mM) | Acetate (mM) | Ethanol (mM) | Diacetyl (μM) |
|---|---|---|---|---|
| NZ9000(pFL010) | Not detectable | 0.65 ± 0.05 | 35.8 ± 0.7 | 5.9 ± 0.2 |
| NZ9000(pNZ8148) | 2.02 ± 0.05 | 0.92 ± 0.06 | 76.3 ± 0.7 | 6.6 ± 0.3 |
Under non-pH-controlled conditions (Fig. 5), the growth difference between strain NZ9000(pFL010) and strain NZ9000(pNZ8148) was more striking. The maximal biomass concentration achieved by strain NZ9000(pFL010) was 4.13 g/liter, which was slightly (12.7%) lower than when the strain was grown under pH-controlled conditions (Fig. 4). However, the growth of strain NZ9000(pNZ8148) was significantly reduced. The maximal biomass concentration, 0.34 g/liter, was only 8% of that of strain NZ9000(pFL010) under the same conditions (Fig. 5A). In addition, a remarkable difference between the glucose consumption rates of strain NZ9000(pFL010) and strain NZ9000(pNZ8148) was observed after 4 h of incubation (Fig. 5B). The pHex values of strain NZ9000(pNZ8148) and strain NZ9000(pFL010) at this time point declined from 6.3 to 5.47 and from 6.5 to 6.3, respectively (Fig. 5C). Cells of strain NZ9000(pNZ8148) and strain NZ9000(pFL010) grown for 5 h were taken from the fermentors, labeled with cFSE, and subjected to pHin analyses (3). The pHin for strain NZ9000(pNZ8148) grown for 5 h was 6.14, while the corresponding pHex was 5.23. The ΔpH, 0.91 pH unit, is within the range of the normal ΔpHs of L. lactis (46). However, attempts to measure the pHin of strain NZ9000(pFL010) have so far been unsuccessful, as the fluorescence signal at the pH-sensitive wavelength (490 nm) was always lower than the fluorescence signal at the pH-insensitive wavelength (440 nm) (data not shown). This indicates that the cells of strain NZ9000(pFL010) were not labeled by cFSE. We postulate that the thickened cell wall of strain NZ9000(pFL010) might prevent the cells from taking up cFSE when they were incubated with its diacetate ester cFDASE, resulting in the failure of pHin measurements. As pHex can mirror pHin (46), the pHex can be used as an alternative parameter to evaluate the pHin of strain NZ9000(pFL010). The rapidly decreased pHex of strain NZ9000(pNZ8148) suggested that its intracellular acidification might be much stronger than that of strain NZ9000(pFL010). Interestingly, after 10 h of incubation, the pHex of strain NZ9000(pFL010), 5.5, was about 0.9 pH unit higher than that of strain NZ9000(pNZ8148) (Fig. 5C). This implies that the extracellular concentration of H+ of strain NZ9000(pFL010) was approximately 10 times lower than that of strain NZ9000(pNZ8148), suggesting that fewer protons were translocated to the environment and/or fewer protons were generated/accumulated in the cytoplasm in strain NZ9000(pFL010).
The time course of specific ammonium production (mmol of ammonium per g of biomass) revealed that strain NZ9000(pFL010) started to produce ammonia at 4 h of fermentation (Fig. 5D), when the significant difference between the glucose consumption rates of two strains appeared (Fig. 5B). The specific ammonium production of strain NZ9000(pFL010) kept increasing along with the extended incubation times, suggesting the intracellularly produced MTG was functional and generating ammonia continuously. Ammonium formation by strain NZ9000(pNZ8148) was observed only after 10 h of incubation, while the pHex decreased to 4.6. This demonstrates that the amino acid catabolism (e.g., deamination) in a regular L. lactis strain will not be activated as a stress response to medium acidification (12) until the pHex decreases to a certain value (4, 44). After 10 h of incubation, the absolute NH4+ concentration in the culture of strain NZ9000(pFL010) reached 0.94 mM, which was 43-fold that of strain NZ9000(pNZ8148) (0.022 mM). These results suggest that generation of ammonia by strain NZ9000(pFL010) is an important factor that conferred on the host a significantly improved biomass yield under non-pH-controlled conditions.
The Yx/s values of strain NZ9000(pFL010) and strain NZ9000(pNZ8148) under non-pH-controlled aerobic conditions were 72.9 g/mol and 13.4 g/mol, respectively. This indicated that the Yx/s difference between strain NZ9000(pFL010) and strain NZ9000(pNZ8148) increased from 2.6-fold under pH-controlled aerobic conditions to 5.4-fold under non-pH-controlled aerobic conditions. Assuming 2 mol of ATP was generated from 1 mol of glucose in both strains, the apparent energetic yields (YATP) of strain NZ9000(pFL010) and strain NZ9000(pNZ8148) under non-pH-controlled aerobic conditions were 36.5 g/mol and 6.7 g/mol. This suggests again that strain NZ9000(pFL010) has a more efficient energy utilizing machinery, which can be ascribed to the fact that much less energy was used to maintain the PMF due to lessened medium acidification. As a consequence, the growth of strain NZ9000(pFL010) was significantly enhanced under non-pH-controlled aerobic conditions. Remarkably, the Yx/s of strain NZ9000(pFL010) grown under non-pH-controlled conditions (72.9 g/mol) was nearly identical to that when the strain was grown under pH-controlled conditions (71.7 g/mol). This could be due to the cells themselves having a strong buffer capacity; therefore, the maintenance of a stable extracellular pH did not affect the biomass yield significantly.
Effect of pH on the activities of LDH and NOX of L. lactis NZ9000(pFL010).
To investigate whether the abolished lactate production and 30% reduced acetate production in strain NZ9000(pFL010) were due to the elevated pHin, the effect of pH on the activities of LDH and NOX was determined in an in vitro experiment. As shown in Table 2, the increase of pH led to increased activity of NOX but decreased activity of LDH. This in vitro experiment suggests that the increase of pHin in strain NZ9000(pFL010) may contribute to the increased ratio of NOX activity to LDH activity.
TABLE 2.
Effect of pH on the activities of LDH and NOX of L. lactis NZ9000(pFL010)
| pH | LDH activity (U/mg of protein) | NOX activity (U/mg of protein) |
|---|---|---|
| 7.3 | 2.38 ± 0.07 | 0.76 ± 0.04 |
| 6.8 | 3.62 ± 0.05 | 0.61 ± 0.06 |
| 6.3 | 4.62 ± 0.02 | 0.45 ± 0.05 |
| 5.8 | 4.66 ± 0.02 | 0.32 ± 0.01 |
| 5.3 | 4.84 ± 0.03 | 0.29 ± 0.02 |
Comparison of lactococcal growth under different culture conditions.
Table 3 summarizes the growth characteristics of strain NZ9000(pFL010) and strain NZ9000(pNZ8148) grown in M17 broth or CM under static or shaking conditions. In general, the aerobic biomass yield of strain NZ9000(pFL010) was much higher than its static biomass yield (Table 3). We postulate that the intracellular activity of MTG in strain NZ9000(pFL010) might be higher under aerobic conditions than under static conditions, as it has been recently shown that the tissue transglutaminase can be activated by intracellular reactive oxygen species (28). Notably, the significant growth advantage of strain NZ9000(pFL010) over strain NZ9000(pNZ-8148) was not observed when the strains were grown statically in M17 broth. This might be due to the leaky production of MTG that led to an increased pHin in strain NZ9000(pFL010), which subsequently decreased the activity of LDH. As NOX is not functional under static conditions, the regeneration of NADH in strain NZ9000(pFL010) might be retarded due to the decrease of LDH activity. Consequently, the glycolysis rate and cell growth rate of strain NZ9000(pFL010) decreased, compared to strain NZ9000(pFL010), when the strain was grown in a well-buffered medium, i.e., M17 broth, under static conditions.
TABLE 3.
Growth characteristics of strain NZ9000(pFL010) and NZ9000(pNZ8148)a
| Strain | Biomass in M17 broth (g/liter)
|
Biomass in CM (g/liter)
|
||
|---|---|---|---|---|
| Aerobic | Static | Aerobic | Static | |
| NZ9000(pFL010) | 4.46 ± 0.05 | 0.97 ± 0.03 | 4.02 ± 0.06 | 0.88 ± 0.03 |
| NZ9000(pNZ8148) | 0.97 ± 0.01 | 1.20 ± 0.01 | 0.31 ± 0.01 | 0.33 ± 0.02 |
Growth experiments were performed in triplicate in 250-ml flasks containing 15 ml of M17 broth or CM. Both strains were grown in M17 broth for 16 h, and the cultures were used to inoculate fresh M17 broth or CM. Aerobic cultures were cultivated on a reciprocal shaker with a rotation speed of 200 rpm. All cultivations were for 12 h at 30°C.
DISCUSSION
Why can MTG be actively expressed in L. lactis?
Heterologous expression of the mtg gene as a mature enzyme may be disastrous for non-MTG-producing microorganisms. This has been shown in a recombinant E. coli strain carrying a synthetic gene encoding the mature protein of MTG, where the inductive expression of MTG resulted in significantly retarded cell growth followed by cell lysis (49). In our study, the detectable activity of MTG present in L. lactis NZ9000(pFL010) due to leaky expression of the mtg gene did not lead to cell death. We postulate that this might be due to differences in the redox systems of L. lactis and E. coli. Structural disulfide bonds are difficult to form in the cytoplasm of wild-type E. coli because of the highly reduced intracellular environment maintained by the reduced glutathione/thioredoxin/glutaredoxin system (39). Under such a circumstance, the glutaminyl and lysyl residues of many proteins might be unmasked and subsequently attacked by MTG, leading to essential cytosolic proteins cross-linking and subsequent cell death (49). However, structural disulfide bonds may be formed in L. lactis NZ9000, a derivative of L. lactis subsp. cremoris MG1363. Previous studies have shown that strain MG1363 can neither synthesize nor import glutathione (30) and does not have glutaredoxin/glutaredoxin reductase systems (23). Recently, the thioredoxin/thioredoxin reductase system in L. lactis MG1363 was shown to be not essential for thiol-disulfide bond balance (51). The formation of disulfide bonds in the cytoplasm of L. lactis NZ9000 might lead to partial aggregation of cytosolic proteins with glutaminyl and lysyl residues masked, which reduces the catalytic sites of MTG as a consequence. However, when a disulfide bond reducer, β-ME, was added to the culture of strain NZ9000(pFL010), a dramatic decrease in the cell growth rate and, even worse, continuous cell death were observed (Fig. 3). This indicates that the redox status greatly affects the intracellular activity of MTG. Our observation is also consistent with a recent report that shows that the catalytic activity of MTG can be significantly enhanced in the presence of reducing agents such as dithiothreitol or glutathione (22).
Why is the expression of the mtg gene not induced by nisin?
Leaky expression of the mtg gene from the nisA promoter was observed in the present study. Leakage in the nisin-controlled expression system has also been observed by other researchers, and it is believed that the leakage does not depend on the target gene but is a property of the nisin-controlled expression system itself (Igor Mierau, NIZO Food Research, personal communication). Surprisingly, the nisA promoter could not be induced by nisin when the mtg gene was translationally fused to the nisA promoter. Further experiments showed that strain NZ9000(pFL010) was nisin resistant and had a thickened cell wall (Fig. 2). Several studies have shown that nisin-resistant variants have a thicker and stronger cell wall (33), which contributes to the nisin resistance, as nisin acts on the cytoplasmic membrane (10). Recently, transglutaminase was found to be involved in cell wall construction in Saccharomyces cerevisiae (21). From this viewpoint, the MTG that was produced in strain NZ9000(pFL010) might also be involved in the thickening of the cell wall of L. lactis. This might explain why strain NZ9000(pFL010) exhibits nisin resistance and why nisin does not have an inducible effect on the expression of the mtg gene translationally fused to the nisA promoter.
Why does the leaky expression of MTG significantly enhance the growth performance of L. lactis?
Many acid-tolerant fermentative bacteria have developed a pHin regulation mechanism, in which the pHin decreases along with the decrease of pHex during growth in order to maintain a constant pH gradient rather than a constant pHin (5). The significantly higher pHex of strain NZ9000(pFL010) relative to strain NZ9000(pNZ8148) undernon-pH-controlled conditions implies that the pHin in the former is also higher than that in the latter. When incubated in CM under non-pH-controlled aerobic conditions for 10 h, strain NZ9000(pFL010) had a specific NH4+ production ability of 3.7-fold that of strain NZ9000(pNZ8148) (Fig. 5D). This can be attributed to the detectable MTG activity in strain NZ9000(pFL010). Obviously, the NH3 generated from the MTG-catalyzed reactions neutralized protons and lessened the intracellular acidification.
In addition, a large portion of ATP that is generally used to maintain the PMF in strain NZ9000(pNZ8148) would be saved in NZ9000(pFL010), as the biomass yield on substrate and energy yield were greatly improved in strain NZ9000(pFL010). Therefore, the improved energy-utilizing efficiency might be the major reason accounting for the significant improvement in the growth of strain NZ9000(pFL010). Interestingly, although it is conceivable from the release of ammonium that the MTG did catalyze certain reactions in strain NZ9000(pFL010), cell death was not observed unless a high concentration of a disulfide bond reducer was added. This suggests that the proteins that were involved in MTG catalytic reactions are not essential for L. lactis.
The abolished lactate production and 30% reduced acetate production in strain NZ9000(pFL010) also contributed to the enhancement of aerobic growth. NADH generated from L. lactis glycolysis can be regenerated either via LDH or via NOX. It is interesting that lactate production was abolished in strain NZ9000(pFL010) under aerobic conditions, suggesting that the NADH regeneration was affected by the production of MTG. As shown in Table 2, an increase in pH led to increased activity of NOX but decreased activity of LDH. This in vitro experiment suggests that the increase of pHin in strain NZ9000(pFL010) may lead to an increased ratio of NOX activity to LDH activity. As the Km of NOX for NADH (25 μM) (17) is far lower than that of LDH for NADH (100 μM) (6), NOX could favorably compete with LDH for NADH. Our observation is consistent with a previous report (32), where the abolished lactate production was also observed in L. lactis NZ9800, which overproduced a heterologous H2O-forming NADH oxidase.
Determination of the metabolite spectra revealed that the cloned MTG activity led to a pronounced metabolic shift at thepyruvate branch. In the culture of strain NZ9000(pFL010), the concentration of major pyruvate-derived metabolites (lactate, acetate, ethanol, acetoin, diacetyl, and 2,3-butanediol) all decreased, to different extents. However, GC-MS analysis revealed that strain NZ9000(pFL010) produced at least 10 times higher isoamyl alcohol and phenylethyl alcohol (qualitative estimation) than NZ9000(pNZ8148). Isoamyl alcohol and phenylethyl alcohol are flavor compounds that are typically found in cheese (47). They are supposed to be formed from leucine or phenylalanine by lactic acid bacteria (47). How L. lactis synthesizes these two alcohol compounds remains unknown, as no clear genetic or biochemical evidence (even considering the genome information) show that L. lactis is able to produce these compounds. Considering that L. lactis can synthesize leucine and phenylalanine and that these two amino acids originated from glycolysis (leucine from pyruvate and phenylalanine from phosphoenolpyruvate), the increased production of isoamyl alcohol and phenylethyl alcohol might account for the reduced production of major pyruvate-derived metabolites.
Improvement of the biomass yield of L. lactis is an important step toward the application of producing heterologous proteins, either in cytoplasmic form or in secreted form. Although secretion is an efficient way to achieve higher heterologous protein yields (29), the cell wall of L. lactis is certainly a barrier for secreting proteins. It has been shown that a strain of L. lactis subsp. lactis showing increased sensitivity to lysozyme had threefold-higher secreted enzyme activities than a standard laboratory strain (45). Thus, the thickened cell wall of L. lactis NZ9000 with cloned MTG activity might be a limitation for producing secreted proteins. Nevertheless, strain NZ9000(pFL010) could be used to produce heterologous protein in a cytoplasmic form, given that the target protein will not be cross-linked by the intracellularly active MTG.
Recently, Gaudu et al. (15) reported that L. lactis acquired an improved growth yield (OD600 of 10.0) in the presence of oxygen via a respiration metabolism when 10 μM of heme was added. An improvement in oxygen tolerance and long-term survival were also observed (15). In the present study, the leaky expression of the mtg gene in L. lactis significantly increases the cytoplasmic buffering capacity, changes the metabolite spectrum, and reduces the total acidic products produced. As a consequence, the aerobic growth of L. lactis was significantly improved. Under non-pH-controlled aerobic conditions, the maximal biomass of strain NZ9000(pFL010) reached 4.13 g/liter (OD600 of 10.84, equivalent to 7.7 × 10¹⁰ CFU/ml). This result shows that the improved aerobic growth yield of lactococci can be achieved either by our approach (saving energy) or by Gaudu's approach (generating more energy) (15). By simply producing a food-grade transglutaminase in L. lactis, our investigation provides an alternative way to achieve high-cell-density cultures of L. lactis, which will further the application of L. lactis in metabolic engineering.
Acknowledgments
This work was supported by the National Natural Sciences Foundation of China (contract no. 30300009).
We thank Jeroen Hugenholtz for providing strain NZ9000 and plasmid pNZ8148, Kieran Ryan for critically reading the manuscript, and Igor Mierau for stimulating discussion. We are grateful to Kang Wu for electron microscopy analyses, Xian-Yan Liao for assistance in high-pressure liquid chromatography analyses, and Qi Li for diacetyl analyses.
REFERENCES
- 1.Ando, H., M. Adachi, K. Umeda, A. Matsuura, M. Nonaka, R. Uchio, H. Tanaka, and M. Motoki. 1989. Purification and characteristics of novel transglutaminase derived from microorganisms. Agric. Biol. Chem. 53:2613-2617. [Google Scholar]
- 2.Bradford, M. M. 1976. A rapid and sensitive method for the quantitation of microgram quantities of protein utilizing the principle of protein-dye binding. Anal. Biochem. 72:248-254. [DOI] [PubMed] [Google Scholar]
- 3.Breeuwer, P., J. Drocourt, F. Rombouts, and T. Abee. 1996. A novel method for continuous determination of the intracellular pH in bacteria with the internally conjugated fluorescent probe 5 (and 6-)-carboxyfluorescein succinimidyl ester. Appl. Environ. Microbiol. 62:178-183. [DOI] [PMC free article] [PubMed] [Google Scholar]
- 4.Christensen, J. E., E. G. Dudley, J. A. Pederson, and J. L. Steele. 1999. Peptidases and amino acid catabolism in lactic acid bacteria. Antonie Leeuwenhoek 76:217-246. [PubMed] [Google Scholar]
- 5.Cook, G. M., and J. B. Russell. 1994. The effect of extracellular pH and lactic acid on pH homeostasis in Lactococcus lactis and Streptococcus bovis. Curr. Microbiol. 28:165-168. [Google Scholar]
- 6.Crow, V. L., and G. G. Pritchard. 1977. Fructose 1,6-diphosphate-activated l-lactate dehydrogenase from Streptococcus lactis: kinetic properties and factors affecting activation. J. Bacteriol. 131:82-91. [DOI] [PMC free article] [PubMed] [Google Scholar]
- 7.de Ruyter, P. G. G. A., O. P. Kuipers, and W. M. de Vos. 1996. Controlled gene expression systems for Lactococcus lactis with the food-grade inducer nisin. Appl. Environ. Microbiol. 62:3662-3667. [DOI] [PMC free article] [PubMed] [Google Scholar]
- 8.de Vos, W. M., and J. Hugenholtz. 2004. Engineering metabolic highways in Lactococci and other lactic acid bacteria. Trends Biotechnol. 22:72-79. [DOI] [PubMed] [Google Scholar]
- 9.de Vos, W. M., P. Vos, H. de Haard, and I. Boerrigter. 1989. Cloning and expression of the Lactococcus lactis subsp. cremoris SK11 gene encoding an extracellular serine proteinase. Gene 85:169-176. [DOI] [PubMed] [Google Scholar]
- 10.Dielbandhoesing, S. K., H. Zhang, L. H. Caro, J. M. van der Vaart, F. M. Klis, C. T. Verrips, and S. Brul. 1998. Specific cell wall proteins confer resistance to nisin upon yeast cells. Appl. Environ. Microbiol. 64:4047-4052. [DOI] [PMC free article] [PubMed] [Google Scholar]
- 11.Duran, R., M. Junqua, J. M. Schmitter, C. Gancet, and P. Goulas. 1998. Purification, characterisation, and gene cloning of transglutaminase from Streptoverticillium cinnamoneum CBS 683.68. Biochimie 80:313-319. [DOI] [PubMed] [Google Scholar]
- 12.Even, S., N. D. Lindley, and M. Cocaign-Bousquet. 2003. Transcriptional, translational and metabolic regulation of glycolysis in Lactococcus lactis subsp. cremoris MG 1363 grown in continuous acidic cultures. Microbiology 149:1935-1944. [DOI] [PubMed] [Google Scholar]
- 13.Even, S., N. D. Lindley, P. Loubiere, and M. Cocaign-Bousquet. 2002. Dynamic response of catabolic pathways to autoacidification in Lactococcus lactis: transcript profiling and stability in relation to metabolic and energetic constraints. Mol. Microbiol. 45:1143-1152. [DOI] [PubMed] [Google Scholar]
- 14.Folk, J. E. 1980. Transglutaminases. Annu. Rev. Biochem. 49:517-531. [DOI] [PubMed] [Google Scholar]
- 15.Gaudu, P., K. Vido, B. Cesselin, S. Kulakauskas, J. Tremblay, L. Rezaiki, G. Lamberret, S. Sourice, P. Duwat, and A. Gruss. 2002. Respiration capacity and consequences in Lactococcus lactis. Antonie Leeuwenhoek 82:263-269. [PubMed] [Google Scholar]
- 16.Grossowicz, N., E. Wainfan, E. Borek, and H. Waelsch. 1950. The enzymatic formation of hydroxamic acids from glutamine and asparagine. J. Biol. Chem. 187:111-125. [PubMed] [Google Scholar]
- 17.Higuchi, M., M. Shimada, Y. Yamamoto, T. Hayashi, T. Koga, and Y. Kamio. 1993. Identification of two distinct NADH oxidases corresponding to H2O2-forming oxidase and H2O-forming oxidase induced in Streptococcus mutans. J. Gen. Microbiol. 139:2343-2351. [DOI] [PubMed] [Google Scholar]
- 18.Hugenholtz, J., and M. J. C. Starrenburg. 1992. Diacetyl production by different strains of Lactococcus lactis subsp. lactis var. diacetylactis and Leuconostoc ssp. Appl. Microbiol. Biotechnol. 38:17-22. [Google Scholar]
- 19.Hugenholtz, J., W. Sybesma, M. N. Groot, W. Wisselink, V. Ladero, K. Burgess, D. van Sinderen, J. C. Piard, G. Eggink, E. J. Smid, G. Savoy, F. Sesma, T. Jansen, P. Hols, and M. Kleerebezem. 2002. Metabolic engineering of lactic acid bacteria for the production of nutraceuticals. Antonie Leeuwenhoek 82:217-235. [PubMed] [Google Scholar]
- 20.Hutkins, R. W., and N. L. Nannen. 1993. pH homeostasis in lactic acid bacteria. J. Dairy Sci. 76:2354-2365. [Google Scholar]
- 21.Iranzo, M., C. Aguado, C. Pallotti, J. V. Canizares, and S. Mormeneo. 2002. Transglutaminase activity is involved in Saccharomyces cerevisiae wall construction. Microbiology 148:1329-1334. [DOI] [PubMed] [Google Scholar]
- 22.Jeon, J. H., H. J. Lee, G. Y. Jang, C. W. Kim, D. M. Shim, S. Y. Cho, E. J. Yeo, S. C. Park, and I. G. Kim. 2004. Different inhibition characteristics of intracellular transglutaminase activity by cystamine and cysteamine. Exp. Mol. Med. 36:576-581. [DOI] [PubMed] [Google Scholar]
- 23.Jordan, A., E. Pontis, F. Aslund, U. Hellman, I. Gibert, and P. Reichard. 1996. The ribonucleotide reductase system of Lactococcus lactis. Characterization of an NrdEF enzyme and a new electron transport protein. J. Biol. Chem. 271:8779-8785. [DOI] [PubMed] [Google Scholar]
- 24.Kashket, E. R. 1987. Bioenergetics of lactic acid bacteria: cytoplasmic pH and osmotolerance. FEMS Microbiol. Rev. 46:233-244. [Google Scholar]
- 25.Kuipers, O. P., P. G. G. A. de Ruyter, M. Kleerebezem, and W. M. de Vos. 1997. Controlled overproduction of proteins by lactic acid bacteria. Trends Biotechnol. 15:135-140. [DOI] [PubMed] [Google Scholar]
- 26.Kuipers, O. P., P. G. G. A. de Ruyter, M. Kleerebezem, and W. M. de Vos. 1998. Quorum sensing-controlled gene expression in lactic acid bacteria. J. Biotechnol. 64:15-21. [Google Scholar]
- 27.Kuraishi, C., J. Sakamoto, and T. Soeda. 1996. The usefulness of transglutaminase for food processing, p. 29-38. In G. R. Takeoka, R. Teranishi, P. J. Williams, and A. Kobayashi (ed.), Biotechnology for improved foods and flavors. American Chemical Society, Washington, D.C.
- 28.Lee, Z. W., S. M. Kwon, S. W. Kim, S. J. Yi, Y. M. Kim, and K. S. Ha. 2003. Activation of in situ tissue transglutaminase by intracellular reactive oxygen species. Biochem. Biophys. Res. Commun. 305:633-640. [DOI] [PubMed] [Google Scholar]
- 29.Le Loir, Y., V. Azevedo, S. C. Oliveira, D. A. Freitas, A. Miyoshi, L. G. Bermudez-Humaran, S. Nouaille, L. A. Ribeiro, S. Leclercq, J. E. Gabriel, V. D. Guimaraes, M. N. Oliveira, C. Charlier, M. Gautier, and P. Langella. 2005. Protein secretion in Lactococcus lactis: an efficient way to increase the overall heterologous protein production. Microb. Cell Fact. 4:2. [DOI] [PMC free article] [PubMed] [Google Scholar]
- 30.Li, Y., J. Hugenholtz, T. Abee, and D. Molenaar. 2003. Glutathione protects Lactococcus lactis against oxidative stress. Appl. Environ. Microbiol. 69:5739-5745. [DOI] [PMC free article] [PubMed] [Google Scholar]
- 31.Li, Y., J. Hugenholtz, W. Sybesma, T. Abee, and D. Molenaar. 2005. Using Lactococcus lactis for glutathione overproduction. Appl. Microbiol. Biotechnol. 67:83-90. [DOI] [PubMed] [Google Scholar]
- 32.Lopez de Felipe, F., M. Kleerebezem, W. M. de Vos, and J. Hugenholtz. 1998. Cofactor engineering: a novel approach to metabolic engineering in Lactococcus lactis by controlled expression of NADH oxidase. J. Bacteriol. 180:3804-3808. [DOI] [PMC free article] [PubMed] [Google Scholar]
- 33.Maisnier-Patin, S., and J. Richard. 1996. Cell wall changes in nisin-resistant variants of Listeria innocua grown in the presence of high nisin concentrations. FEMS Microbiol. Lett. 140:29-35. [DOI] [PubMed] [Google Scholar]
- 34.Marquis, R. E., G. R. Bender, D. R. Murray, and A. Wong. 1987. Arginine deiminase system and bacterial adaptation to acid environments. Appl. Environ. Microbiol. 53:198-200. [DOI] [PMC free article] [PubMed] [Google Scholar]
- 35.Miller, G. L. 1959. Use of dinitrosalicylic acid reagent for determination of reducing sugar. Anal. Chem. 31:426-428. [Google Scholar]
- 36.Ngo, T. T., A. P. H. Phan, C. F. Yam, and H. M. Lenhoff. 1982. Interference in determination of ammonia with the hypochlorite-alkaline phenol method of Berthelot. Anal. Chem. 54:46-49. [Google Scholar]
- 37.O'Sullivan, E., and S. Condon. 1997. Intracellular pH is a major factor in the induction of tolerance to acid and other stresses in Lactococcus lactis. Appl. Environ. Microbiol. 63:4210-4215. [DOI] [PMC free article] [PubMed] [Google Scholar]
- 38.O'Sullivan, E., and S. Condon. 1999. Relationship between acid tolerance, cytoplasmic pH, and ATP and H+-ATPase levels in chemostat cultures of Lactococcus lactis. Appl. Environ. Microbiol. 65:2287-2293. [DOI] [PMC free article] [PubMed] [Google Scholar]
- 39.Prinz, W. A., F. Aslund, A. Holmgren, and J. Beckwith. 1997. The role of the thioredoxin and glutaredoxin pathways in reducing protein disulfide bonds in the Escherichia coli cytoplasm. J. Biol. Chem. 272:15661-15667. [DOI] [PubMed] [Google Scholar]
- 40.Rallu, F., A. Gruss, and E. Maguin. 1996. Lactococcus lactis and stress. Antonie Leeuwenhoek 70:243-251. [DOI] [PubMed] [Google Scholar]
- 41.Robinson, R. K., and A. Y. Tamime. 1990. Microbiology of fermented milks, p. 291-343. In R. K. Robinson (ed.), Dairy microbiology, vol. 2, 2nd ed. Elsevier Applied Science, London, United Kingdom. [Google Scholar]
- 42.Russell, J. B., and F. Diez-Gonzalez. 1998. The effects of fermentation acids on bacterial growth. Adv. Microb. Physiol. 39:205-234. [DOI] [PubMed] [Google Scholar]
- 43.Sambrook, J., E. F. Fritsch, and T. Maniatis. 1989. Molecular cloning: a laboratory manual, 2nd ed. Cold Spring Harbor Laboratory Press, Cold Spring Harbor, N.Y.
- 44.Sanders, J. W., G. Venema, and J. Kok. 1999. Environmental stress responses in Lactococcus lactis. FEMS Microbiol. Rev. 23:483-501. [Google Scholar]
- 45.Sibakov, M., T. Koivula, A. von Wright, and I. Palva. 1991. Secretion of TEM beta-lactamase with signal sequences isolated from the chromosome of Lactococcus lactis subsp. lactis. Appl. Environ. Microbiol. 57:341-348. [DOI] [PMC free article] [PubMed] [Google Scholar]
- 46.Siegumfeldt, H., K. Bjorn Rechinger, and M. Jakobsen. 2000. Dynamic changes of intracellular pH in individual lactic acid bacterium cells in response to a rapid drop in extracellular pH. Appl. Environ. Microbiol. 66:2330-2335. [DOI] [PMC free article] [PubMed] [Google Scholar]
- 47.Singh, T. K., M. A. Drake, and K. R. Cadwallader. 2003. Flavor of cheddar cheese: a chemical and sensory perspective. Comp. Rev. Food Sci. 2:139-162. [DOI] [PubMed] [Google Scholar]
- 48.Steidler, L., W. Hans, L. Schotte, S. Neirynck, F. Obermeier, W. Falk, W. Fiers, and E. Remaut. 2000. Treatment of murine colitis by Lactococcus lactis secreting interleukin-10. Science 289:1352-1355. [DOI] [PubMed] [Google Scholar]
- 49.Takehana, S., K. Washizu, K. Ando, S. Koikeda, K. Takeuchi, H. Matsui, M. Motoki, and H. Takagi. 1994. Chemical synthesis of the gene for microbial transglutaminase from Streptoverticillium and its expression in Escherichia coli. Biosci. Biotechnol. Biochem. 58:88-92. [DOI] [PubMed] [Google Scholar]
- 50.van de Guchte, M., P. Serror, C. Chervaux, T. Smokvina, S. D. Ehrlich, and E. Maguin. 2002. Stress responses in lactic acid bacteria. Antonie Leeuwenhoek 82:187-216. [PubMed] [Google Scholar]
- 51.Vido, K., H. Diemer, A. van Dorsselaer, E. Leize, V. Juillard, A. Gruss, and P. Gaudu. 2005. Roles of thioredoxin reductase during the aerobic life of Lactococcus lactis. J. Bacteriol. 187:601-610. [DOI] [PMC free article] [PubMed] [Google Scholar]
- 52.Washizu, K., K. Ando, S. Koikeda, S. Hirose, A. Matsuura, H. Takagi, M. Motoki, and K. Takeuchi. 1994. Molecular cloning of the gene for microbial transglutaminase from Streptoverticillium and its expression in Streptomyces lividans. Biosci. Biotechnol. Biochem. 58:82-87. [DOI] [PubMed] [Google Scholar]
- 53.Zheng, M., G. Du, and J. Chen. 2002. pH control strategy of batch microbial transglutaminase production with Streptoverticillium mobaraense. Enzyme Microb. Technol. 31:477-481. [Google Scholar]