Abstract
Current oscillations at about 24 MHz were observed during electrotransformation (ET) of the thermophilic anaerobes Clostridium thermocellum ATCC 27405, C. thermocellum DSM 1313, and Thermoanaerobacterium saccharolyticum YS 485, using a pulse gated by a square signal generated by a custom generator. In experiments in which only the field strength was varied, all three of these strains resulted in a one-to-one correspondence between the appearance of current oscillations and successful ET. Oscillations accompanied ET of both C. thermocellum strains only at field strengths of ≥12 kV/cm, and ET was only observed above the same threshold. Similarly, for T. saccharolyticum, oscillations were only observed at field strengths of ≥10 kV/cm, and ET was only observed above the same threshold. When a passive electrical filter consisting of an inductor and resistor in parallel was added to the system to prevent the development of oscillations, ET efficiencies were reduced dramatically for all three strains at all field strengths tested. The maximum tested field strength, 25 kV/cm, resulted in the maximum measured transformation efficiency for all three strains. At this field strength, the efficiency of ET in the absence of oscillations was decreased compared to that observed in the presence of oscillations by 500-fold for C. thermocellum ATCC 27405, 2,500-fold for C. thermocellum DSM 1313, and 280-fold for T. saccharolyticum. Controls using the same apparatus with Escherichia coli cells or a resistor with a value representative of the direct current resistance of typical cell samples did not develop oscillations, and ET efficiencies obtained with E. coli were the same with or without the electrical filter included in the pulse generator circuit. The results are interpreted to indicate that spontaneously arising oscillations have a large beneficial effect on transformation efficiency in the system employed here and that the development of oscillations in this system is affected by the cell species present.
The power of modern biotechnology has been applied to a very unequal extent across the microbial world because the functional transfer of foreign genes has not been achieved yet for many species and strains. In particular, gene transfer protocols are not available for most species of gram-positive obligate anaerobes. Moreover, the protocols which have been reported for such bacteria often have efficiencies (e.g., transformants μg−1 DNA) that are several orders of magnitude lower than those routinely achieved with easily transformed organisms such as Escherichia coli, Bacillus subtilis, and several yeast species (12, 14, 21).
Thermophilic, anaerobic, saccharolytic bacteria are of interest in the context of cellulosic biomass fermentation in both biotechnological processes and natural environments (1, 4-9, 15). In particular, cocultures of the cellulolytic Clostridium thermocellum with noncellulolytic thermophiles capable of using xylose and other hemicellulose-derived sugars have been proposed for the conversion of all fermentable biomass components to ethanol (7, 8, 13, 16). Recently, we reported electrotransformation (ET) of Clostridium thermocellum DSMZ 1313 with an efficiency of 2 × 10⁵ transformants μg−1, using a custom pulse generator and cuvette design (17). The conditions optimized for C. thermocellum DSMZ 1313 were also shown to result in an ET efficiency of 5 × 10⁴ transformants μg−1 for strain ATCC 27405. Mai and Wiegel reported (11), and subsequently improved (10), an electrotransformation protocol for the xylan-utilizing noncellulolytic thermophile Thermoanaerobacterium saccharolyticum JW/SL-YS 485, resulting in transformation efficiencies of ∼1 × 10³ transformants μg−1 DNA.
We report here that current oscillations with a frequency of ∼24 MHz are observed during ET of both C. thermocellum and T. saccharolyticum when a square, non-oscillatory input signal is used to control a pulse generator (19, 22), using a previously reported ET protocol (17). Spontaneous (i.e., not applied externally) current oscillations at much lower frequencies have been observed in prior studies using the same circuit and cuvette design, with ∼100-kHz oscillations observed for Clostridium acetobutylicum ATCC 824 (18) and ∼17-kHz oscillations observed for Corynebacterium glutamicum ATCC 13032 (19). Externally applied oscillatory electrical pulses were shown to be effective for ET of C. acetobutylicum, with the ET efficiency being a strong function of the frequency (18). Externally applied oscillatory pulses have also been used for ET of other microorganisms (14) and mammalian cells (3, 23).
The objectives of this study are to report improved ET conditions for C. thermocellum and T. saccharolyticum, to characterize the current oscillations observed during ET of both of these organisms, and to evaluate the significance of these oscillations. Specific questions to be answered in this work include the following. Does the appearance of oscillations depend on the species of microbe being tested? How does the magnitude of applied voltage impact the appearance and features of oscillations? Is there a relationship between the appearance of oscillations and conditions that result in successful ET? If oscillations are prevented from occurring, is the efficiency of ET impacted?
MATERIALS AND METHODS
Media, strains, and cultivation conditions.
The strains used for this study are listed in Table 1. C. thermocellum and T. saccharolyticum were grown in DSM 122 broth as described elsewhere (http://www.dsmz.de/media/med122.htm), with the following modifications: the concentration of K2HPO4 · 3H2O was reduced from 7.2 g liter−1 to 1.9 g liter−1, and glutathione was replaced by cysteine-HCl at a final concentration of 0.5 g liter−1. For growth on plates, 0.58% Difco agar-agar (Becton Dickinson, Sparks, MD) was added to modified DSM 122-cellobiose broth (cellobiose agar). Cellobiose agar additionally contained erythromycin (Em) and lincomycin (Lm), each at 20 μg ml−1, for the selection of transformants of C. thermocellum or 200 μg ml−1 of kanamycin (Km) for the selection of transformants of T. saccharolyticum (all antibiotics were purchased from Sigma, St. Louis, MO). All manipulations associated with the preparation of cultures and subsequent ET were carried out inside an anaerobic chamber equipped with a model 2000 incubator (Coy Laboratory Products, Inc., Grass Lake, MI). E. coli Top 10 cells (Invitrogen Corporation, Carlsbad, CA) were grown at 37°C in Columbia broth or on Columbia agar (Columbia broth plus 1.2% Difco agar-agar) containing 200 μg ml−1 of ampicillin (Ap) (Sigma, St. Louis, MO) for the selection of transformants, when appropriate.
TABLE 1.
Bacterial strains used for this study
| Microorganism | Sourcea |
|---|---|
| Escherichia coli | |
| Top 10 | Invitrogen |
| Clostridium thermocellum | |
| ATCC 27405 | ATCC |
| DSM 1313 | DSMZ |
| Thermoanaerobacter saccharolyticum | |
| YS 485 | Gift from Juergen Wiegelb |
Invitrogen, Grand Island, NY; ATCC, American Type Culture Collection, Manassas, VA; DSMZ, Deutsche Sammlung von Mikroorganismen und Zellkulturen, Braunschweig, Germany.
University of Georgia, Athens.
Plasmid DNA.
The shuttle plasmid pIKM1 (6.3 kb; Apr Emr Lmr Kmr) (11) was a gift from Juergen Wiegel (University of Georgia, Athens). pIKM1 DNA was isolated from E. coli using a QIAGEN Plasmid Midi kit (QIAGEN Inc., Valencia, CA). The detection of plasmid DNA in presumptive transformants was performed as described elsewhere (17).
Electrotransformation.
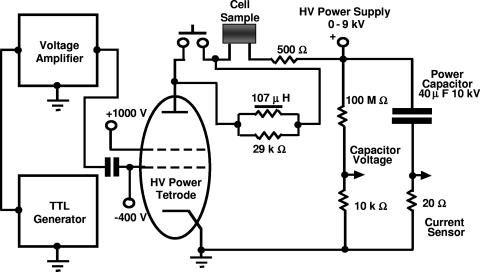
A custom-built pulse generator featuring the cell sample in series with other circuit elements as well as custom-built cuvettes was used as described elsewhere (17). The cultivation of anaerobic thermophiles prior to ET, pulse application, postpulse sample processing, and determination and analysis of cell viability were performed as described previously (17), with the following modification: prior to ET, overnight cultures were diluted 1:7 to 1:10 instead of 1:3 with sterile prewarmed (58°C) DSM 122-cellobiose broth containing 20 μg ml−1 of isoniazid (Sigma, St. Louis, MO). The duration of the electrical pulse applied was as indicated previously. The preparation of E. coli cells for ET and the selection of recombinants were performed as described elsewhere (20). Cell suspensions of thermophilic anaerobes or E. coli contained approximately 9 × 10¹⁰ cells ml−1 and were kept on ice until use. For cell-free controls, cell suspensions were replaced either by high-performance liquid chromatography (HPLC)-grade water (Sigma, St. Louis, MO) or by a set of three low-inductance 10-kΩ resistors (TO 220 style thick film power resistors; Ohmite Mfg. Co., Rolling Meadows, IL) (cell sample resistive equivalent) connected in series. As described previously (17), ET was carried out using 90 to 100 μl of cell suspension in 2.0-ml disposable centrifuge tubes with 305 stainless steel electrodes and a single square input pulse of 10 ms. For experiments aimed at investigating the importance of induced oscillations with respect to ET, we used a custom-built linear filter composed of TO 220 style thick film power resistors (Ohmite Mfg. Co., Rolling Meadows, IL) with a total resistance of 29 kΩ in parallel with a toroidal 107-μH filter inductor (Magnetek, Inc., Los Angeles, CA). The filter was switched in series with the other elements of the above power circuit so that it could be bypassed to eliminate the filtering effect on the pulse current (Fig. 1).
FIG. 1.
Schematic diagram of the custom-built generator featuring a passive in-line filter.
Monitoring of pulse current.
Experiments aimed at characterizing the electrical response of cell suspensions to an applied pulse, rather than ET per se, were carried out using the same conditions except that no added DNA was present, electrodes were made of the titanium alloy VK-2 (JCV Sphere, Saratov, Russian Federation) instead of stainless steel, the duration of the pulse was 6 ms rather than 10 ms, and 50-μl cell samples in 0.5-ml disposable tubes were used instead of 2.0-ml tubes. Different pulse durations and sample volumes were used for characterization of the electrical response in order to prolong the life of the electrodes. Twenty identical 50-μl cell samples were prepared and kept on ice in disposable 0.5-ml polypropylene tubes used as cuvettes. For each such sample, the power capacitor was charged to a certain voltage, at 200-V increments. The electric field strengths at cell samples were calculated for the peak pulse voltage (leading edge). Each time, the power supply was disconnected from the capacitor before pulse application. After each pulse, electrodes were washed with water, and then both electrode surfaces were polished with jewelry-fine abrasive (Delta Tool and Polishing Supplies Co., Inc., Garwood, NJ) backed by a flat piece of 2-mm-thick cardboard to restore the initial electrical properties of the electrode surfaces. Thereafter, the abrasive was removed by washing twice with 96% ethanol, with subsequent drying of the surfaces. The pulse current passing through each sample was recorded with an oscilloscope (Agilent Technologies, Colorado Springs, CO). Extensive control experiments established that the current versus time patterns, and in particular key features such as current oscillations, were highly reproducible and were essentially the same for the conditions used for ET and for electrical response characterization.
RESULTS
Improved ET conditions for C. thermocellum and transformation of T. saccharolyticum.
Changing the dilution of overnight cultures with fresh medium from 1:3 to a dilution of 1:7 to 1:10 when preparing cells for electroporation resulted in a small but statistically significant increase in ET efficiency compared to the conditions we reported previously for C. thermocellum (17). In particular, the use of a 1:7 to 1:10 dilution ratio in the presence of isoniazid at 20 μg ml−1 increased the efficiency of ET with pIKM1, using erythromycin/lincomycin coselection, from (2.5 ± 0.5) × 105 to (5.06 ± 0.32) × 105 transformants μg−1 for strain DSM 1313 and from (6.4 ± 0.14) × 104 to (7.53 ± 0.12) × 104 transformants μg−1 for strain ATCC 27405, with an electric field strength of 25 kV/cm.
The revised preferred conditions found to be effective for these two C. thermocellum strains were also evaluated for ET of Thermoanaerobacterium saccharolyticum YS 485, using pIKM1 with selection based on kanamycin resistance. T. saccharolyticum was readily transformed [(7.42 ± 0.19) × 105 transformants μg−1 DNA at 25 kV/cm] under these conditions, without further optimization. The transformation of T. saccharolyticum was confirmed by PCR and plasmid rescue experiments (data not shown) similar to those we described previously (17).
Observation of current oscillations during electrotransformation.
During monitoring of the pulse current, rapid variations of the current over time were observed for C. thermocellum ATCC 27405 (Fig. 2A), T. saccharolyticum YS 485 (Fig. 2B), and C. thermocellum DSM 1313 (data not shown). Adjusting the oscilloscope timescale revealed regular oscillations with a frequency of 24.14 MHz, as shown in Fig. 2C for C. thermocellum ATCC 27405. An oscillation frequency of 24.14 MHz was also observed with C. thermocellum DSM 1313 and T. saccharolyticum YS 485 (data not shown). Although the appearance and magnitude of oscillations were subsequently found to depend on the magnitude of the voltage applied to samples, the frequency of oscillation was unchanged for all conditions under which oscillations were observed for the three thermophilic strains investigated.
FIG. 2.
Voltage versus time plots obtained during application of an electrical pulse to various samples. Voltage was measured at the 20-Ω pulse current sensor. Vertical scale, 5 V/division; horizontal scale, 2 ms/division, except in panel C. (A) C. thermocellum ATCC 27405; (B) T. saccharolyticum YS 485; (C) image A, with a horizontal scale of 20 ns/division. Controls contained the indicated components instead of a sample containing cells of a thermophilic anaerobe. (D) 50-kΩ resistor; (E) cuvette filled with HPLC-grade water; (F) E. coli Top 10 in HPLC-grade water.
Control experiments were carried out to test whether the appearance of high-frequency current oscillations is dependent on the presence of cell-containing samples and the identity of the cells in the sample. Either no oscillations or only very-low-frequency (<500 Hz) low-amplitude oscillations were observed when the cell sample was replaced by a sample resistive equivalent (Fig. 2D), HPLC-grade water (Fig. 2E), or a suspension of E. coli cells (Fig. 2F). Successful ET of E. coli was verified, although current oscillations were not observed.
Investigation of current oscillations and ET efficiency as a function of electric field strength.
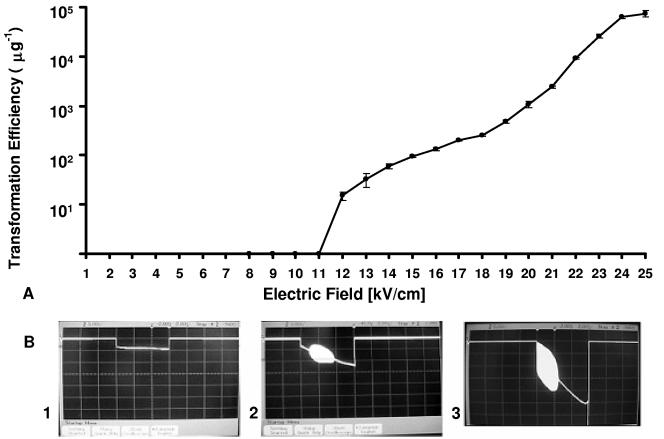
The ET efficiency was investigated in relation to the electric field strength, with all parameters but the field strength maintained at the revised preferred conditions identified above. For C. thermocellum ATCC 2704, a minimum field strength of 12 kV/cm was required before transformation was observed, with progressively higher transformation efficiencies observed up to the maximum field strength tested, 25 kV/cm (Fig. 3). The current passing through cell samples during pulse application was measured at all field strengths for which the transformation efficiency was evaluated, with data for only selected field strengths shown. A one-to-one correspondence between successful ET and the appearance of oscillations was observed. In particular, oscillations were not evident for field strengths of 11 kV/cm (Fig. 3B, panel 1) or lower, at which transformation did not occur, but were observed for field strengths from 12 kV/cm (Fig. 3B, panel 2) to 25 kV/cm (Fig. 3B, panel 3), at which transformation did occur. C. thermocellum DSM 1313 also exhibited a minimum field strength of 12 kV/cm in order for transformation to occur as well as a one-to-one correspondence between successful ET and the appearance of oscillations (data not shown).
FIG. 3.
Transformation efficiency and appearance of spontaneous oscillations in relation to field strength for ET of C. thermocellum ATCC 27405. (A) ET efficiency. (B) Oscillations for field strengths of 11 kV/cm (1), 12 kV/cm (2), and 25 kV/cm (3). Vertical scale, 5 V/division; horizontal scale, 2 ms/division.
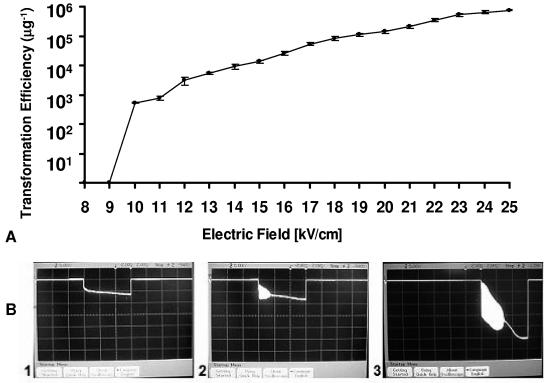
Similarly, for T. saccharolyticum, successful ET required a field strength of ≥10 kV/cm (Fig. 4 A), at which high-frequency current oscillations were observed (Fig. 4B, panels 2 and 3). For field strengths of <10 kV/cm, neither oscillations nor transformation was observed (Fig. 4B, panel 1).
FIG. 4.
Transformation efficiency and appearance of spontaneous oscillations in relation to field strength for ET of T. saccharolyticum YS 485. (A) ET efficiency. (B) Oscillations for field strengths of 9 kV/cm (1), 10 kV/cm (2), and 25 kV/cm (3). Vertical scale, 5 V/division; horizontal scale, 2 ms/division.
Impact of eliminating current oscillations on ET efficiency.
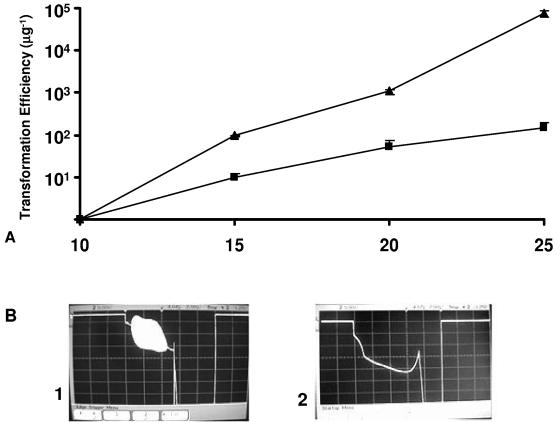
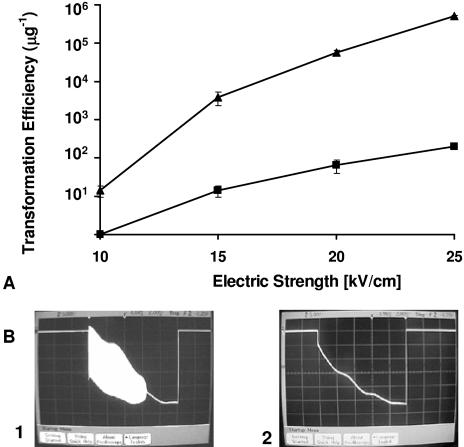
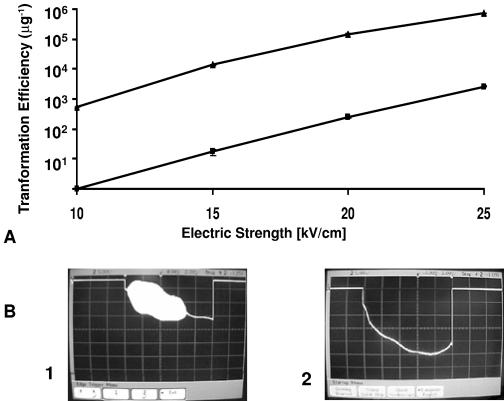
A passive electrical filter was designed to eliminate high-frequency current oscillations. The filter was added to the pulse generator circuit as described in Materials and Methods, and ET efficiencies were compared in the presence and absence of such oscillations. For C. thermocellum ATCC 27405, the ET efficiency observed in the absence of the filter was higher than that observed with the filter, by at least 10-fold, for all field strengths tested (Fig. 5A). For the highest field strength tested (25 kVcm), resulting in the highest observed ET efficiencies, the presence of the filter reduced the ET efficiency 500-fold, from (7.53 ± 1.2) × 104 transformants μg−1 to (1.51 ± 0.36) × 102 transformants μg−1. An approximately 1,000-fold reduction in transformation efficiency in the presence of the filter compared to that without the filter was also observed for C. thermocellum DSM 1313 at all voltages tested (Fig. 6A). Similarly, for T. saccharolyticum YS 485, the transformation efficiency without the filter was higher than that observed with the filter, by at least 100-fold, for all voltages tested. At 25 kV/cm, which also resulted in the highest observed ET efficiency for T. saccharolyticum, the presence of the filter reduced the ET efficiency 280-fold, from (7.42 ± 0.19) × 105 transformants μg−1 without the filter to (2.63 ± 0.15) × 103 transformants μg−1 with the filter (Fig. 7A). For all three strains, the presence of the filter eliminated high-frequency oscillations, as may be seen by comparing Fig. 5B, panels 1 and 2, for C. thermocellum ATCC 27405, comparing Fig. 6B, panels 1 and 2, for C. thermocellum DSM 1313, and comparing Fig. 7B, panels 1 and 2, for T. saccharolyticum YS 485.
FIG. 5.
ET efficiency in relation to field strength in the presence and absence of high-frequency oscillations for ET of C. thermocellum ATCC 27405. (A) Transformation efficiencies. Symbols: ▴, efficiency without in-line filter preventing high-frequency oscillations; ▪, efficiency with in-line filter. (B) Voltage traces during pulse application at 25 kV/cm without in-line filter (1) and with in-line filter (2). Vertical scale, 5 V/division; horizontal scale, 2 ms/division.
FIG. 6.
ET efficiency in relation to field strength in the presence and absence of high-frequency oscillations for ET of C. thermocellum DSM 1313. (A) Transformation efficiencies. Symbols: ▴, efficiency without in-line filter preventing high-frequency oscillations; ▪, efficiency with in-line filter. (B) Voltage traces during pulse application at 25 kV/cm without in-line filter (1) and with in-line filter (2). Vertical scale, 5 V/division; horizontal scale, 2 ms/division.
FIG. 7.
ET efficiency in relation to field strength in the presence and absence of high-frequency oscillations for ET of T. saccharolyticum YS 485. (A) Transformation efficiencies. Symbols: ▴, efficiency without in-line filter preventing high-frequency oscillations; ▪, efficiency with in-line filter. (B) Voltage traces during pulse application at 25 kV/cm without in-line filter (1) and with in-line filter (2). Vertical scale, 5 V/division; horizontal scale, 2 ms/division.
DISCUSSION
Current oscillations at about 24 MHz were observed during ET of C. thermocellum strains ATCC 27405 and DSM 1313 as well as of T. saccharolyticum YS 485, using a custom pulse generator gated with a square signal. Current oscillations and successful transformation were only observed at and above threshold levels of electric field strength, i.e., 10 kV/cm for T. saccharolyticum and 12 kV/cm for both C. thermocellum strains, with neither oscillations nor transformation observed below the threshold (Fig. 3B, panel 2, and 4B, panel 2). When oscillations were prevented by use of a passive electrical filter, the transformation efficiency decreased 500-fold for C. thermocellum ATCC 27405, 2,500-fold (at 25 kV/cm) for C. thermocellum DSM 1313, and 280-fold for T. saccharolyticum. The large differences in ET efficiency observed herein in the presence and absence of spontaneously occurring oscillations are in sharp contrast to the much smaller (fivefold or less) differences observed with and without externally applied oscillations in prior work involving mammalian cells (3, 23).
These observations establish that oscillations are correlated with high-frequency transformation for the organisms and electrical circuit studied. Our results are also consistent with, but do not prove, the existence of a common factor underlying both efficient transformation and the development of current oscillations. Successful ET requires that both electrical and biological variables be within acceptable ranges. We suspect that monitoring the current during pulse application may provide an indication of cell membrane electropermeabilization, which can be evaluated independently of biological variables such as restriction/modification systems, plasmid replication, and functional expression of selective markers.
Further work is needed to explain the origin of the observed oscillations. Oscillations are possible in similar circuits with no bacterial cells due to parasitic inductances and capacitances in the wiring and in the circuit elements in conjunction with the explicit circuit elements and the gain of the tetrode. However, our results show that the appearance of oscillations is dependent on the species of bacterium present under the conditions investigated. Cells of both T. saccharolyticum and C. thermocellum provided similar oscillation patterns at and above the threshold electric field strengths of 10 and 12 kV/cm, respectively. In contrast, we were not able to observe an excitation of oscillations when E. coli was substituted for thermophilic anaerobes at all electric field strengths tested. In addition, no current oscillations were detected when the cell sample was replaced with its resistive equivalent or with HPLC-grade water. Thus, we can conclude that the electrical characteristics of the cell samples play an important role in the appearance of the spontaneous oscillations observed. These electrical characteristics may include nonlinear and/or time-varying behavior that cannot be characterized by a linear time-invariant network or impedance.
In previous work using the same pulse generator employed herein, Tyurin et al. (18) reported oscillations of C. acetobutylicum ATCC 824 at about 100 kHz. When the circuit was modified to apply a range of selected frequencies to the sample, the ET efficiency peaked at 100 kHz. These results indicate that the frequency of spontaneously occurring current oscillations obtained with the pulse generator used herein is related to electroporation or associated biological phenomena and that these oscillations are a determinant of ET efficiency. Experiments involving externally imposed oscillatory signals would be very informative to undertake with the thermophilic strains investigated in this study, and they are being planned but are more demanding to perform because of the higher frequencies involved. The prior study of Tyurin et al. also reported the release of numerous intracellular membrane vesicles under conditions resulting in spontaneous oscillations and successful ET. Many gram-positive bacteria have a complex intracellular morphology. In particular, bacteria of the genus Clostridium feature prespores in most vegetative cells, as well as additional intracellular membrane structures (2, 18). E. coli, which does not form spores, has a relatively simple intracellular morphology in comparison. We are intrigued by the possibility that when cell membranes are electropermeabilized, intracellular membrane structures of cells of certain bacterial species become exposed to the applied electric field through the electropores in the membrane, resulting in dynamic changes in the impedance of cell samples.
Much remains to be done to elucidate the mechanism and significance of spontaneous oscillations accompanying high-efficiency ET of certain thermophilic anaerobes. There appears to be ample incentive to undertake studies directed toward this end in light of the interesting fundamental questions involved, several indications that the appearance of oscillations is closely associated with high-frequency transformation, and the difficulty and desirability of gene transfer to many microorganisms.
Acknowledgments
This work was supported by grant 60NANB1D0064 from the U.S. National Institute of Standards and Technology and by grant DE-FG02-02ER1530 from the U.S. Department of Energy.
We are grateful to Gunter A. Hoffman and Genetronics, Inc., for giving the custom-built generator to M.V.T.
REFERENCES
- 1.Bayer, E. A., J.-P. Belaich, Y. Shoham, and R. Lamed. 2004. The cellulosome: multienzyme machines for degradation of plant cell wall polysaccharides. Annu. Rev. Microbiol. 58:521-554. [DOI] [PubMed] [Google Scholar]
- 2.Cato, E. P., W. L. George, and S. M. Finegold. 1986. Clostridium thermocellum Vilojen, Fred and Peterson 1926, 7AL, p. 1160, 1197. In P. H. A. Sneath, N. S. Mair, M. E. Sharpe, and J. G. Holt (ed.), Bergey's manual of systemic bacteriology, 2nd ed., vol. 2. Williams & Wilkins, Baltimore, Md. [Google Scholar]
- 3.Chang, D. C. 1989. Cell poration and cell fusion using an oscillating electric field. Biophys. J. 56:641-652. [DOI] [PMC free article] [PubMed] [Google Scholar]
- 4.Das, H., and S. K. Singh. 2004. Useful byproducts from cellulosic wastes of agriculture and food industry—a critical appraisal. Crit. Rev. Food Sci. Nutr. 44:77-89. [DOI] [PubMed] [Google Scholar]
- 5.Doi, R. H., and A. Kosugi. 2004. Cellulosomes: plant-cell-wall-degrading enzyme complexes. Nat. Rev. Microbiol. 2:541-551. [DOI] [PubMed] [Google Scholar]
- 6.Lee, Y.-E., M. K. Jain, C. Lee, S. E. Lowe, and J. G. Zeikus. 1993. Taxonomic distinction of saccharolytic thermophilic anaerobes: description of Thermoanaerobacterium xylanolyticum gen. nov., sp. nov., and Thermoanaerobacterium saccharolyticum gen. nov., sp. nov.; reclassification of Thermoanaerobium brockii, Clostridium thermosulfurogenes, and Clostridium thermohydrosulfuricum E100-69 as Thermoanaerobacter brockii comb. nov., Thermoanaerobacterium thermosulfurigenes comb. nov., and Thermoanaerobacter thermohydrosulfuricus comb. nov., respectively; and transfer of Clostridium thermohydrosulfuricum 39E to Thermoanaerobacter ethanolicus. Int. J. Syst. Bacteriol. 43:41-51. [Google Scholar]
- 7.Lynd, L. R., P. J. Weimer, W. H. van Zyl, and I. S. Pretorius. 2002. Microbial cellulose utilization: fundamentals and biotechnology. Microbiol. Mol. Biol. Rev. 66:506-577. [DOI] [PMC free article] [PubMed] [Google Scholar]
- 8.Lynd, L. R., C. E. Wyman, and T. U. Gerngross. 1999. Biocommodity engineering. Biotechnol. Prog. 15:777-793. [DOI] [PubMed] [Google Scholar]
- 9.Lynd, L. R., H. E. Grethlein, and R. H. Wolkin. 1989. Fermentation of cellulosic substrates in batch and continuous culture by Clostridium thermocellum. Appl. Environ. Microbiol. 55:3131-3139. [DOI] [PMC free article] [PubMed] [Google Scholar]
- 10.Mai, V., and J. Wiegel. 1999. Recombinant DNA applications in thermophiles, p. 511-519. In A. L. Demain and J. E. Davis (ed.), Manual of industrial microbiology and biotechnology, 2nd ed. ASM Press, Washington, D.C.
- 11.Mai, V., W. W. Lorenz, and J. Wiegel. 1997. Transformation of Thermoanaerobacterium sp. strain JW/SL-Y485 with plasmid pIKm1 conferring kanamycin resistance. FEMS Microbiol. Lett. 148:163-167. [Google Scholar]
- 12.Mermelstein, L., and E. T. Papoutsakis. 1993. In vivo methylation in Escherichia coli by the Bacillus subtilis phage φ3T I methyltransferase to protect plasmids from restriction upon transformation of Clostridium acetobutylicum ATCC 824. Appl. Environ. Microbiol. 59:1077-1081. [DOI] [PMC free article] [PubMed] [Google Scholar]
- 13.Ng, T. K., A. Ben-Bassat, and J. G. Zeikus. 1981. Ethanol production by thermophilic bacteria: fermentation of cellulosic substrates by cocultures of Clostridium thermocellum and Clostridium thermohydrosulfuricum. Appl. Environ. Microbiol. 41:1337-1343. [DOI] [PMC free article] [PubMed] [Google Scholar]
- 14.Puc, M., S. Corovic, K. Flisar, M. Petkovsek, J. Nastran, and D. Miklavcic. 2004. Techniques of signal generation required for electropermeabilization. Survey of electropermeabilization devices. Bioelectrochemistry 64:113-124. [DOI] [PubMed] [Google Scholar]
- 15.Schwarz, W. H. 2001. The cellulosome and cellulose degradation by anaerobic bacteria. Appl. Microbiol. Biotechnol. 56:634-649. [DOI] [PubMed] [Google Scholar]
- 16.Slapack, G. E., I. Russell, and G. G. Stewart. 1987. Thermophilic microbes in ethanol production. CRC Press, Inc., Boca Raton, Fla.
- 17.Tyurin, M. V., S. G. Desai, and L. R. Lynd. 2004. Electrotransformation of Clostridium thermocellum. Appl. Environ. Microbiol. 70:883-890. [DOI] [PMC free article] [PubMed] [Google Scholar]
- 18.Tyurin, M. V., R. Padda, K.-X. Huang, S. Wardwell, D. Caprette, and G. N. Bennett. 2000. Electrotransformation of Clostridium acetobutylicum ATCC 824 using high voltage radio frequency modulated square pulses. J. Appl. Microbiol. 88:220-227. [DOI] [PubMed] [Google Scholar]
- 19.Tyurin, M. V., E. B. Voroshilova, I. G. Rostova, N. I. Oparina, and M. M. Gusiatiner. 1998. Electric response of internal membrane structures of corynebacteria during electrotransformation. Mikrobiologiia 67:338-344. [PubMed] [Google Scholar]
- 20.Tyurin, M. V., V. G. Doroshenko, and N. I. Oparina. 1997. Electrofusion of Escherichia coli cells. Membr. Cell Biol. 11:121-129. [PubMed] [Google Scholar]
- 21.Tyurin, M. V., and V. A. Livshits. 1994. Some practical aspects of bacterial electrotransformation. Biologicheskiye Membrany 11:117-139. (In Russian.) [Google Scholar]
- 22.Tyurin, M. V. October. 1992. Method for cell suspension treatment with electric current, and an apparatus for the treatment. Russian patent 2-005776.
- 23.Zald, P. B., M. A. Cotter, and E. S. Robertso. 2001. Strategy for increased efficiency of transfection in human cell lines using radio frequency electroporation. Prep. Biochem. Biotechnol. 31:1-11. [DOI] [PubMed] [Google Scholar]


